Western University Western University
Scholarship@Western
Scholarship@Western
Electronic Thesis and Dissertation Repository
10-17-2013 12:00 AM
Optimisation of the Transesterification Stage of Biodiesel
Optimisation of the Transesterification Stage of Biodiesel
Production using statistical methods
Production using statistical methods
Arnold Paintsil
The University of Western Ontario
Supervisor
Professor E.K. Yanful
The University of Western Ontario
Graduate Program in Civil and Environmental Engineering
A thesis submitted in partial fulfillment of the requirements for the degree in Master of Engineering Science
© Arnold Paintsil 2013
Follow this and additional works at: https://ir.lib.uwo.ca/etd
Part of the Catalysis and Reaction Engineering Commons, Environmental Engineering Commons, and the Other Chemical Engineering Commons
Recommended Citation Recommended Citation
Paintsil, Arnold, "Optimisation of the Transesterification Stage of Biodiesel Production using statistical methods" (2013). Electronic Thesis and Dissertation Repository. 1693.
https://ir.lib.uwo.ca/etd/1693
This Dissertation/Thesis is brought to you for free and open access by Scholarship@Western. It has been accepted for inclusion in Electronic Thesis and Dissertation Repository by an authorized administrator of
OPTIMISATION OF THE TRANSESTERIFICATION STAGE OF BIODIESEL PRODUCTION USING STATISTICAL METHODS
by
Arnold Paintsil
Graduate program in Civil and Environmental Engineering
A thesis submitted in partial fulfilment
of the requirements for the degree of
Master of Engineering science
The school of Graduate and Postdoctoral studies
The University of Western Ontario
London, Ontario, Canada
ii
Abstract
The present research examines solely the transesterification stage of the biodiesel production
process. Six process variables that affect the yield of biodiesel at this stage are examined using the
12 run Plackett-Burman Design. To study the effect of FFA1 and to replicate real life situations
where oil (feedstock) contain varying amounts of FFA, linoleic acid is used as FFA and
intentionally added to high oleic acid canola oil containing less than 0.07% FFA. The process is
catalyzed with potassium carbonate and evaluated at varying temperatures, stirring rates, reaction
times and methanol oil ratios. The yields at the end of these reactions are measured and the active
factors determined with the PB2 design in Minitab software. At the end of the experimental design,
it was found that the FFA amount affects the yield of biodiesel the most and methanol-oil ratio the
least for the range of values studied.
The Box-Behnken method was then applied in optimising the amount of free fatty acid, the amount
of catalyst and the stirring speed. The relationship between the yield and the three (3) factors was
determined using analysis of variance (ANOVA) and subsequently optimised.
The optimised factor combination for a percentage yield greater than 98% was found for a 1 hour
reaction to be 0.5 wt% FFA, 400 rpm stirring rate and 4 wt% catalyst at 60˚C temperature and 6:1
methanol-oil ratio for 100 g of Canola oil.
1 FFA refers to Free Fatty Acid
iii
Keywords
Transesterification, Plackett-Burman design, biofuel, biodiesel, ANOVA, Free fatty acid,
Optimisation, Canola Oil, Potassium carbonate, factorial design, Active factors.
Acknowledgements
The research has been funded by an Individual Discovery Grant awarded to Prof. E.K. Yanful by
the Natural Sciences and Engineering Research Council of Canada (NSERC).
I would like to thank Prof. E.K Yanful for his support all through the research. Your great
supervision and constructive criticisms helped me immensely.
I would also like to thank Mr. Brian Dennis at the Chemical Engineering labs. Your ideas and
suggestions also helped shape the outcome of this project.
Many thanks to Mr. Tim Stephens, laboratory technician at the Department of Civil and
Environmental Engineering for all the help he gave me and the many odd times I had to call him
for help. Many of the times I learnt in the lab, I learnt from you. Thank you.
Special thanks to my friends who took the time to read my report. This report is partly a product
iv
Table of contents
Abstract ... ii
Keywords ... iii
Acknowledgements ... iii
Table of contents ... iv
List of tables ... vi
List of figures ... vi
List of schemes ... vi
List of equations ... vii
Chapter 1 ... 1
1 Introduction ... 1
Background of research ... 1
Experimental Plan ... 4
Experimental procedure ... 5
Chapter 2 ... 6
2 Literature review ... 6
Blending with petrodiesel... 10
Micro-emulsification ... 11
Pyrolysis ... 12
Transesterification ... 13
2.4.1 Acid-Catalyzed Processes ... 14
2.4.2 Base-Catalyzed Processes ... 16
2.4.3 Choice of Catalyst (K2CO3) ... 18
Design of experiment ... 18
Chapter 3 ... 23
3 Effect of process variables on transesterification: a Plackett-Burman design application .... 23
Introduction ... 23
Materials ... 27
Method ... 27
v
3.3.2 Experimental Design (Plackett-Burman Design)... 29
3.3.3 Gas Chromatography Analysis ... 32
Results and Discussion ... 32
Results ... 34
Analysis ... 36
Conclusion ... 40
Chapter 4 ... 42
4 Optimisation of biodiesel transesterification process variables: a Box-Behnken design application ... 42
Introduction ... 42
Materials ... 43
Method ... 44
4.3.1 Experimental Set-Up ... 44
4.3.2 Experimental Design (Box-Behnken Design) ... 45
4.3.3 Gas Chromatography Analysis ... 47
Results and Discussion ... 48
4.4.1 Results ... 50
4.4.2 Analysis... 51
Conclusion ... 57
References ... 58
Chapter 5 ... 60
5 Discussion and Conclusion ... 60
Chapter 6 ... 62
6 Appendix ... 62
GC Conditions ... 62
Plackett-Burman Results ... 62
Box-Behnken Results ... 64
Formulae and short notes ... 65
Chapter 7 ... 67
vi
List of tables
Table 1: Plackett-Burman Design ... Error! Bookmark not defined.
Table 2: factor notations and amounts ... 30
Table 3: factor calculations ... 31
Table 4: Results (% yield) from the screening experiment... 34
Table 5: Estimated Effects and coefficients for Yield ... 35
Table 6: Box-Behnken Design ... 46
Table 7: factor notations and amounts ... 47
Table 8: Results (in % yield) from the Box-Behnken design experiment ... 50
Table 9: Estimated coefficients and effects for yield... 51
Table 10: Analysis of Variance for Yield ... 53
List of figures
Figure 1: Process flow diagram; Transesterification stage ... Error! Bookmark not defined. Figure 2: Experimental set-up ... 28Figure 3: Normal Probability Plot for the Yield ... 37
Figure 4: Pareto chart of Effects ... 39
Figure 5: Process flow diagram; Transesterification stage ... 44
Figure 6: Experimental set-up ... 45
Figure 7: Normal Probability Yield ... 53
Figure 8: Surface Plot of Yield against factors ... 55
Figure 9: Contour plot of Yield ... 56
List of schemes
Scheme 1: Mechanism of Acid catalyzed transesterification of Vegetable Oil (Schuchardi et. al, 1998) ... 15Scheme 2: Mechanism of base catalyzed transesterification of vegetable oil (Schuchardi et al., 1998) ... 16
Scheme 3: hydrolysis of esters and further reaction to form soap ... 17
vii
List of equations
Equation 3-1: Amount of FFA in B100 biodiesel ... 32 Equation 3-2: Model equation from P.B. design ... 37
Acronyms
ANOVA – Analysis of Variance
TAG – Triacylglycerol
FAME – Fatty Acid Methyl Esters
GC – Gas Chromatography
C19 – Methyl nonadecanoate
DF – Degrees of freedom
SEQ SS – Sequential Sum of Squares
ADJ SS – Adjusted Sum of Squares
ADJ MS – Adjusted mean squares
COEFF – Coefficient
SE COEFF – Standard Error of the coefficient
S.D. – Standard deviation
1
Chapter 1
1
Introduction
Background of research
Crude oil has been the world’s sole energy source for a long time. With the increase in population
and advances in technology comes increase in the world’s dependence on oil. The increased
dependence on oil suggests natural oil reserves are likely to be depleted in the near future.
Worldwide energy consumption has increased 17 folds in the last century. Known petroleum
reserves are estimated to be depleted in less than 50 years at the present rate of consumption
(Demirbas, 2006 ).
Biofuels are an alternative to the sole dependence on oil. It presents another source to rely on if
there is a break in the supply of oil and, also, it relieves the stress on oil consumption. Increase in
biofuel production would mean an increase in plant and animal production since more feedstock
would be required, which would also increase jobs. This is very important, especially for
developing countries where the rate of unemployment is high.
Biodiesel is one such biofuel that is produced using the transesterification process. Biodiesel is a
diesel replacement fuel for use in compression-ignition engines. It is manufactured from plant oils
(soybean oil, cotton seed oil, canola oil), recycled cooking greases or oils (e.g., yellow grease), or
animal fats (beef tallow, pork lard). The biodiesel manufacturing process converts oils and fats
2
Biodiesel typically has a higher cetane rating than petroleum diesel. Biodiesel also has better
lubricity than current low-sulphur petroleum diesel and much better lubricity than the
ultra-low-sulphur petroleum diesel. The energy content of biodiesel is roughly 10% lower than that of
petroleum diesel. Biodiesel dramatically reduces most emissions, including carbon dioxide. A
recent analysis of biodiesel emissions found a life-cycle greenhouse gas reduction of 41%
(Detchon, 2007).
In the transesterification reaction, triacylglycerol (TAG) is reacted with an alcohol (methanol,
ethanol), in the presence of a catalyst (base or acid) to produce glycerol and fatty acid alkyl esters.
The whole biodiesel production is summarized by this reaction and hence various reaction
parameters are monitored to ensure that maximum yield (and/or conversion) and purity is
achieved. These include;
The alcohol to oil molar ratio
Reaction temperature
Catalyst concentration
Reaction time
Various experiments have been conducted that propose the optimum values for the parameters
stated above. These parameters (60°C reaction temperature and 6:1 methanol: oil molar ratio,
1wt% catalyst) have become a standard for methanol-based transesterification (Knothe, et al.,
2005). Some reports also state that the transesterification reaction is more dependent on the alcohol
to oil ratio, catalyst concentration and reaction time than on temperature(Joshi et al., 2009;
3
Several researches have focussed on determining what yields of biodiesel can be obtained for a
particular feedstock. Though this is necessary, it is equally important that the process be optimised
and cost reduced to the minimum so as to make biodiesel competitive to petrodiesel. This research
further sought to use statistical methods to determine the optimum parameters for the production
of biodiesel. The transesterification stage was studied with no emphasis on a particular feedstock.
Canola oil was used as feedstock for this particular research because it has been studied extensively
in North America and has its properties are well known. The idea was to use Canola oil to obtain
a model equation that could be used to predict the effect of the factors on yield of biodiesel for any
feedstock. The use of statistical methods greatly reduced the time spent on experiments as a few
experiments were used to arrive at a meaningful conclusion, thereby reducing the cost of
production. Also, the designed experiments helped reduce the variations that could have been
obtained in the results. Potassium carbonate was used as the catalyst because of its cost and
efficiency and methanol, as alcohol.
The specific objectives were;
To determine the factors that affect the yield of biodiesel the most.
Determine the maximum amount of free fatty acid (FFA) that could be tolerated for Canola
oil. This was done by intentionally adding FFA to the canola oil.
Optimise the biodiesel production process using Potassium Carbonate as catalyst
Analyse effect of reaction parameters on above process (temperature, catalyst amount and
methanol-oil molar ratio, reaction time and speed of stirring)
4
Baroi et al., (2009) studied the production of biodiesel from Jatropha curcas using Potassium
carbonate. They reported that a 6wt% potassium carbonate (wt. % of the oil) was the optimum
catalyst amount when 6:1 methanol oil ratio was used at a temperature of 60°C for 10 hours
reaction time. They recommended that further research be done using the best parameter
combination, to obtain a shorter time as required for commercial operation. The proposed methods
are the;
Factorial design of experiments
Response surface methodology
The optimisation is done to find the best combination of factors at the least cost as possible. The
research method is selected to include the optimisation of the amount of FFA in the oil sample
also. Linoleic acid is used as the FFA.
Summarised below are the experimental plan and procedure.
Experimental Plan
Performed a fractional factorial experiment (Plackett-Burman design) with an initial twelve
runs (3 replicates, 36 in total) using various reaction parameters for potassium carbonate.
Determined which factors influence the yield the most using the Pareto plot.
Determined how much the amount of FFA and the other factors affect the yield of biodiesel
Determined the maximum amount of FFA that can be tolerated without affecting the yield
5
Experimental procedure
A fractional factorial experiment was run. 12 runs for a start to determine which factors
were more important.
Yields were measured for each run of the experiment.
Several experiments were run at the center and axial points to account for curvature
Surface response design was used to determine optimum conditions.
6
Chapter 2
2
Literature review
Biofuels are an alternative to the sole dependence on oil. They present another source to rely on if
there should be a break in the supply of oil and also relieve the stress on oil consumption.
Biofuels are classified as first-generation or second-generation fuels. There are no strict technical
definitions for these terms. The main distinction between them is the feedstock used. A
first-generation fuel is generally one made from sugars, grains, or seeds, i.e. one that uses only a specific
(often edible) portion of the above ground biomass produced by a plant, and relatively simple
processing is required to produce a finished fuel. First-generation fuels are already being produced
in significant commercial quantities in a number of countries. Second-generation fuels are
generally those made from non-edible lignocellulosic biomass, either non-edible residues of food
crop production (e.g. corn stalks or rice husks) or non-edible whole plant biomass (e.g. grasses or
trees grown specifically for energy). Second-generation fuels are not yet being produced
commercially in any country. (Lawson, 2008)
Edible oils are in use in developed nations such as USA and European nations but developing
countries are not self-sufficient in the production of edible oils and hence have emphasized in the
application of a number of the non-edible oils (Sharma, et al., 2008). It is imperative to develop
feedstocks that will replace the use of foods to produce fuels. While the use of food for fuel can
but replace a small proportion of the fossil/mineral fuel used, and thus cannot have a major effect
7
generation seem promising and is a venture worth pursuing, especially with their ability to be
blended and used without engine modification (Festel, 2008).
A sustainable biofuel has two favourable properties which are its availability from renewable raw
materials, and its lower negative environmental impact than that of fossil fuels (Demirbas, 2006 ).
Only second generation and beyond biofuels will make a real dent in the amount of fossil
petroleum used. The biofuel crops will only be cost effective in the long run if they are altered
genetically to remove toxins and environmental contaminants, and to be more productive and have
the right properties as fuels, as well as have residues that have value (Gressel, 2008).
Biodiesel can be produced from a great variety of feedstock. These feedstock include most
common vegetable oils (e.g., soybean, cottonseed, palm, peanut, rapeseed/canola, sunflower,
safflower, coconut) and animal fats (usually tallow) as well as waste oils (e.g., used frying oils).
The choice of feedstock depends largely on geography. (Knothe, et al., 2005). Biodiesel production
from algae is another promising area that is been explored by many scientists the world over.
Various experiments have been conducted that show the prospects of some of the proposed
feedstock for biodiesel. Chhetri et al. (2008) reports over 97% conversion to biodiesel for Jatropha
oil and Soap-nut oil. Over 90% conversion is also reported by Sharma et al. (2008) for neat canola
oil, used frying oil, soybean oil and waste cooking oil.
U.S. biodiesel production is growing rapidly, from 28 million gallons in 2004 to 91 million gallons
in 2005. That is still only 0.15% of the U.S. diesel market and less than 10% of the 1 billion gallons
produced in Europe, but production in 2006 was estimated at 245 billion gallons (Detchon, 2007).
Even though biodiesel can be made from a range of feedstock, the use of these feedstock is
influenced by the price and availability of the feedstock. A report on biodiesel production in
8
soybean oil are apt to be relatively high cost feedstock for biodiesel production while yellow
grease, tallow and palm oil are low-cost. This is attributed to the fact that canola ad soybean are
priced as food oils on the international markets while yellow grease, tallow and palm oil as classed
as feed and industrial oils. The price of palm oil has fallen drastically since there is rapid and
significant increase in production rate (Stiefelmeyer, et al., 2006).
The oil as it is from these feedstock has a high kinematic viscosity and hence cannot be used
directly in an engine. The kinematic viscosity of vegetable oils is about an order of magnitude
greater than that of conventional, petroleum-derived diesel fuel. High viscosity causes poor
atomization of the fuel in the engine’s combustion chambers and ultimately results in operational
problems, such as engine deposits (Knothe, et al., 2005). Two very common engines types are the
spark-ignited (gasoline) engine and the diesel engine. The spark-ignited engine usually runs on
gasoline while the diesel engine runs on diesel. These engines are both internal combustion engines
that convert fuel into energy through a series of small explosions or combustions. The major
difference between diesel and gasoline is the way these explosions happen. In a gasoline engine,
fuel is mixed with air, compressed by pistons and ignited by sparks from spark plugs. The fuel and
air are close to the chemically correct, or stoichiometric, mixture are inducted into the engine
cylinder, compressed, and then ignited by a spark. The power of the engine is controlled by limiting
the quantity of fuel-air mixture that enters the cylinder using a flow-restricting valve called a
throttle (Knothe et. al., 2005; Brain, 2011). In a diesel engine, also known as a compression-ignited
engine, only air enters the cylinder through the intake system. This air is compressed to a high
temperature and pressure, and then finely atomized fuel is sprayed into the air at high velocity.
When it contacts the high temperature air, the fuel vaporizes quickly, mixes with the air, and
9
Simply, in a diesel engine, the air is compressed first, and then the fuel is injected. Because air
heats up when it's compressed, the fuel ignites (Knothe et. al., 2005; Brain, 2011).
The performance of biodiesel in diesel engines have been documented and compared to that of
petroleum diesel. Summarized below are some of these findings, as mentioned in (Ciolkosz &
Perez, 2009).
Engine power: engine power and torque tend to be 3 to 5 percent lower when using
biodiesel. This is due to the fact that biodiesel fuel has less energy per unit volume than
traditional diesel fuel
Fuel efficiency: fuel efficiency tends to be slightly lower when using biodiesel due to the
lower energy content of the fuel. Typically, the drop-off is in the same range as the
reduction in peak engine power (3–5%)
Engine wear: short-term engine wear when using biodiesel has been measured to be less
than that of petroleum diesel. While long-term tests have not been published, engines are
expected to experience less wear in the long run when using biodiesel
Deposits and clogging: deposits and clogging due to biodiesel have been widely reported
but are generally traceable to biodiesel that is either of low quality or has become oxidized.
If fuel quality is high, deposits in the engine should not normally be a problem
Pollution from engine exhaust: biodiesel results in much less air pollution due to its higher
oxygen content and lack of both “aromatic compounds” and sulphur. The one exception to
this is nitrogen oxide (NOx) emissions, which tend to be slightly higher when using
biodiesel. Proper tuning of the engine can minimize this problem, however.
Cold-weather performance: similar to petroleum diesel, engines tested in cold weather
10
the filters and/or coking of the injectors. The use of flow-improving additives and “winter
blends” of biodiesel and kerosene has proved effective at extending the range of operating
temperatures for biodiesel fuel. Pure biodiesel tends to operate well at temperatures down
to about 5°C (this varies noticeably depending on the type of oil used). Additives typically
reduce that range by about 5 to 8 degrees, while winter blends have proved effective at
temperatures as low as -20°C and below.
Similar findings on the comparison in performance of biodiesel and petrol diesel are published in
(Knothe et. al., 2005).
Depending on the conversion of biomass, three main pathways come into consideration (Zinoviev
et. al., 2007);
the thermo-chemical pathway (Pyrolysis)
the physical-chemical conversion pathway (Transesterification)
The bio-chemical conversion pathway (Fermentation)
Of all these pathways, four methods to reduce the high viscosity of vegetable oils to enable their
use in common diesel engines without operational problems such as engine deposits have been
investigated: blending with petrodiesel, pyrolysis, micro-emulsification (co-solvent blending), and
transesterification (Knothe et. al., 2005).
Blending with petrodiesel
Various mixtures of vegetable oils and petrodiesel have been tried and experimented on to see
their performance in diesel engines. When vegetable oil is used as diesel fuel, its advantages
include;
Liquid nature portability
11
Readily available
Renewability
It should however be realised that vegetable oils have a higher viscosity, lower volatility, and have
very reactive unsaturated hydrocarbon chains (Ma & Hanna, 1999; Knothe, Gerpen et. al., 2005).
Most studies have concluded that vegetable oil/petrodiesel blends are not suitable for long-term
fueling of direct injection diesel engines. The problems include (Ma & Hanna, 1999) ;
Coking and trumpet formation on the injectors to such an extent that fuel atomization does
not occur properly or is even prevented as a result of plugged orifices
Carbon deposits
Oil ring sticking
Thickening and gelling of the lubricating oil as a result of contamination by the vegetable
oils.
Micro-emulsification
When diesel is mixed with low molecular weight alcohols, the hybrid diesel fuels formed have a
lower viscosity than the parent diesel.
Microemulsions are clear, stable, two-phase nano-dispersions which readily form upon mixing
water with an oil phase. Water-in-oil (w/o) microemulsions are comprised of a continuous
non-polar hydrocarbon phase and a discontinuous aqueous phase. Because of the small droplet size (2
to 200 nanometers) of the discontinuous phase, these microemulsions appear to be clear, one-phase
systems. Microemulsion diesel fuel technology uses a microemulsifier to make a diesel or
biodiesel fuel and a water phase compatible. The microemulsifier typically contains a surfactant
12
is “clean-burning”, gives no power loss or increase in fuel consumption, and is thermal and shear
stable in the fuel handling system.
The purpose of the oxygenate is to help solubilize the surfactant in the fuel, adjust the properties
(i.e. viscosity) of the fuel, and possibly contribute to improving the ignition properties of the
water-containing microemulsion fuel (Kesling, et al., 2006).
Micro-emulsion fuels present an opportunity to replace up to 50% of the petroleum in diesel fuels
with biomass and by-product materials, including alcohols, vegetable oil fatty acids, and aromatic
alcohols. The technology is expected to be driven by lowered NOx and particulate emissions,
although petroleum sparing and energy security are major energy related objectives. Major factors
in the adoption of this and other market fuel technologies include cetane rating, emissions
decreases, and appropriate physical chemical properties, e.g. cloud point, vaporization (Griffith &
Compere, 2003). Boruff et. al. (1982) also documented similar findings in their evaluation of diesel
fuel-ethanol microemulsions.
Pyrolysis
Pyrolysis refers to the thermochemical conversion of biomass into energy. Usually, the biomass is
heated in the absence of air (oxygen) to achieve decomposition. The application of heat to biomass
will yield pyrolytic products with gaseous, liquid, and solid fractions, the proportions of which are
heavily dependent on the pyrolysis conditions. The liquid or oil fraction is commonly called
pyrolytic oil or bio-oil. Slow pyrolysis, which employs lower process temperatures and longer
reaction times, favors charcoal production. The liquid pyrolytic product can be easily stored and
transported, readily upgraded and refined to produce high quality fuels, and may contain chemicals
13
The crude pyrolysis liquid or bio-oil, is dark brown in color, approximates to biomass in elemental
composition and is a complex mixture of oxygenated hydrocarbons and an appreciable amount of
water.
One of the main drawbacks of the bio-oil is that the composition of the pyrolytic oils is very similar
to that of the original biomass and is very different from petroleum derived fuels and chemicals.
The primary disadvantages of using the bio-oil as a diesel fuel most notably include the low HHV
(Higher heating value) which is approximately 40% less than that of fuel oil, its high viscosity,
and substantial solids content. As well, bio-oil typically contains up to 25 wt. % water that cannot
be readily separated. This causes miscibility problems with conventional fuel oils and as a result,
blends cannot be achieved. Pyrolysis oils have also been described as acidic, corrosive, polar,
thermally unstable, and highly oxygenated (Knothe, Gerpen, & Krahl, 2005; Maher & Bressler,
2007). It should also be noted that, these disadvantages aside, pyrolysis has a lower operational
cost and feedstock for pyrolysis are readily available.
Transesterification
Transesterification is the most used method of conversion and refers to the reaction of a vegetable
oil or animal fat with an alcohol in the presence of a catalyst to produce alkyl esters and glycerol.
The alkyl esters are what are called biodiesel.
The purpose of the transesterification process is to lower the viscosity of the oil. The
transesterification reaction proceeds well in the presence of some homogeneous catalysts such as
potassium hydroxide (KOH)/ sodium hydroxide (NaOH) and sulfuric acid, or heterogeneous
catalysts such as metal oxides or carbonates.
Transesterification is the general term used to describe he important class of organic reactions
14
original ester is reacted with an alcohol, the transesterification process is called alcoholysis. The
term transesterification is synonymous to alcoholysis of carboxylic esters. The transesterification
is an equilibrium reaction and the transformation occurs essentially by mixing the reactants.
However, the presence of a catalyst (typically a strong acid or base) accelerates considerably the
adjustment of the equilibrium. In order to achieve a high ester yield, alcohol has to be used in
excess. In the transesterification of vegetable oils, a triglyceride reacts with an alcohol in the
presence of a strong acid or base, producing a mixture of fatty acids alkyl esters and glycerol. The
overall process is a sequence of three consecutive and reversible reactions, in which di- and
mono-glycerides are formed as intermediates. The stoichiometric reaction requires one (1) mole of a
triglyceride and three (3) moles of the alcohol. However, an excess of the alcohol is used to
increase the yields of the alkyl esters and to allow its phase separation from the glycerol formed.
Several factors, including the type of catalyst (alkaline or acid), alcohol-oil molar ratio,
temperature, purity of the reactants (mainly water content) and free fatty acid content affect the
transesterification process. The types of catalysts often used are discussed below.
2.4.1 Acid-Catalyzed Processes
The transesterification process is catalyzed by Bronsted acids, preferably by sulphonic and
sulphuric acids. These catalysts give very high yields in alkyl esters, but the reactions are slow,
requiring, typically, temperatures above 100 °C and more than 3 hr to reach complete conversion.
Pryde et al. (1983) showed that the methanolysis of soybean oil, in the presence of 1 mol% of
H2SO4, with an alcohol/oil molar ratio of 30:1 at 65 °C, takes 50 h to reach complete conversion
of the vegetable oil (> 99%), while the butanolysis (at 117 °C) and ethanolysis (at 78 °C), using
15
The alcohol/vegetable oil molar ratio is one of the main factors that influence the
transesterification. An excess of the alcohol favours the formation of the products. On the other
hand, an excessive amount of alcohol makes the recovery of the glycerol difficult, so that the ideal
alcohol/oil ratio has to be established empirically, considering each individual process.
The mechanism of the acid-catalyzed transesterification of vegetable oils is shown below for a
monoglyceride. However, it can be extended to di- and triglycerides (Schuchardi et al., 1998).
Scheme 1: Mechanism of Acid catalyzed transesterification of Vegetable Oil (Schuchardi et.
al, 1998)
The protonation of the carbonyl group of the ester leads to the carbocation II which, after a
nucleophilic attack of the alcohol, produces the tetrahedral intermediate III, which eliminates
glycerol to form the new ester IV, and to regenerate the catalyst H+.
According to this mechanism, carboxylic acids can be formed by reaction of the carbocation II
16
should be carried out in the absence of water, in order to avoid the competitive formation of
carboxylic acids which reduce the yields of alkyl esters.
2.4.2 Base-Catalyzed Processes
The base-catalyzed transesterification of vegetable oils proceeds faster than the acid-catalyzed
reactions. Due to this reason, together with the fact that the alkaline catalysts are less corrosive
than acidic compounds, industrial processes usually favour base catalysts, such as alkaline metal
alkoxides and hydroxides as well as sodium or potassium carbonates.
The mechanism of the base-catalyzed transesterification of vegetable oils is as shown.
Scheme 2: Mechanism of base catalyzed transesterification of vegetable oil (Schuchardi et al., 1998)
The first step is the reaction of the base with the alcohol, producing an alkoxide and the protonated
17
a tetrahedral intermediate from which the alkyl ester and the corresponding anion of the diglyceride
are formed; the latter deprotonates the catalyst, thus regenerating the active species which is now
able to react with a second molecule of the alcohol, starting another catalytic cycle.Diglycerides
and monoglycerides are converted by the same mechanism to a mixture of alkyl esters and
glycerol.
Alkaline metal alkoxides (as CH3ONa for the methanolysis) are the most active catalysts, since
they give very high yields (> 98%) in short reaction times (30 min) even if they are applied at low
molar concentrations (0.5 mol%). However, they require the absence of water which makes them
inappropriate for typical industrial processes. Alkaline metal hydroxides (KOH and NaOH) are
cheaper than metal alkoxides, but less active. Nevertheless, they are a good alternative since they
can give the same high conversions of vegetable oils just by increasing the catalyst concentration
to 1 or 2 mol%. However, even if a water-free alcohol/oil mixture is used, some water is produced
in the system by the reaction of the hydroxide with the alcohol. The presence of water gives rise
to hydrolysis of some of the produced ester, with consequent soap formation. This undesirable
saponification reaction reduces the ester yields and considerably makes difficult the recovery of
the glycerol due to the formation of emulsions (Schuchardi et al., 1998).
18
Potassium carbonate, used in a concentration of 2 or 3 mol% gives high yields of fatty acid alkyl
esters and reduces the soap formation. This can be explained by the formation of bicarbonate
instead of water, which does not hydrolyse the esters (R = the alkyl group of the alcohol).
Scheme 4: reaction for bicarbonate formation
2.4.3 Choice of Catalyst (K2CO3)
Hartman (2012), compares the efficiency of several catalysts. This comparison was based on the
amount of glycerol set free and the degree of soap formation. He mentioned that sodium methoxide
ensured a practically complete alcoholysis, but since it is known to promote migration of double
bonds and other secondary reactions, its use is not always advisable. Potassium carbonate was
found to produce comparable efficiencies to sodium methoxide.
Aside being available commercially for a relatively cheap price, potassium carbonate can also be
produced simply and inexpensively by burning organic materials (which mostly contain Carbon
and potassium) and using the ash that is produced. This can also be undertaken through a refining
process to obtain the white crystalline potassium carbonate. This makes potassium carbonate a
viable and more favourable catalyst especially for regions where cost is a major concern.
Design of experiment
Montgomery (2003), mentions that by designed experiments, engineers can determine which
subset of the process variables has the greatest influence on process performance. The results of
such an experiment can lead to
19
2. Reduced variability in the process and closer conformance to nominal or target
requirements
3. Reduced design and development time
4. Reduced cost of operation.
Several approaches can be considered in running an experiment. There is the best-guess approach
which is based on the selection of arbitrary combinations of factors and then running tests with
them. The response for this combination is measured. This approach can be repeated indefinitely,
switching the levels of one (or two) factors for the next test based on the outcome of the previous
test. This method is however flawed, in that, for a case where the initial best guess does not produce
the desired results, the experiment would have to be repeated with a new guess at the correct
combination. This could be time consuming is the correct combination is not found. Also, if the
initial guess produces an acceptable result, this could lead the experimenter into thinking that the
best solution has been found; which could be wrong.
The one-factor-at-a-time approach is also used extensively. This method consists of selecting a
starting point or baseline set of levels, for each factor, then successively varying each factor over
its range with the other factors held constant at the baseline level. A major disadvantage of this
approach is that it fails to consider any possible interactions between the factors. Dunn (2012)
explains that changing one variable at a time, leads into thinking an optimum has been reached,
when all that has been done is found a sub-optimal solution.
A factorial experiment is recommended. This is an experimental strategy in which factors are
varied together, instead of one at a time. In this method, two levels of the factors are considered
20
helps the experimenter to investigate the individual effects of each factor (or the main effects) and
to determine whether the factors interact.
Response surface methods usually accompany factorial designs. These are a collection of
mathematical and statistical techniques that are useful for modeling and analysis in applications
where a response of interest is influenced by several variables and the objective is to optimise this
response. The response surface of the response variable is mapped out and the process is moved
as close to the optimum as possible, taking into account all constraints.
Several experiments have been performed and reports written on the use of factorial and surface
designs for the optimisation of biodiesel.
Vicente et. al (1998), investigated the application of these methods to the optimisation of biodiesel.
They experimented using Sunflower Oil and methanol. Stirring was fixed at 600 rpm, time at 4
minutes, methanol-oil ratio fixed at 6:1 at atmospheric pressure. The factors investigated were
temperature and catalyst concentration. They found that the conversion of trans-glycerides was
strongly dependent on these two factors with the conversion increasing at low temperatures and
high catalyst concentrations. They further noted that the conversion decreased at very high
temperature and pressures. This they explained to be a result of an increase in side reactions at
these elevated conditions. Similar results were obtained by Joshi et. al (2008), when they
investigated how the catalyst (KOH) concentration affects, ethanol oil ratio and temperature affects
the yield of biodiesel. In their report, catalyst and Ethanol-Oil molar ratio were found to be the
main factors that affect the yield using the response surface design.
Research shows that plant oils or greases used in CI engines at concentrations as low as 10% to
21
problems and can reduce engine life. These problems are caused mostly by the greater viscosity,
or thickness, of the raw oils (around 40mm2/s) compared with that of the diesel fuel, for which the
engines and injectors were designed (1.3 to 4.1mm2/s). Through the process of converting plant
oils or greases to biodiesel by transesterification, the viscosity of the fuel is reduced to values
similar to conventional diesel fuel (biodiesel values are typically 4 to 5mm2/s) (NRE, 2009)
This report aims to use the factorial design and response surface designs to investigate the factors
that affect the production of biodiesel from “Canola Oil (with added FFA) using the novel catalyst
K2CO3”. A Plackett-Burman design is initially employed to determine which factors affect the
yield the most. Subsequent designs focus on determining the optimum conditions for producing
the biodiesel from this feedstock. Six factors are considered for the initial design and are listed
below;
1. FFA Content (A)
2. Methanol Oil Ratio (B)
3. Catalyst Amount (C)
4. Reaction Time (D)
5. Temperature (E)
6. Stirring Speed (F)
23
Chapter 3
3
Effect of process variables on transesterification: a
Plackett-Burman design application
Introduction
A sustainable biofuel has two favourable properties, namely, availability from renewable raw
materials, and lower negative environmental impact than that of fossil fuels (Demirbas, 2006 ).
Biodiesel can be produced from a great variety of feedstock. These feedstock include most
common vegetable oils (e.g., soybean, cottonseed, palm, peanut, rapeseed/canola, sunflower,
safflower, coconut) and animal fats (usually tallow) as well as waste oils (e.g., used frying oils).
The choice of feedstock depends largely on geography (Knothe, et al., 2005).
Various experiments have been conducted that show the potential of some of the proposed
feedstock for biodiesel production. Chhetri et al. (2008) reports over 97% conversion to biodiesel
for Jatropha oil and Soapnut oil. Over 90% conversion is also reported by Sharma, et al. (2008)
for neat canola oil, used frying oil, soybean oil and waste cooking oil.
Even though biodiesel can be made from a range of feedstock, their use is influenced by price and
availability. A report on biodiesel production in Canada has shown that the prices of a number of
feedstock have fallen drastically because there has been a rapid and significant increase in
production rate (Stiefelmeyer, et al., 2006).
U.S. biodiesel production is growing rapidly, from 28 million gallons in 2004 to 91 million gallons
24
produced in Europe, but production in 2006 was estimated at 245 billion gallons (Detchon, 2007).
It is thus necessary that cheaper, simpler and alternative methods be sought to increase production.
Depending on the conversion of biomass, the following three pathways may be considered
(Zinoviev, et al., 2007):
the thermo-chemical pathway (Pyrolysis)
the physico-chemical conversion pathway (Transesterification)
The bio-chemical conversion pathway (Fermentation)
In all these pathways, four methods to reduce the high viscosity of vegetable oils to enable their
use in common diesel engines without operational problems, such as engine deposits, have been
investigated: blending with petrodiesel, pyrolysis, micro-emulsification (co-solvent blending), and
transesterification (Fukuda, et al., 2001; Knothe, et al., 2005).
Over the years, extensive research has been conducted on these methods of biodiesel production.
Biodiesel production via transesterification remains one of the most widely used processes.
Transesterification is the reaction of a vegetable oil or animal fat with an alcohol in the presence
of a catalyst to produce alkyl esters and glycerol. The course of transesterification is influenced
very much by the type of catalysis used. The choice is often between a base and an acid catalyst.
Several factors influence the outcome of this stage of the biodiesel process. They include the
amount of free fatty acid, methanol-Oil ratio, amount of catalyst, reaction time, effect of stirring,
pressure and temperature (Freedman, et al., 1984). Eventhough the effects of these factors have
been documented (Feuge & Gros, 1949; Meher, et al., 2006; Freedman, et al., 1984), there has
been no attempt to quantitatively determine how each one of these factors affect the yield of
25
The experiment in the present research focusses on the transesterification stage of biodiesel
production and uses the Packett-Burman design to model the process. This design is a two-level
and 12-run experiment. The primary goal is to find a relationship between six of the factors listed
above (except pressure) and the yield of biodiesel produced. This design approach helps to
quantitatively determine how the investigated factors affect the yield of biodiesel in the ranges
chosen. A qualitative representative is given in the pareto plot. The experimenter seeks to use the
least expensive and most common materials in biodiesel production and hence reduce the cost of
production.
Montgomery (2003) has noted that, by using experimental design, engineers can determine which
subset of the process variables has the greatest influence on process performance. The results of
such experiments can lead to improved process yield, reduced variability in the process and closer
conformance to nominal or target requirements, reduced design, development time and cost of
operation.
Several approaches can be considered when running an experiment but the one that leads to the
most optimum result is always sought. Factorial experiments have been recommended and used
for several decades. They allow the experimenter to investigate the individual effects of each factor
(or the main effects) and to determine if the factors interact.
Complete runs are expensive, so screening methods are employed. Screening methods give the
least number of experiments that can provide substantial information. In these experiments, many
factors are considered and the objective is to identify those factors (if any) that have large effects.
The factors that are identified as more important are then investigated more thoroughly in
26
Thus screening methods help identify the “active factors”3 in an experiment. The most popular
screening methods used are the fractional factorial methods (2k-p designs) and the Plackett Burman
designs (Plackett & Burman, 1946). Where as fractional factorials restrict the number of runs to
be a power of 2, the Plackett-Burman designs allow the number of runs to be a power of 4. This
allows for a more economical screening. This method has been used extensively in the
determination and optimisation of active factors in the biological sciences (Giordaus et al., 2011),
with applications in the production of biodiesel from algae (Lu et al., 2011) amongst others but no
work has been done using it on the transesterification of biodiesel.
Canola oil is the chosen feedstock for this experiment. It is relatively inexpensive in North America
and its properties and characteristics are very well known (Przybylski, et al., 2005). It has also
been used in many experiments. The canola oil used in the present study had a high amount of
oleic acid and a 0.07% free fatty acid amount. Linoleic acid was intentionally added as a source of
free fatty acid to mimic real life situation.
Potassium carbonate, a base, was chosen as the catalyst. Base-catalysis was preferred because
transesterification of vegetable oils proceeds faster than the acid-catalyzed reactions and, also,
alkaline catalysts are less corrosive. Even though it is necessary that they are used in the absence
of water, alkaline metal alkoxides are the most active catalysts, since they give very high yields (>
98%) in short reaction times (30 min) even if they are applied at low molar concentrations (0.5
mol%). (Schuchardi et al., 1998). The potassium carbonate used is produced by a simple and
inexpensive process and it has efficiencies comparable to sodium methoxide (Hartman, 1956).
Methanol was used for alcoholysis.
27
Materials
Canola oil (certified organic) with FFA concentration of less than 0.10% was obtained from
Sigma-Aldrich in Oakville, Canada. Anhydrous potassium carbonate (min. 99 %) supplied by
Caledon labs was obtained from the chemical store. Anhydrous grade methanol (99.8%) and
technical grade linoleic acid (about 65%) were also purchased from Sigma-Aldrich in Oakville,
Canada. Analytical grade methyl nonadecanoate (≥98.0%) and toluene were purchased for the GC
analysis from Sigma Aldrich in Milwaukee, USA
Method
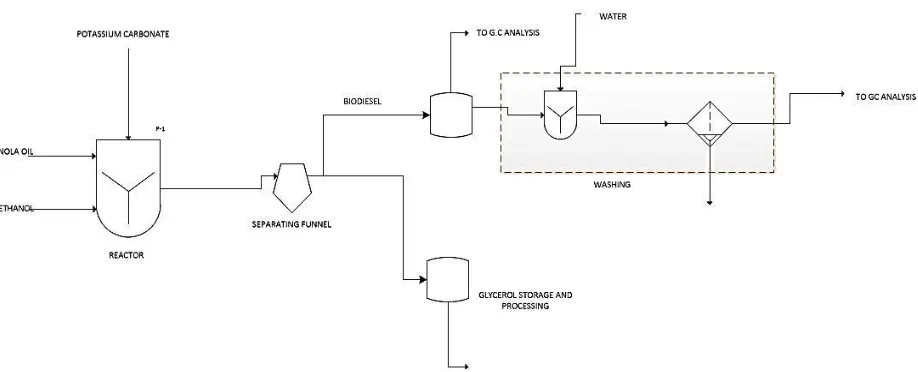
3.3.1 Experimental Set-Up
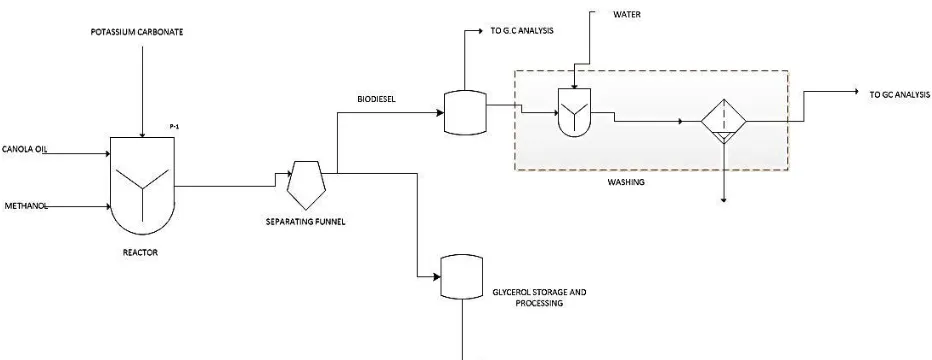
Figure 3-1: Process flow diagram; Transesterification stage
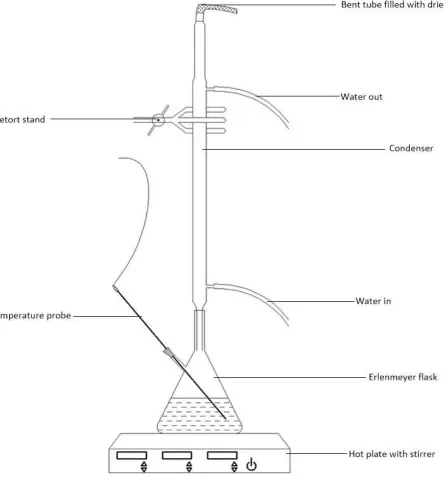
The reactor was a 250-mL Erlenmeyer flask. The opening was fitted with a 24/40 Liebig
condenser. To make the process water tight, the other opening of the condenser was fitted with a
bent tube which was filled with (drierite) calcium sulphate and cotton. These materials were chosen
28 Figure 3-2: Experimental set-up
This set up was mounted on a VWR 800 series advanced digital hot plate with stirrer. The hot plate
also comes equipped with a temperature probe to ensure efficient measuring of temperature. To
use the probe, an opening was made on the flask (reactor). This opening was made at a 60̊ angle
29
The septum prevents airflow into the system. The stirrer also had a stop watch that measured the
reaction time and automatically ended the reaction at the desired reaction time.
The reaction mixture was allowed to settle overnight by gravity in the separating funnel, and the
two resulting phases were decanted into separated bottles. The glycerol was stored, tested for free
fatty acids and later disposed of, while the fatty acid methyl esters (FAME) phase is taken for
further testing (washing and methyl ester determination in the GC).
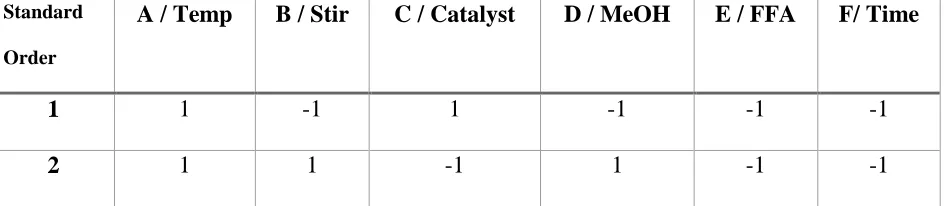
3.3.2 Experimental Design (Plackett-Burman Design)
Exactly 100 g of canola oil was measured out and poured into the reactor. The reaction parameters
were modified for each run from the design. The design is as shown in table 1 below.
The -1 (s) and 1 (s) are coded variables used to denote the high and low amounts of each variable.
The actual values are given in Table 2 below. The values used for each of the factors is based on
previous work done in the lab and from literature (Ma et. al. 1999; Feuge & Gros, 1949; Freedman
et al. 1984; Knothe et. al. 2005; Baroi et. al. 2009).
Three replicates of each run was done and the corresponding yield determined. The runs were also
randomised to remove any correlations that may be present.
Table 3-1: Plackett-Burman Design
Standard
Order
A / Temp B / Stir C / Catalyst D / MeOH E / FFA F/ Time
1 1 -1 1 -1 -1 -1
30
3 -1 1 1 -1 1 -1
4 1 -1 1 1 -1 1
5 1 1 -1 1 1 -1
6 1 1 1 -1 1 1
7 -1 1 1 1 -1 1
8 -1 -1 1 1 1 -1
9 -1 -1 -1 1 1 1
10 1 -1 -1 -1 1 1
11 -1 1 -1 -1 -1 1
12 -1 -1 -1 -1 -1 -1
The amounts to use for each run was calculated based on how the reaction proceeds. The reaction
may be represented as follows:
TAG + (x+y) MeOH = x FAME + GLYCEROL + y MeOH
Table 3-2: factor notations and amounts
NOTATION FACTORS LOW HIGH
A Temperature (°C) 30 60
31
C Catalyst Amount (wt % oil) 1 4
D MeOH-Oil Ratio 3:1 6:1
E FFA amount (wt % oil) 0.5 6
F Reaction Time (hr) 1 3
Applying the equation above, the factor values shown in Table 3 were obtained.
The molecular weights of Canola oil, and methanol used in the calculations were calculated as
883.370 g/mol, 0.340 g/mol respectively.
Table 3-3: factor calculations
FACTOR AMOUNT CALCULATED AMOUNT
Methanol
3:1 10.88 g
6:1 21.76 g
Catalyst
1 wt % 1.00 g
4 wt % 4.00 g
FFA
0.5 wt % 0.50 g
6 wt % 6.00 g
The procedure followed is as outlined in Figure 1.
At the end of each run, the mixture was transferred into a separating funnel and then left to settle
32 3.3.3 Gas Chromatography Analysis
Yield was determined using gas chromatography. The approach taken is as outlined in EN 14103
(Determination of total FAME in B100 biodiesel).
Exactly 100 mg of each sample was measured using a high precision balance and placed in a 12
mL vial. This was followed by the addition of 100 mg of internal standard (C19) to each sample.
The masses in each case were recorded to the nearest 0.1 mg. The sample and standard were then
dissolved in 10 mL of toluene. The resulting mixture was allowed to settle; it was then mixed
thoroughly for 15 minutes after which three samples were drawn from each vial for GC analysis.
The GC was fitted with a Carbowax™ column.
The yield of FAME was computed as:
C = Ʃ𝑨−𝑨𝑰𝑺
𝑨𝑰𝑺 𝒙
𝑪𝑰𝑺𝒙𝑽𝑰𝑺
𝒎 𝒙𝟏𝟎𝟎 % ... Equation
3-1
Where ƩA: total peak area from C14 to C24
AIS : Internal standard peak area
CIS: Concentration of internal standard in mg/mL
VIS: Volume of internal standard in mL
m: mass of sample in mg
Prior to this step, a FAME mixture (C8-C24) obtained from Agilent Canada was run and the
resulting retention times were used to aid identification.
Results and Discussion
33
1. A model was fitted to the data by inputting the yields for each run. The effects (contrasts)
and corresponding sum of squares were calculated by the software. The total degrees of
freedom and the T and P values for each factor were computed and displayed in the output
results.
2. The active (important) effects were identified using an α = 0.05 (level of significance). The
P-values in the estimated effects and coefficients table were used to determine which
effects were significant. All factors with P-values less than 0.05 were considered
significant.
3. Effects plots (normal probability plots and a Pareto chart) were also generated and are
interpreted as follows: the two charts are evaluated to see which factors influence the yield.
On the Pareto chart, any effect that goes beyond the reference line is significant at the
chosen level of significance (α=0.05). A reference value and subsequently, a reference line,
was found at the T-value at α=0.05 and the degrees of freedom of the experiment. The
normal probability plot was used to check for normality (assumption of zero mean and
constant variance). Normality is required in order to apply the hypothesis tests.
4. Minitab outputs the errors in the coefficients as SE coeff. These give the variances of the
coefficients. The error sum of squares (SSE) gives the error of the equation between the
best fit and the actual points. It is shown in the results as SS (residual error). SSE is related
to variance by the degree of freedom (n-p). Variance is shown as MS (residual error). To
test the hypothesis (t-tests) about the slope and intercepts of the regression model, it was
assumed that the errors are normally distributed and independently distributed with mean
zero and variances σ2. T and P give the T test statistic of the coefficients and the P values
34
the degrees of freedom to determine if the coefficient is significant (test for significance of
regression).
5. The adequacy of the model is determined using the coefficient of determination (R2).
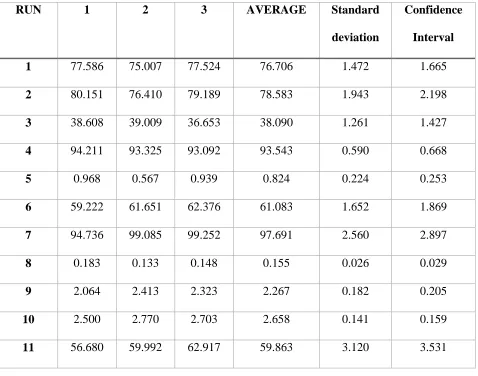
Results
The results (in % yield) for the Plackett-Burman design are presented below in Table 4. Six (6)
factors were considered for a base run of 12 (36 runs in total, 3 replicates). The standard deviations
and confidence intervals are also calculated for each run. The run sequence and factor distributions
are as presented in Table 1.
Table 3-4: Results (% yield) from the screening experiment
RUN 1 2 3 AVERAGE Standard
deviation
Confidence
Interval
1 77.586 75.007 77.524 76.706 1.472 1.665
2 80.151 76.410 79.189 78.583 1.943 2.198
3 38.608 39.009 36.653 38.090 1.261 1.427
4 94.211 93.325 93.092 93.543 0.590 0.668
5 0.968 0.567 0.939 0.824 0.224 0.253
6 59.222 61.651 62.376 61.083 1.652 1.869
7 94.736 99.085 99.252 97.691 2.560 2.897
8 0.183 0.133 0.148 0.155 0.026 0.029
9 2.064 2.413 2.323 2.267 0.182 0.205
10 2.500 2.770 2.703 2.658 0.141 0.159
35
12 59.835 60.105 62.660 60.866 1.559 1.764
The results as obtained from Minitab are presented in Table 5 below.
The coefficient of determination values are also calculated to be R2 = 93.70%, R2 (predicted) as
90.30% and R2 (adjusted) as 92.40%.
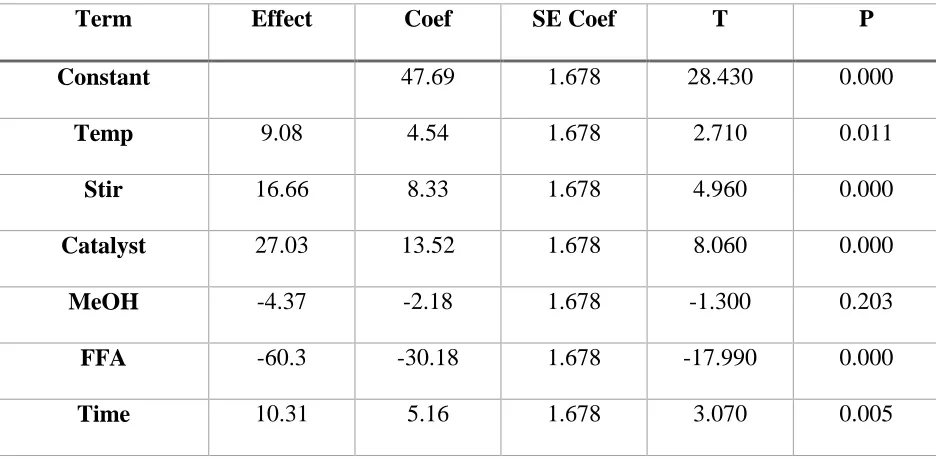
Table 3-5: Estimated Effects and coefficients for Yield
The Analysis of Variance (ANOVA) table is also presented below;
Table 3-6: Analysis of Variance for YIELD
Term Effect Coef SE Coef T P
Constant 47.69 1.678 28.430 0.000
Temp 9.08 4.54 1.678 2.710 0.011
Stir 16.66 8.33 1.678 4.960 0.000
Catalyst 27.03 13.52 1.678 8.060 0.000
MeOH -4.37 -2.18 1.678 -1.300 0.203
FFA -60.3 -30.18 1.678 -17.990 0.000
36
Source DF Seq SS Adj SS Adj MS F P
Main Effects 6 43737.8 43737.8 7289.6 71.93 0
Temp 1 741.6 741.6 741.6 7.32 0.011
Stir 1 2497 2497 2497 24.64 0
Catalyst 1 6577.7 6577.7 6577.7 64.9 0
MeOH 1 171.7 171.7 171.7 1.69 0.203
FFA 1 32792.6 32792.6 32792.6 323.57 0
Time 1 957.3 957.3 957.3 9.45 0.005
Residual Error 29 2939 2939 101.3
Lack of fit 5 2880.1 2880.1 576 234.86 0
Pure Error 24 58.9 58.9 2.5
Total 35 46676.9 46676.9
Analysis
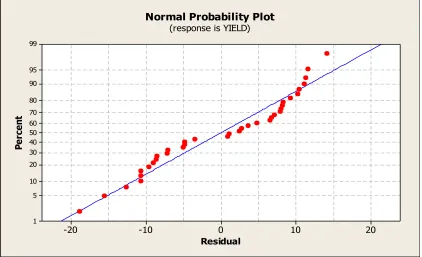
The assumption of normality was checked with the residual plots generated in Minitab. Normality
requires that the data has zero mean and constant variance. This is necessary in order to apply the
hypothesis tests. It is seen from Figure 3-3 that the data meets this assumption. The only outlier in
37 20 10 0 -10 -20 99 95 90 80 70 60 50 40 30 20 10 5 1 Residual Pe rc en t
Normal Probability Plot
(response is YIELD)
Figure 3-3: Normal Probability Plot for the Yield
The model equation obtained for the experiment is
𝒀 = 𝟒𝟕. 𝟔𝟗 − 𝟑𝟎. 𝟏𝟖𝑭𝑭𝑨 + 𝟏𝟑. 𝟓𝟐𝑪𝑨𝑻𝑨𝑳𝒀𝑺𝑻 + 𝟖. 𝟑𝟑𝑺𝑻𝑰𝑹 + 𝟓. 𝟏𝟔𝑻𝑰𝑴𝑬 + 𝟒. 𝟓𝟒𝑻𝑬𝑴𝑷 − 𝟐. 𝟏𝟖𝑴𝒆𝑶𝑯 …Equation 3-2
Turck (2003) notes that increased FFAs react with the basic catalyst added for transesterification
resulting in the formation of soap. As a consequence, one part of the catalyst is neutralised and is
therefore not available for the transesterification reaction.
This clearly explains the very high negative effect of the FFA amounts on the yield of biodiesel.
As the FFA amount is increased from 0.5 wt% to 6 wt % of the oil, there is increase in the
saponification side reaction. The potassium carbonate reacts with the FFA to form soaps. This
accounts for the drops in yield for reactions with high FFA amounts.
The catalyst amount is the second most important factor. The results show that increasing the
catalyst amount from 1 wt% to 4 wt% oil greatly affects the yield of biodiesel. The importance of
38
al., 1984). Base catalysis is particularly favoured and the results obtained truly reflect the
importance of catalysis. Hartman (1956), compares the efficiency of several catalysts. This
comparison was based on the amount of glycerol set free and the degree of soap formation. He
mentioned that sodium methoxide and potassium carbonate set free 99-99.5% of the total glycerol
and caused the least degree of saponification.
Potassium carbonate is not soluble in methanol (not at the temperatures studied). Stirring is
employed to promote homogenisation of the reactants. Stirring facilitates the initiation of the
reaction since it increases the reaction area between the oil and the catalyst-alcohol phase. Without
stirring, the reaction would only occur at the interface of the different phases that may be present.
This would make the transesterification process very slow and unfeasible. Ma, et al. (1999) note
that the effect of stirring speed and time is only pronounced in the first 10 minutes. After a
homogenous mixture is obtained, mixing does not affect the process that much. This could explain
why increasing the rate of stirring from 400 rpm to 800 rpm does not affect the yield as much as
the FFA and catalyst amounts do, even though stirring is very necessary to start the reaction. The
importance of stirring is documented in Ma, et al. (1999) and Peterson et al. (1992).
Freedman, et al. (1984) studied the effect of methanol-oil molar ratio on yield from 1:1 to 6:1
molar ratios. It was found that the maximum conversion (98%) was obtained at 6:1 molar ratio,
while 82% conversion was obtained at 3:1.. The amount of intermediates decreased as the molar
ratios increased, indicating that conversion was complete. The methanol-oil ratio insignificance
obtained in the present study suggests that the ratios investigated (3:1 and 6:1), exceeded the
threshold requirement such that increasing the methanol-oil ratio did not have any effect on the
yield.
It is only logical to assume that as the temperature increases, the rate of alcoholysis increases.
Feuge and Gros (1949) and Freedman, et al. (1984) both studied the effect of temperature on the
reaction yield. It was found that the initial stages of the reaction (0.1 hr) is highly affected by
temperature but after 1 hr of reaction, the ester formation was identical for 60˚C and 45˚C and only slighly lower for 32˚C. This explains the low effect of temperature on the yield in changing it from 30˚C to 60˚C. The initial reaction rate is high for 60˚C but as the reaction approaches the hour
mark, the yields obtained are not so different. Time and temperature have a strong relationship.
39
& Gros, 1949). This explains why increasing the time of reaction from 1 to 3 hours has very little
effect on the yield. The reaction nears completion in the first hour. After that, it proceeds slowly.
The Pareto chart below gives a graphical representation of the effects of the factors on the yield.
It is also used to determine the active factors at the chosen 0.05 level of significance.
Figure 3-4: Pareto chart of Effects
At the chosen level of significance (α = 0.05) all the factors were found to be significant except
the Methanol-Oil ratio. This means that changing the methanol-oil ratio from the low to high
intervals used (3:1 to 6:1) did not affect the yield of biodiesel produced. It is realised above that
FFA had the most significant effect.
The model obtained accounts for 93.70% of the total variability in the data as given by the R2
value.
MeOH TEMP TIME STIR CATALYT FFA
20 15
10 5
0
Te
rm
Standardized Effect
2.05
Pareto Chart of the Standardized Effects
40
Conclusion
The Plackett-Burman methods is an effective screening method. The effects of each factor on the
yield has been measured without having to do a full factorial design. The Pareto plot also affords
a good way to tell which factors are active and need further consideration.
The amount of free fatty acid has the most negative effect on the yield of biodiesel. It is advised
that where possible, the amount of FFA be reduced further before proceeding with base catalysis.
Potassium carbonate is a very effective catalyst. Very high yields of biodiesel were obtained in an
hour or so of reaction. It should however be mentioned that even though increasing the amount of
catalyst increased the rate of the reaction and consequently the yield, a point is reached where there
is an increase in the FFA catalyst side reaction. This could lead to the formation of soap.
It is also evident that the temperature and time of reaction has minimal effect on the yield on
biodiesel obtained. Temperature only affects the initial stages of the reaction. The effects are mild
afterwards. The transesterification reaction is also only rapid in the first hour of reaction. The rate
of reaction proceeds slowly after that.
It is suggested that for maximum conversion of the ester, a 6:1 ratio be used. This is because even
though the methanol-oil ratio doesn’t affect yield after the 3:1 ratio, it is always advised to have
excess alcohol as this pushes the equilibrium position to the right, favouring the formation of
products. Mixing is also very necessary, considering potassium carbonate is insoluble in methanol.
It is recommended that the effect of FFA, the weight of catalyst and the rate of stirring be further