Optimization of Process Parameters in
Finishing of Weld Bead Using WEDM
Amit Nara
1, Sahil Takhi
21Research scholar, P.C.E.T lalru (Punjab), India
2Assistant Professor, Dept. Of Mechanical Engineering P.C.E.T lalru (Punjab), India
ABSTRACT: Wire electric discharge machining (WEDM) is a special thermal non-traditional machining process in which the material is removed from the work-piece by a discrete spark between the work-piece and the conductive wire which has ability to generate complicated shapes of varying hardness with high accuracy and precision. In present work, WEDM process has been performed to finish weld beads developed on mild steel specimens using various process parameters like weld bead, Input current (I/P), Pulse-On (Ton), Servo voltage (SV), Wire feed (WF) were used. The paper describes the development of single response optimization using Taguchi method to predict the optimal setting of machining of wire electric discharge machine. Experiment were conducted using L18 orthogonal array and the response
characteristics for above process parameters were Cutting Speed (C.S) and Surface roughness (S.R) using taguchi approach to find out the optimal process parameter setting. ANOVA was used to find out the level of significance of machining parameters and finally in the end the confirmation experiment was conducted to validate the effectiveness of the present work.
KEYWORDS: Mild steel, WEDM, L18 orthogonal array, S/N ratio, ANOVA
I. INTRODUCTION
WEDM is very similar to conventional EDM process involving the erosion effect produced by electric discharge b/w the work piece and conductive wire. The material removal take place when the voltage supply increases beyond the breakdown voltage the dielectric fluid gets ionized due to which the electron strikes the work-piece and vaporise the part of the material. This process finds suitable application in automotive aerospace, mould, tool and die making industry. It has also made a significant inroad in medical, optical, dental and jewellery industry. It is also used to produce shapes which are extremely difficult to otherwise. Viz. square, D hole, Splines etc.
II. EXPERIMENTAL SET-UP AND SELECTION OF PROCESS PARAMETERS
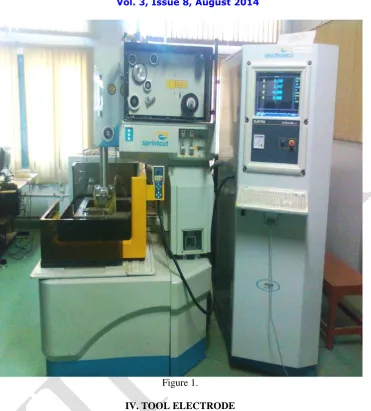
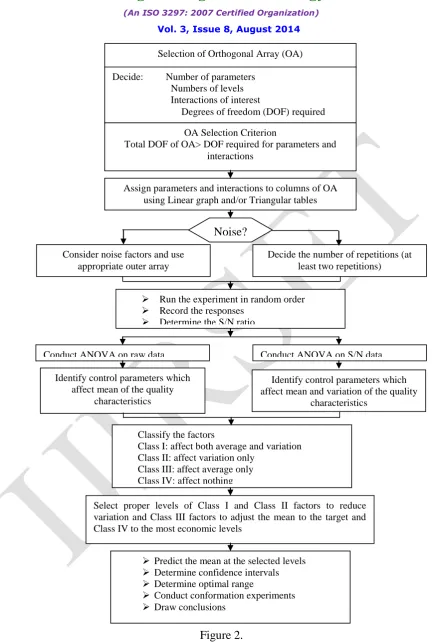
The pulse generator capacity of the machine is 40A. The pulse generator supplies the electrical energy to the spark gap in the form of pulses. The machine tool unit comprises of a main worktable (called X-Y table) by which the work piece is clamped on auxiliary table (called U-V table) and wire drive mechanism. Figure 1. shows the experiments are carried out in CNC sprint cut wire EDM of Electronic a Machine tool ltd. Figure 2. shows the stepwise procedure for Taguchi experimental design and analysis.
III. WORK PIECE ELECTRODE
Figure 1.
IV. TOOL ELECTRODE
Zinc coated copper wire having dia of 0.25mm is used in the present investigation as the electrode. Zinc coated Copper wire electrode can conduct high current as compare to simple copper wire.
V. SELECTION OF PROCESS PARAMETERS AND THEIR RANGES
In order to obtain high cutting speed, accurate dimension, better quality of surface roughness and the Good Material removal rate can be obtained by WEDM process. The optimal level of WEDM process parameters need to be determined. Based on the critical review of literature, process variables of the WEDM are selected according to transient state.
The process parameters selected for this study are as following: a. Weld bead
b. Discharge Current c. Pulse-on time d. Servo voltage e. Wire Speed
Figure 2.
Selection of Orthogonal Array (OA)
Decide: Number of parameters Numbers of levels Interactions of interest
Degrees of freedom (DOF) required
OA Selection Criterion
Total DOF of OA> DOF required for parameters and interactions
Assign parameters and interactions to columns of OA using Linear graph and/or Triangular tables
Noise?
Consider noise factors and use appropriate outer array
Decide the number of repetitions (at least two repetitions)
Run the experiment in random order Record the responses
Determine the S/N ratio
Conduct ANOVA on raw data Conduct ANOVA on S/N data
Classify the factors
Class I: affect both average and variation Class II: affect variation only
Class III: affect average only Class IV: affect nothing Identify control parameters which
affect mean of the quality characteristics
Identify control parameters which affect mean and variation of the quality
characteristics
Select proper levels of Class I and Class II factors to reduce variation and Class III factors to adjust the mean to the target and Class IV to the most economic levels
Predict the mean at the selected levels Determine confidence intervals Determine optimal range
VI. SELECTION OF ORTHOGONAL ARRAY (OA) AND PARAMETER ASSIGNMENT
Before selecting a particular OA to be used as a matrix for conducting the experiments, the following two points are first considered:
1. The number of parameters and interactions of interest. 2. The number of levels for the parameters of interest.
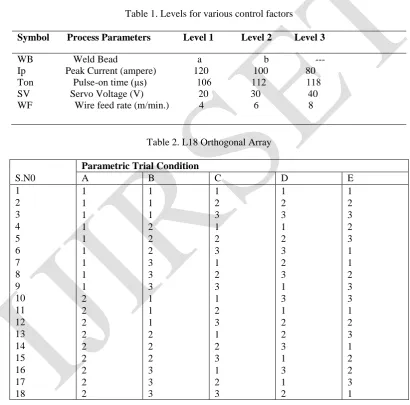
Degree of freedom (DOF) associated with each factor is equal to no. of level -1. Therefore, total degree of freedom for the five factors is (1+2+2+2+2) 9. As per Taguchi’s method, the total DOF of selected OA must be greater than or equal to the total DOF required for the experiment. So, L18 OA having 17 (=18-1) degree of freedom is selected for the
present analysis. The experiments are conducted at each trial conditions as given in table 2. For each trial, the experiments is repeated by three times.
Table 1. Levels for various control factors
Symbol Process Parameters Level 1 Level 2 Level 3
WB Weld Bead a b ---
Ip Peak Current (ampere) 120 100 80
Ton Pulse-on time (μs) 106 112 118
SV Servo Voltage (V) 20 30 40
WF Wire feed rate (m/min.) 4 6 8
Table 2. L18 Orthogonal Array
Parametric Trial Condition
S.N0 A B C D E
1 1 1 1 1 1
2 1 1 2 2 2
3 1 1 3 3 3
4 1 2 1 1 2
5 1 2 2 2 3
6 1 2 3 3 1
7 1 3 1 2 1
8 1 3 2 3 2
9 1 3 3 1 3
10 2 1 1 3 3
11 2 1 2 1 1
12 2 1 3 2 2
13 2 2 1 2 3
14 2 2 2 3 1
15 2 2 3 1 2
16 2 3 1 3 2
17 2 3 2 1 3
18 2 3 3 2 1
VII. RESULT AND DISCUSSION
average value of response characteristics, mean data and S/N ratio for each parameter, at all levels, is calculated from
table 3. These effects are plotted by using MINITAB 15 SOFTWARE
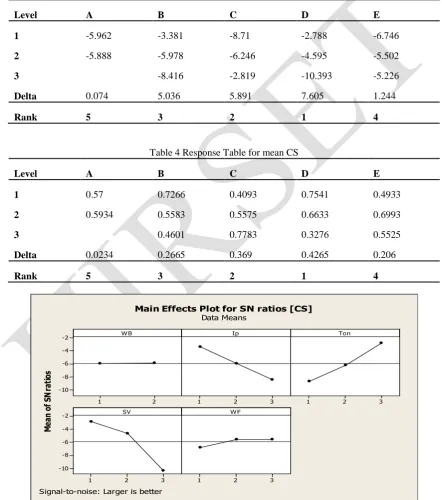
Effect Of Parameters On Cutting Speed
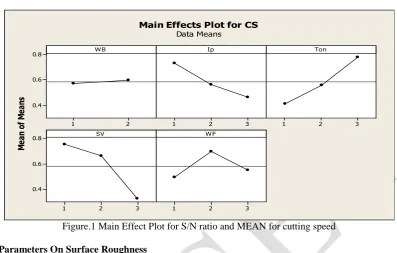
Average value of Cutting speed calculated from raw data is 0.582mm /min. It is clear from the S/N plots. That the maximum S/N ratio occurs correspond to A2,B1,C3,D1,E3.Therefore, the optimum value will correspond to these factors but only the significant factor would be chosen. This factor will be chosen from the ANOVA table.
Table 3. Response Table for Signal to Noise Ratios (Larger is better)
Level A B C D E
1 -5.962 -3.381 -8.71 -2.788 -6.746
2 -5.888 -5.978 -6.246 -4.595 -5.502
3 -8.416 -2.819 -10.393 -5.226
Delta 0.074 5.036 5.891 7.605 1.244
Rank 5 3 2 1 4
Table 4 Response Table for mean CS
Level A B C D E
1 0.57 0.7266 0.4093 0.7541 0.4933
2 0.5934 0.5583 0.5575 0.6633 0.6993
3 0.4601 0.7783 0.3276 0.5525
Delta 0.0234 0.2665 0.369 0.4265 0.206
Rank 5 3 2 1 4
2 1
-2
-4
-6
-8
-10
3 2
1 1 2 3
3 2
1 -2
-4
-6
-8
-10
3 2
1 WB
M
ea
n
of
S
N
ra
tio
s
Ip Ton
SV W F
Main Effects Plot for SN ratios [CS] Data Means
2 1
0.8
0.6
0.4
3 2
1 1 2 3
3 2
1 0.8
0.6
0.4
3 2
1 W B
M
ea
n
of
M
ea
ns
Ip Ton
SV W F
Main Effects Plot for CS Data Means
Figure.1 Main Effect Plot for S/N ratio and MEAN for cutting speed
Effect of Parameters On Surface Roughness
Surface roughness is a key factor in die making and depends upon the energy drop across the electrodes. Surface roughness is a “smaller is better” type characteristics. So, the optimum value of surface roughness should be low so that depth of recast layer remains minimum or equal to zero. Average value of surface roughness is 0.969µm. It is clear from the S/N plots. That the maximum S/N ratio occurs correspond to A2,B1,C1,D2,E1.Therefore, the optimum value will correspond to these factors but only the significant factor would be chosen. This factor will be chosen from the ANOVA table Main effects of each parameter are calculated from response table 5 and 6 as shown in fig 2. These effects are plotted by using MINITAB 15.
Table 5. Response Table for Signal to Noise ratio SR (Smaller is better)
Level A B C D E
1 -4.683 -3.853 -1.588 -5.286 -4.385
2 -4.553 -4.581 -4.293 -4.17 -4.706
3 -5.437 -7.972 -4.397 -4.762
Delta 0.13 1.602 6.385 1.116 0.377
Rank 5 2 1 3 4
Table 6. Response Table for mean SR
Level A B C D E
1 1.801 1.628 1.203 1.953 1.73
2 1.784 1.793 1.606 1.688 1.803
Delta 0.017 0.328 1.312 0.265 0.115
Rank 5 2 1 3 4
2 1 -2 -4 -6 -8 3 2
1 1 2 3
3 2 1 -2 -4 -6 -8 3 2 1 WB M ea n of S N ra tio s Ip Ton SV WF
Main Effects Plot for SN ratios [SR]
Data Means
Signal-to-noise: Smaller is better
2 1 2.4 2.1 1.8 1.5 1.2 3 2
1 1 2 3
3 2 1 2.4 2.1 1.8 1.5 1.2 3 2 1 WB M ea n of M ea ns Ip Ton SV WF
Main Effects Plot for SR Data Means
Figure. 2 Main Effect Plot for S/N ratio and MEAN for surface roughness
VIII. CONFIRMATION EXPERIMENT
It is conducted for the cutting speed and for surface roughness. The experimental value obtained at the optimal setting of parameter is:
IX. CONCLUSION
On the basis of above studied experiments, it can be safely concluding that:- .
The cutting speed are mostly affected by the peak current (Ip), pulse-on time (Ton) and servo voltage (SV). Surface roughness are mostly affected by the peak current (Ip), pulse-on time (Ton) and servo voltage (SV).
REFERENCES
1. Shunsuke Tomuraand Masanori Kunieda; (2009), “ Analysis of electromagnetic force in wire-EDM.” Precision Engineering Volume 33, Issue 3, Pages 255-262.
2. Thomas R. Newton, Shreyes N. Melkote;Thomas R. Watkins, Rosa M. Trejo and Laura Reister(2009), “Investigation of the effect of process parameters on the formation and characteristics of recast layer in wire-EDM of Inconel 718.”, Journal of Materials Science and Engineering: A Volumes 513-514, Pages 208-215.
3. Mu-Tian Yanand Yi-Ting Liu Design,(2009), “ Analysis and experimental study of a high-frequency power supply for finish cut of wire-EDM.” International Journal of Machine Tools and Manufacture Volume 49, Issue 10, Pages 793-796.
4. Eva Portillo, Marga Marcos, Itziar Cabanes, “Real-time monitoring and diagnosing in wire-electro discharge machining.” The International Journal of Advanced Manufacturing Technology, Volume 44, Numbers 3-4.
5. Habib et al., “Computational fluid dynamics analysis of working fluid flow and debris movement in wire EDMed kerf.” CIRP Annals - Manufacturing Technology Volume 58, Issue 1, 2009, Pages 209-212.
6. Pujari srinivasa, Kooma Ramji, Beela Satyanarayana. Effect of WEDM conditions on surface roughness:A Parametric optimisation using Taguchi Method: international journal of advanced engineering sciences amd technologies Vol No-6, PP-41-48 (2011).
7. V.Muthuraman, R.Ramakrishnan, L.Kartikeyan, C.Parveen. Influences of process variables during wire electric discharge machining of O1 Steel: European journal of scientific research. Vol79 no 3 pp 449-456 (2012).
8. Anish kumar, Vinod Kumar, Jatinder Kumar. Prediction of surface roughness in wire electric discharge machining(WEDM) process based on response surface methodology: international journal of engineering and technology. Vol 2 No. 4 pp-708-719 (2012).
9. Aniza Alias, Bulan Abdullah, Nonliana Mohd. Abbas. Influence Of machine feed rate in WEDM of titanium Ti-6AL-4V with constant current (6A) using brass wire: International Symposium on Robotics and intelligent sensors(2012) procedia engineering 41 pp-1806-1811.