Implementing Machine Learning Algorithms
through Model Stacking
S.Sailaja Rani
1, A. M. Sowjanya
2P.G. Student, Department of Computer Science & Systems Engineering, Andhra University College of Engineering (A), Visakhapatnam, India1
Assistant Professor, Department of Computer Science & Systems Engineering, Andhra University College of Engineering (A), Visakhapatnam, India2
ABSTRACT: In this paper we demonstrate that the performance improves while using machine learning algorithms with stacking model. Here the high level model is combined with the lower level model to improve the accuracy and other evaluation metrics. The datasets are analysed using pre-processing and feature selection techniques. The selected Models are K-means for clustering and KNN, Linear Regression, Logistic Regression for classification .We combine an unsupervised model with a supervised model to improve the performance where K-means is stacked on top of logistic regression and KNN to build a superior model. In this paper various machine learning algorithms and model stacking is implemented on house dataset and diabetes dataset.
KEYWORDS: Diabetes, House price, unsupervised model, supervised model K-Means, Logistic Regression (LR), KNN, Linear Regression and Model Stacking Introduction
I. INTRODUCTION
Diabetes is a chronic illness. Where blood glucose level of a body becomes high because of the proper amount of insulin is not being produced. This may cause to life-threatening harms which lead to blindness heart disease, kidney failure etc. WHO has stated that, there was a estimate of 3.4million deaths due to high blood sugar. The IDF projects that the number of Indians with diabetes will soar to 123 million by 2040.Currently 5% of Indian population suffer from diabetes. When Diabetes is not diagnosed at right time, this can extend tomany complications which contribute to death. Another dataset which we have taken is house dataset. As Real Estate Property is not only the basic need of a man but today it also represents the riches and prestige of a person. There are many people who are affected by the changes in the real estate prices such as bankers, policy makers. The house price prediction can aid the developer the selling price of a house and the customer to purchase the house. We focus on predicting the right algorithm for a specific problem based on features of the Diabetes dataset and house datasets. To improve accuracy the Stacking methods is introduced. Where we can combine multiple models that led to bias predetermine and variance reduction. The result shows thatKMeansstacked with logistic regression is performed well.
II. RELATEDWORK
model using Bagged Decision Tree, Random Forest and Extra Trees [3]. Guru Charan used Random Forest, SVM, KNN and Logistic Regression .He states that we can use any model as a Meta classifier to fit on the predictions of the base classifiers to get better results [4]. Sebastian Raschkaanalyzed that the stacking model performance is improved using probabilities of the first level classifiers can be used to train the meta-classifier (second level classifier) [5].
III. METHODOLGY
A description of methodology is represented about the framework that is undertaken. It consists of various milestones that need to be achieved in order to fulfill the objective. We have undertaken different machine learning concepts.
1. Data Collection
Diabetes dataset and House dataset are used in this project. The diabetes dataset has Dimensions: (768, 9). whereas the house datset consists of 1468 records with 20 parameters that have the possibility of affecting the house prices. Parameters such as id, price, bedroom, sqft-living, floors, sqft-lot, condition, View, Grade, sqft-above, sqft-basement, yr_renovated, yr_built, zipcode, sqft_living15, llong, and sqft_lot15. Price is a dependent variable on several other independent variables. In this dataset some parameters had numerical values and some were ratings. The ratings are converted to numerical values. Following Table 1 represent description about parameters in the Diabetes dataset.
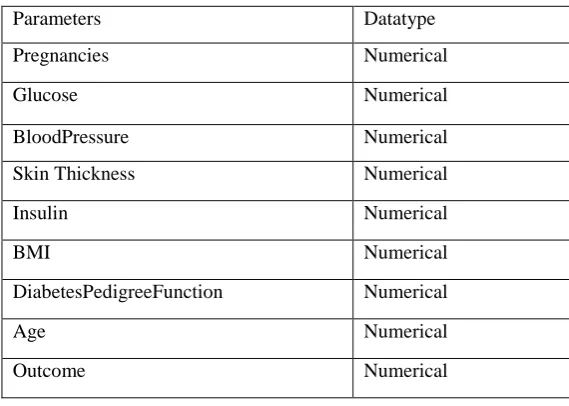
Table 1.The Parameters of Diabetes dataset
Parameters Datatype
Pregnancies Numerical
Glucose Numerical
BloodPressure Numerical
Skin Thickness Numerical
Insulin Numerical
BMI Numerical
DiabetesPedigreeFunction Numerical
Age Numerical
Outcome Numerical
2. Data Preprocessing
2.3. Outliers:
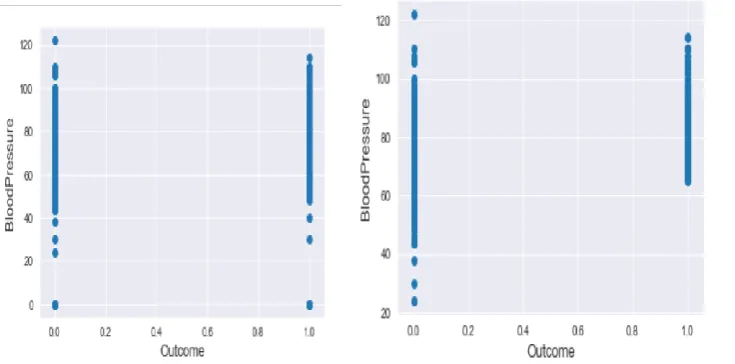
The data point which lies far away from other observations which can mislead the final predictions which reduces the accuracy of the results. The Outliers occur due to some kind of experimental errors and they need to be excluded from the dataset. In the Fig1.We can see at the right and left bottom corner with one extremely large Outliers from the diabetes dataset. The data contain 0 values for blood pressure. that the values of the dataset seems wrong because a living person cannot have diastolic blood pressure of zero.
So we have to remove the outliersof dataset. In the Fig2. The outliers are removed.
But
removing all the outliers may affect our models. Instead of removing them all, we will just manage to make some of our models robust on them.Fig 1. Outliers of diabetes dataset Fig 2. Outliers removed
3. Data Analysis
First, we need to determine the characteristics of our dataset before applying any model to our dataset, we ought to find out. Thus, we need to analyze our dataset after the data is collected, cleaned and processed we study the different parameters and relationship between these parameters.
Data Correlation using a heatmap
Fig.3.Data correlation of house datset Fig.4.Data correlation of diabetes dataset
4. Feature Engineering
It transforms the raw data into features which helps to perform the model in an efficient manner. The dataset may contain some irrelevant features but add more weight due to higher scale and some with small values are not being contributed even if they are significant. The features which we select determines the performance of the model.
5. Evaluation Method
1. K-Fold Cross Validation: The limited data sample is given to estimate how the given model is performing on the dataset. Where K is the number of groups that a data sample is split into. If the K =10 then it is 10-fold cross validation 2. Train/Test Split: The model would be over fit if you run same data for both training and testing the model. So we can use some of the data to be feed to the algorithm and the test data to evaluate our model.Using python ML the dataset is being split into train set and test set around 30%-70%.
6. APPLYING OF ALGORITHMS:
Elbow method
The elbow method helps us to determine the appropriate number of clusterrs in the dataset. From the Fig 5. The number of clusters chosen should be between 3 to 5.
Fig 5. Elbow Method
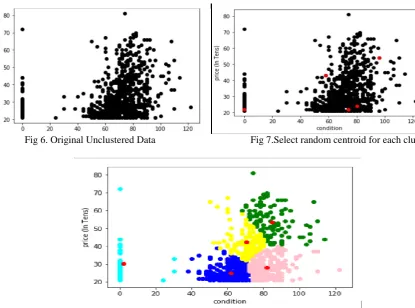
From the elbow method we can consider how many clusters to be formed to predict data accurately for house dataset and form clusters. For the house dataset we choose the number of clusters (k=5) and select random centroid for each cluster shown in the Fig 6. and Fig 7.
The number of clusters K=5
Fig 6. Original Unclustered Data Fig 7.Select random centroid for each cluster
|
LINEAR REGRESSION:
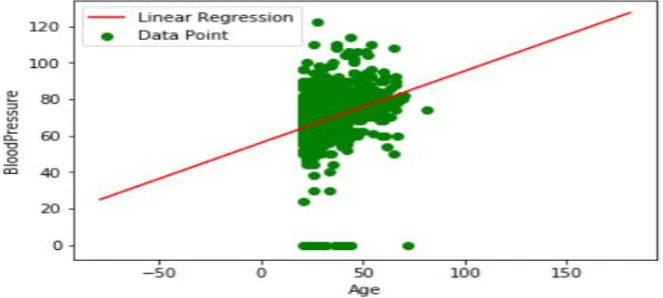
Linear Regression is a supervised machine learning algorithm where the predicted output is continuous and has a constant slope. It‟s used to predict values within a continuous range, (e.g. sales, price) instead of trying to classify them into classes. Based on the datset the data points are plotted using the linear equation.The linear regression equation form is stated as Y= a + bX, where Y is the dependent variable which is plotted on Y axis, X is the independent variable which is plotted on the X axis and b is the slope of the line and is the y-intercept.
Fig 9.Linear Regression for diabetes dataset
The red line in the above graph is referred to as the best fit straight line.
LOGISTIC REGRESSION
Logistic Regression is used where a discreet output is expected such as the happening of some event and it is a algorithm based on probability. Sigmoid” (Logistic function) is one of such function which has “S” shape curve used for binary classification. It converts values to the range of 0, 1 which interpreted as a probability of occurring some event.
y = e^(b0 + b1*x) / (1 + e^(b0 + b1*x))...Equation (1).
Above is a simple logistic regression equation where b0, b1 areconstantsin data processing.While training values for these will be calculated such that the error between prediction and actual value become minimum.It computes the distribution between the independent variable(s) X and dependent variable Y of a boolean class by P (X|Y). Logistic regression classifies boolean class label Y as
𝑃(𝑌 = 1|𝑋) = 1
1+exp 𝑊0+ 𝑛𝑖=1𝑊𝑖𝑋𝑖 eq(1) 𝑃(𝑌 = 0|𝑋) =
exp (𝑊0+ 𝑛𝑖=1𝑊𝑖𝑋𝑖)
1+exp (𝑊0+ 𝑛𝑖=1𝑊𝑖𝑋𝑖)eq(2)
KMEANS AND LOGISTIC REGRESSION AS STACKED CLASSIFIERS.
The Logistic Regression algorithm and KNN algorithm act as Meta classifiers and KMeans as Base classifiers. As KMeans is a unsupervised learning the unlabled data is processed in the first level. Thefirst level regression algorithms is fit into the training data and produce a set of outputs. These output predictions are fed as inputs for the second level regressors and are fit using the training data..The output of the KMeans (first level algorithm) is input to the Logistic Regression (second level regressor). Which combine to form a stack model.In this, the dataset is divided into k folds, where k folds are fit into first level regressor and then to check its performance, it is tested on remaining one left fold. This occurs for all data in the train set. These results are then provided as input to second level regressor. This gives a new set of predictions as output. The optimization is done based on increasing the accuracy of the models.
IV.EXPERIMENTAL RESULTS
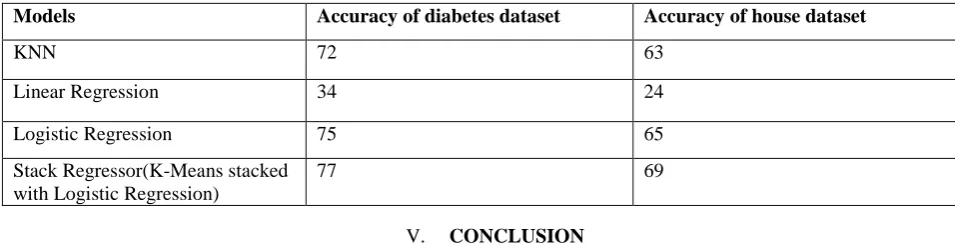
The following section shows the results of various algorithms that are applied. A stacked model is used to combine multiple machine learning types to make another superior model. K-Means is feeding into logistical regression. When we find the accuracy of individual classifiers (KNN, logistic Regression and Linear Regression) and stacked classifiers (K -Means feed into Logistic Regression and K --Means feed into Linear Regression) which are implemented on the datasets. The best efficient model is the stacked model – Logistic Regression with k-means algorithm.
Table 2. Accuracy of the Models
Models Accuracy of diabetes dataset Accuracy of house dataset
KNN 72 63
Linear Regression 34 24
Logistic Regression 75 65
Stack Regressor(K-Means stacked with Logistic Regression)
77 69
V. CONCLUSION
The results which are shown in the Table 2. Demonstrates that the Stack Regressor provides the best score among the models which we have used for modeling the datasets. First we had considered the individual models to predict the house price and diabeties outcome effectively. By examining the individual models we conclude that the Logistic Regression has performed well. So we had taken Logistic Regression as meta classifier. Finally, an unsupervised learning algorithm (KMeans) is fed into supervised learning algorithm (Logistic regression).So we combined the models to obtain better results. Thus we can say that Model Stacking helps in predicting house price and the diabetes more accurately.
REFERENCES
[1] A, Trevino, Introduction to K-means Clustering (2016), https://www.datascience.com/blog/k-means-clustering.
[2] A Comprehensive Guide to Ensemble Learning ()J, VanderPlas, Python Data Science Handbook: Essential Tools for Working with Data (2016).
[3] Scikit-learn Developers, sklearn.datasets.make_circles (2019),
https://scikit-learn.org/stable/modules/generated/sklearn.data sets.make_circles.html#sklearn.datasets.make_circles
[4] A, Zheng, et al, Feature Engineering for Machine Learning: Principles and Techniques for Data Scientists (2018)
[5] F, Gunes, Why do stacked ensemble models win data science competitions?
(2017), https://blogs.sas.com/content/subconsciousmusings/2017/05/18/stacked-ensemble-models-win-data-science-competitions/
[6] Pow, Nissan, Emil Janulewicz, and L. Liu. "Applied Machine Learning Project 4 Prediction of real estate property prices in Montréal." (2014). [7] Limsombunchai, Visit. "House price prediction: hedonic price model vs. artificial neural network."New Zealand Agricultural and Resource
Economics Society Conference. 2004
[9] Bhuriya, Dinesh, et al. "Stock market predication using a linear regression." Electronics, Communication and Aerospace Technology (ICECA), 2017 International conference of.Vol. 2. IEEE, 2017.