1
Prediction and Spread Visualization of Covid-19 Pandemic using Machine Learning
1Anit N Roy, 2Jais Jose, 2Aswin S, 3Neha Gautam, 4Deepa Nathalia, 2Arjun Suresh
1
Kerala University of Health Sciences, Thrissur, Kerala
2
Amity University,Noida, Uttar Pradesh
3University of Malaysia, Sarawak
4 Haryana Sarasvati Heritage Development Board
Corresponding Author Email: [email protected]
Abstract
The sudden pervasive of severe acute respiratory syndrome Covid-19 has been leading the universe into a prominent crisis. It has influenced each zone, for example, industrial area, horticultural zone, Public transportation, economic zone, and so on. So as to see how Covid-19 affected the globe, we conducted an investigation characterizing the effects of the pandemic over the world using Machine Learning (ML) method. Prediction is a typical data science exercise that helps the administration with function planning, objective setting, and anomaly detection. We propose an additive regression model with interpretable parameters that can be naturally balanced by experts with domain intuition about the time series. We focus on global data beginning from 22nd January 2020, till 26th April 2020 and performed
dynamic map visualization of Covid-19 expansion globally by date wise and predicting the spread of virus on all countries and continents. The major advantages of this work include accurate analysis of country-wise as well as province/state-wise confirmed cases, recovered cases, deaths, prediction of pandemic viral attack and how far it is expanding globally.
Keywords: Covid-19, Machine Learning, Pandemic, Additive regression model, Dynamic Map.
1.
Introduction
The sudden outbreak of severe acute respiratory syndrome coronavirus 2(SARS-CoV-2) has been leading the globe into a prominent crisis. The condition gets severe day by day as it could not be preventable by current treatment strategies. The first pandemic attack of SARS-CoV-2 was reported in Wuhan; sprawling capital of south china on 17th November 2019. The first diagnosed case was on 8th December 2019 and specialists didn’t publicly admit there was human-to-human transmission until 21st January. The signs and premonitions of Covid-19 are common and even nowwith no corroborative testing, it is anything but difficult to confuse this with another disease [1]. The clinical introduction is that of respiratory contamination with a manifestation seriousness going from a gentle basic cold-like condition to extreme viral pneumonia prompting intense respiratory distress that is possibly fatal [2]. The predominant infection spreads essentially through beads of salivation or release from the
2
nose when a contaminated individual hacks or sneezes. The flare-up was pronounced a general public health emergency of global solicitude on 30th January 2020. Significant hazard factors include; residence in/travel to area detailing network transmission during the 14 days before symptoms beginning, close contact with an affirmed case, older age as well as hidden wellbeing condition and malignancy [3].
By 4th March open worry about the epidemic, begun to bring about the first indications of frenzy coming about in quite a while of veils and hydro alcoholic gel to be depleted. Consequently, the government demanded protective masks and gloves along with medically approved sanitizers. Conveying that this type of defensive obstruction ought to be saved distinctly for the individuals who show indications of illness and for use by wellbeing experts. Notwithstanding this the cost of hydro alcoholic disinfectant gel was obstructed to forestall profiteering. Be that as it may, at present the supplies of covers and hydro alcoholic disinfectant gel is still problematically low [4].
In the present circumstance, a solid spotlight should stay on exhaustive testing and reconnaissance techniques (counting contact following), network measures (counting physical separating), reinforcing of human services frameworks and, illuminating general society and wellbeing network. The advancement of mental prosperity among individuals living under physical separating measures is important to guarantee that populaces have the flexibility to keep up adherence to these measures. Stringent physical separating measures are exceptionally problematic to society, both monetarily and socially. There is thusly huge enthusiasm for characterizing a sound way to deal with de-acceleration. In any case, except if the occurrence of contaminations is diminished to an exceptionally low level in a given setting, the transmission will proceed until a populace assurance limit is reached [5].
While focusing on the Indian predicament, the primary instance of the 2019–20 coronavirus epidemic in India was accounted on 30th January 2020, originated from China. Starting at 14 April 2020, the Ministry of Health and Family Welfare has affirmed an aggregate of 10,815 predicaments, 1,190 recovered, and 353 affirmed deaths in the nation. Specialists propose the count of the disease might be much higher as India’s examination rates are among the most diminished on the planet. The disease pace of Covid-19 across India is represented to be 1.7, fundamentally lower than in the most discernibly awful affected nations. Michal Ryan, Chief Executive Director of the World Health Organization’s health emergencies program, conveyed that India had “colossal breaking point”; to deal with the coronavirus erupt and, as the second most packed country will have a tremendous impact on the world’s ability to oversee it. Other observers stressed over the monetary decimation brought about by the lockdown, which effectively affects casual specialists, smaller scale and little undertakings, farmers, and the independently employed, who are left with no vocation without transportation and access to markets. Spectators express that the lockdown has eased back the development pace of the pandemic by 6th April to a pace of multiplying at regular intervals,
3
declared a 21-day across the nation lockdown: The lockdown has been reached out till 3rd
May 2020.
As of 14th April 2020 (5:00 PM), according to the Ministry of Health and Family Welfare (MoHFW), a sum of 10815 Covid-19 cases, (including 76 outside nationals) have been accounted for in 32 states/union territories. These incorporate 1189 who has been restored/released, one who has moved and 353 deaths. Clinical isolation of every single affirmed case, tracking and home quarantine of the contacts is progressing [7].
1.1 Origin and Spread
Coronaviruses were primarily found during the 1930s when a serious respiratory illness of trained chickens was shown to be brought about irresistible bronchitis infection (IBV). During the 1940s, two progressively creature coronaviruses, mouse hepatitis contamination (MHV) and transmissible gastroenteritis disease (TGEV), were dissociated. Human coronaviruses were found in the 1960s. The most punctual ones analyzed were from human patients with typical cold, which were subsequently pronounced human coronavirus 229E and human coronavirus OC43. Likewise, human coronaviruses have since been recognized, incorporating SARS-CoV in 2003, HCoV NL63 in 2004, HKU1 in 2005, MERS-CoV in 2012, and SARS-CoV-2 out of 2019. A huge part of these has included authentic respiratory tract diseases. On 31 December 2019, the pandemic was followed to a novel strain of coronavirus, which was given the break name 2019-nCoV by the World Health Organization (WHO), later renamed SARS-CoV-2 by the International Committee on Taxonomy of Viruses [8]. The Covid-19 pandemic speaks to the best worldwide general wellbeing emergency of this age and, conceivably since the pandemic influenza episode of 1918. This novel Beta-coronavirus is concordant to severe respiratory disorder coronavirus (SARS-CoV) and Middle East respiratory disorder coronavirus (MERS-CoV) in light of its genetic proximity, its likely cause to be made from bat-determined coronaviruses with spread by means of an obscure middle of the road well-evolved creature host to humans.
1.2 Clinical Trials
The inquiry terms Covid OR coronavirus OR SARS-COV-2 on Clinical- Trials government brought about 351 dynamic trials, with 291 trials explicit to Covid-19 as of 2nd April , 2020. Of these 291 trials, around 109 trials (counting those not yet selecting, enlisting, dynamic, or completed) included pharmacological treatment for the treatment of Covid-19 in adult patients. Of these 109 trials, 82 are interventional considers, with 29 placebo-controlled trials. Per depiction of the examinations, there are 11 phase 4, 36 phase 3, 36 phase 2, and 4 phase 1 trials. Twenty-two trials were not arranged by phase or not applicable [9].
1.3 Repurposed Therapy Plan
4
selecting and expected to set up the viability of these proposed treatments. Various operators exhibit in vitro action against novel coronaviruses including SARS-CoV-2. Insignificant particle database screens distinguished a great many potential specialists. Of these, few repurposed operators used to treat an assortment of other illness (eg, HIV and auto immune disorders) have been proposed as could reasonably be expected treatment choices for Covid-19. Lopinavir/ritonavir and chloroquine or then again hydroxychloroquine are the best drug with the most clinical importance, either positive or negative, in the treatment of Covid-19. Until this point, accessible clinical preliminaries have not illustrated that any of these medications are plainly viable.
The utilization of repurposed drugs depends on the supposition that the benefits (in vitro/clinical proof) exceed related adverse reactions. One restriction to utilizing repurposed specialists is the affinity of these operators to cause intense poisonous quality. This intense danger may exceed the indistinct advantage of a particular antiviral specialist. Expanded toxicity with combination therapy, for example, heart or liver toxicity, makes potential extra hazards and requirements for close chance versus advantage examination. In general, the scarcity of proof showing an unmistakable advantage may not legitimize the danger of the repurposed agent(s). This is of the highest worry in patients at high risk of toxicity and in circumstances where antagonistic occasions may block section into investigational trials.
1.4 Pathological Evaluation and Clinical Outcomes
In light of perceptions in the USA, Spain, Italy, France and, the UK, and from postmortem of lungs implicated in Covid-19, all uncovered pulmonary thrombosis which isn’t a case of ARDS(Acute respiratory distress syndrome), however all the more disturbing that it shows restraint hypoxemia that isn’t reacting to PEEP (positive end-expiratory pressure) but high oxygen stream. Like methemoglobin, the Covid-19 infection basic protein sticks to heme - dislodges oxygen which discharge free-iron, that prompts toxicity and causes swelling of alveolar macrophages that outcomes in respective CT scan changes as it is a systemic response. There is no advantage of invasive ventilation, however patients may require recurrent blood transfusions or plasmapheresis. The Covid-19 virus assaults beta chain, separates heme, displace iron, and converting to porphyrin. The infection can separate oxy-Hb, carboxy-oxy-Hb, and glycosylated Hb. Lung inflammation occurred from both oxygen and CO2 exchange, prompting the ground glass on x-rays, it reflects CO2 toxicity as an
undetectable enemy.
5
1.
5 Machine learning assisted decision makingWhile numerous healthcare associations have actualized Artificial Intelligence (AI) and Machine Learning (ML) tools at the purpose of care, few have effectively applied them to significant level decision making. A new frontier is expanding AI from artificial intelligence to augmented intelligence; traditional AI focuses on improving analytics efficiency while augmented intelligence is about improving the decision-making ability of healthcare leaders [10]. Machine learning gives more effectiveness and energy in healthcare, organizations still need a collaborative approach, clear knowledge of data processes and a fit leadership to impact genuine change. This is useful for the Government and other healthcare organization for decision making, function planning, goal setting and prediction. In our case, anyone can use this for the pandemic virus spread prediction worldwide.
2.
Methodology
The methodology consists of 3 steps, first one is the data collection. We have collected the dataset from Kaggle, second step is to generate a dynamic map of expansion of Covid-19 from the date of 22nd January 2020 till 26th April 2020 globally. Basically, our study period was 3 months and we analyzed and visualized the spreading of the virus country-wise as well as globally during the study period with confirmed cases, recovered cases and deceased. Finally, we predicted the expansion of the virus globally with the help of plotly and prophet python library. Prediction is a typical data science exercise that helps the administration with function planning, objective setting, and anomaly detection.
2.1 Dataset Introduction
This dataset has everyday level data on the number of influenced cases, recovery, and deceased from 22nd January 2020 to 26th April 2020. [11]. It has a total of 17688 rows and 8 columns. These are the columns in the dataset SNo., Observation Date, Province/State, Country/Region, Last Update, Confirmed, Deaths, and Recovered.
2.2 Prophet Prediction Model
6
Where {yi ,xi1,……….,xip }ni=1 is the dataset of n statistical units, {xi1,……….,xip}ni=1 indicates
predictors and yi is the output, E[€] = 0. Var(€) = σ2 and E[fj(Xj)] = 0. fj(xij) is known as
smooth function fit from the data. Fitting the additive model (i.e. fj(xij) ) can be done using
the backfitting algorithm proposed by Andreas Buja, Trevor Hastie and Robert Tibshirani on 1989 [13].
2.3 Nonlinear Trend Model
For the expansion of the virus, the centre part of the information producing process is a model for how the pandemic has developed and how it is relied upon to keep developing. This kind of growth is ordinarily displayed utilizing the logistic growth model, which in its most fundamental structure is
g(t) = C / 1 + exp(−k(t − m))
where C is the number of affected cases, m is an offset parameter and k the rate of increase.
2.4 Linear Trend and Changepoints
For prediction issues that don't display impregnating growth, a piece-wise constant pace of development gives a stingy and frequently useful pattern trend model[14]. Mathematical expression for this trend model is
g(t) = (k + a(t)
Tδ)t + (m + a(t)
Tγ)
where k is the rate of growth, δ has the adjustment rate, m is the offset parameter, and γj is set to −sjδj to make the function continuous[15].
3.
Result and Discussion
7
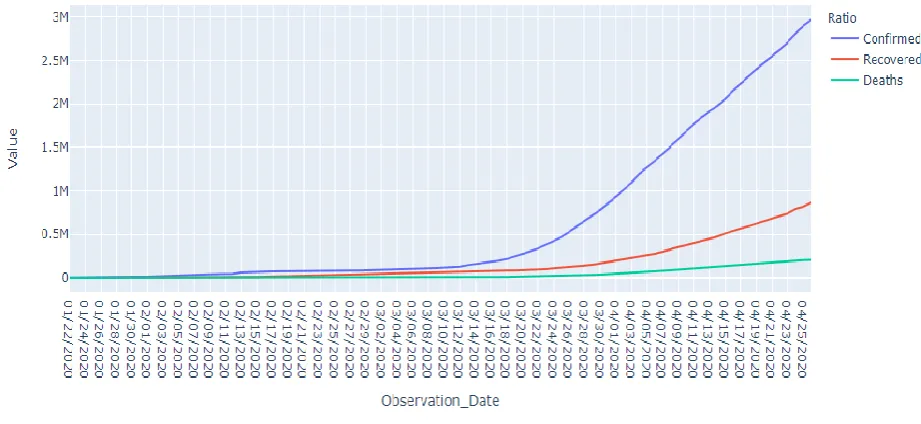
graphical representation of confirmed cases, recovered cases, deaths during the study period. Almost the 3 cases were going in a straight line from 22nd January 2020 to 11th February and after that it suddenly increased exponentially. The proven cases reached 30 lakhs within 3 and half months. From this we can assume the expansion of this virus. The major number of deaths reported worldwide are people of age 55 above due to the lack of immunity.
Fig.1: Graphical representation of confirmed cases, recovered cases and deaths globally.
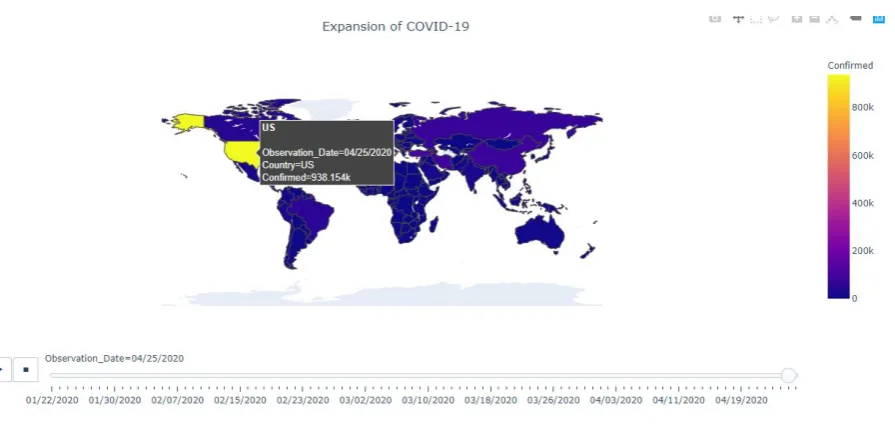
Figure 2 shows the general structure of Covid-19 expansion. From the overview of Covid-19 expansion, we can see that blue colour indicates the very less virus prone country and bright yellow indicates the countries having a higher number of reported cases/confirmed cases.
Fig.2: Overview of Covid-19 expansion
8
United States, Thailand, Japan, Taiwan and South Korea. Till 22nd January 2020, the
confirmed cases in United States, Taiwan and South Korea are about only single confirmed case but in China the proven cases are 547. It’s getting a huge difference when comparing the number of confirmed cases of China with other 5 countries.
Fig.3: Status of the world till 22nd January 2020
While focusing on the status of the world till 22nd February 2020 in figure 4. We can see that, it has been covered around 50 percent of the total globe within the time period of 22nd January 2020 to 22nd February 2020. While assimilating with other nations China is occupying the peak position with 76922 confirmed cases and South Korea brings out the second position with 433 cases. The third position has been accompanied by Japan with 122 proven cases.
9
The change of confirmed cases within one month is very big in China and we can see the changes in all other countries also. From these figures we can see that how fast it is spreading all over the world. Figure 5 provides a clear picture of the pandemic virus attack affected all over the world till 22nd March 2020.
Fig.5: Status of the globe till 22nd March 2020
By visualizing the data on figure 5 we can see that it has spread globally within 2-3 months. China is still topmost in the list with 81060 confirmed cases and Italy has been reached the second position with 59138 proven cases from 62 cases. There is a change of 59076 cases happened within a month in Italy as well as the United States and Spain also got a sudden hike of 33848 and 28603 cases during the same time period. A total of 337122 people got affected with the contagious viral infection, 97243 people recovered and 14623 people were died till 22ndMarch globally. Figure 6 explains the current scenario of Covid-19 exposure until 25thApril 2020. United States extinguishes all other nations with a rapid boom of
10
Fig.6: Status of the world until 25thApril 2020
Figure 7 illustrates an overview of the total confirmed cases worldwide. It is a country-wise assortment indicating the highest and lowest infected areas. It provides a clear review of the relevant pandemic attack affected over various nations. Since the U.S appears to be the highest infected country while Yemen is considered to be the lowest.
Fig.7: Countrywise analysis of confirmed cases
Figure 8 portraits over the United States pursuing higher confirmed Covid-19 status. Undoubtedly we can affirm that the U.S has undergone exponential growth over the epidemic viral attack. The rate of infection has been progressed from one case to l lakh cases within a period of 65 days. The confirmed cases on 27th March 2020 was 101657 and it attains a quick
11
Fig.8: Confirmed Covid-19 status of United States
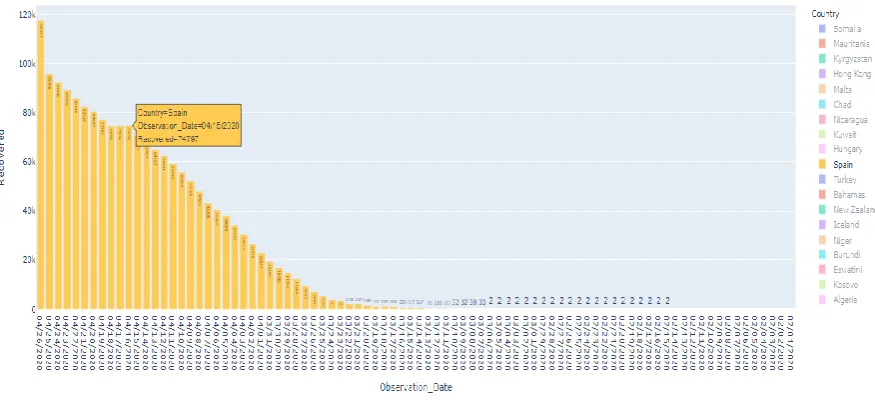
Figure 9 shows an overview of recovery status all over the world. Spain has 117727 recovered cases and it’s the highest number till 26th April 2020. Germany and the United
States are in the second and third position with 112000, 106988 respectively.
Fig.9: Countrywise recovery status
12
Fig.10: Recovered cases in Spain
Figure 11 is representing the survival status of Germany until 26th April 2020. It can be
analyzed that a magnificent change has occurred in the recovery status is on 8th April 2020 which is around 10000 cases.
Fig.11: Recovered cases in Germany
13
Fig.12: Countrywise assessment of death status
Figure 13 shows the mortality rate of the United States. The prominent death rate is reported on 16th and 17th April 2020. About 54881 people have died during our study period. Clearly, we can interpret that community has been denoted as the major reason behind the crisis.
Fig.13: Mortality rate of United States during the study period
14
Fig.14: Mortality rate of Italy during the study period
The lack of social distancing and shortage of adequate ventilatory support seems to be the reason behind the uncontrolled spread in Italy. Figure 15 elucidates the prediction of Covid-19 world wide using machine learning and an additive regression model was used to predict the spread. The study was carried out by using the dataset from Kaggle and we predicted the epidemic spread based on the previous data which is collected until 26th April 2020.
Fig.15: Prediction of Covid-19 world wide
Based on our prediction the number of confirmed cases on 30th April 2020 is 32,83,334 and it would reach 4088231 by 10th May 2020. From this prediction, we can analyze that the
15
4.
Conclusion
The study on the prediction of Covid-19 pandemic infection using machine learning reveals the comparative discussion on the confirmed cases, recovered cases, and the mortality status across various countries within the planet. While we go through the epidemic status, the lack of proper social distancing and personal hygiene playing an important role in leading to the community widespread. The effective management using symptomatic therapy and quarantine system can control the spread of the disease state up to a limit. Although, the condition is getting worse may question the human existence inside the earth. Well, in the case of confirmed Covid-19 status, the United States showing the highest number of cases with 965783 and also it is in the peak position while checking the mortality status too. Yemen is in the least affected country with a single confirmed case. When moving onto the recovery status, Spain is exhibiting a drastic increment in the recovery rate. When compared with Spain, Germany also presenting with a remarkable survival status. The active measurements planned and executed against the epidemic attack by these countries were appreciable and should be followed by other nations. The death status reveals the highest proximity to the United States with 54881 cases and the least proximity towards Burundi. Hence, undoubtedly we can fetch out in an assumption that SARS- Covid-19 has been tremendously defeating over the largest developed country in the world. The prediction accurately accounts for the economic evaluation of the SARS-Covid-19 epidemic attack all over the world.
Acknowledgement
I would like to express my sincere gratitude to kaggle for providingus with a good dataset of Covid-19 as well as my parents, friends and teachers for supporting and motivating every stage of life.
References
1. https://bit.ly/2xpdu34
2.Suresh,A.,&Jindal,T.(2020).PhthalateToxicity.https://doi.org/10.20944/PREPRINTS20200 4.0209.V1
3. Suresh, A. Mystery over the Haze during 1st week of November 2019 in Delhi-NCR. Preprints 2020, 2020040156 (doi: 10.20944/preprints202004.0156.v1).
16
5. Jose, J.; Yuvaraj, E.; Aswin, S.; Suresh, A. Development of Worldwide Tsunami Hazard Map for Evacuation Planning and Rescue Operations. Preprints 2020, 2020040370 (doi: 10.20944/preprints202004.0370.v1).
6. https://en.wikipedia.org/wiki/2020_coronavirus_pandemic_in_India
7. https://www.who.int/india/emergencies/novel-coronavirus-2019
8. https://en.wikipedia.org/wiki/Coronavirus
9. James.M.Sanders, Marguerite.L.Monogue, Tomasz Z.Jodlowski,James.B.Cutrell(2020)
,Pharmacologic Treatments for Coronavirus Disease 2019(COVID-19);Clinical Review &Education,E1-E13
10. Bhardwaj, P., Suresh, A., Jose, J., Nathalia, D., & Jain, V. (2019). Satellite monitoring for spatio-temporal changes occurring in forest area of Sariska Tiger Reserve by implementing GIS and Remote Sensing techniques, 10, 26–36.
11. https://www.kaggle.com/sudalairajkumar/novel-corona-virus-2019-dataset/data
12. Nathalia, D., Suresh, A., & Singh, N. (2018). Monitoring land use / cover changes during the mining activities in Aravalli Hill Region, 3(6).
13. Buja, A., Hastie, T., and Tibshirani, R. (1989). "Linear Smoothers and Additive Models", The Annals of Statistics 17(2):453–555. JSTOR 2241560.
14. Taylor SJ, Letham B. 2017. Forecasting at scale. PeerJ Preprints 5:e3190v2 https://doi.org/10.7287/peerj.preprints.3190v2
15. Lopez CP., Tenemaza M., Loza-Aguirre E. (2019) Alternative Ensemble Classifier Based on Penalty Strategy for Improving Prediction Accuracy. In: Ahram T., Karwowski W., Taiar R. (eds) Human Systems Engineering and Design. IHSED 2018. Advances in Intelligent Systems and Computing, vol 876. Springer, Cham
16. C. Lopez, M. Santorum, and J. Aguilar, “FAVO: Framework of Autonomous Virtual Organizations based on Industry 4.0,” Iberian Journal of Information Systems and Technologies., vol. E27, pp. 333–345, 2020.