Diabetes, Metabolic Syndrome and Obesity: Targets and Therapy
Dovepress
O r i g i n A L r e S e A r c h
open access to scientific and medical research
Open Access Full Text Article
Serum ferritin concentration in gestational
diabetes mellitus and risk of subsequent
development of early postpartum diabetes
mellitus
Faranak Sharifi1
Amir Ziaee2
Abdolamir Feizi3
nouraddin Mousavinasab1
Afagh Anjomshoaa1
Pooran Mokhtari4
1Zanjan Metabolic Diseases research
center, Zanjan; 2Qazvin Metabolic
Diseases research center, Qazvin;
3Zanjan University of Medical
Sciences, Zanjan; 4Vali-e-asr hospital,
Zanjan, iran
correspondence: Faranak Sharifi Zanjan Metabolic Diseases research center, Vali-e-asr hospital, Zanjan, iran Tel +98 912 141 2528
Fax +98 241 727 0815
email [email protected]
Purpose: To compare the serum ferritin concentrations of normal pregnant women with those having gestational diabetes mellitus (GDM) and to determine the possible role of ferritin in predicting pregnancy outcome and early development of postpartum glucose intolerance and diabetes mellitus.
Method: This case-control study consisted of 128 pregnant women (64 women with GDM and 64 age-matched healthy pregnant women) seen at a university hospital in Zanjan, Iran. Anthropometric measurements were determined, and serum ferritin, C-reactive protein, insulin, glycosylated hemoglobin (HbA1c), and hemoglobin levels were measured. Pregnancy outcomes were recorded in all subjects. In the women with GDM, a diagnostic oral glucose tolerance test was performed eight weeks after delivery.
Results: Women with GDM had a higher concentration of serum ferritin (112 ± 28.4 pmol/L in GDM versus 65 ± 16.9 pmol/L in controls, P , 0.001). A positive correlation was found between serum ferritin level and mid-pregnancy fasting plasma glucose and HbAlc levels. Although women in the highest quartile of serum ferritin had a greater than two-fold increased risk of GDM, no significant correlation was found between ferritin levels and early postpartum oral glucose tolerance test results.
Conclusions: Elevated serum ferritin concentrations in mid-pregnancy are associated with an increased risk of GDM independent of C-reactive protein and body mass index. Ferritin levels in GDM cannot be used as an indicator to predict subsequent glucose concentration in early postpartum oral glucose tolerance test.
Keywords: gestational diabetes mellitus, ferritin, pregnancy outcome, diabetes mellitus, C-reactive protein
Introduction
Recent studies have reported positive associations of serum ferritin concentrations with cardiovascular risk factors,1 risk of insulin resistance syndrome, and risk of type 2 diabetes.2–4 In our previous study in Iran, we showed elevated serum ferritin concentra-tions in subjects with impaired glucose tolerance, known as a prediabetic state.5
Like impaired glucose tolerance in a nonpregnant subject, gestational diabetes mellitus (GDM) is an indicator for subsequent development of diabetes mellitus (DM) after delivery.6 Women with GDM are characterized by a relatively diminished insulin secretion coupled with pregnancy-induced insulin resistance.7 Causes of insulin resis-tance are not completely understood; however high maternal weight is associated with
Diabetes, Metabolic Syndrome and Obesity: Targets and Therapy downloaded from https://www.dovepress.com/ by 118.70.13.36 on 21-Aug-2020
For personal use only.
Number of times this article has been viewed
Dovepress
Sharifi et al
insulin resistance during pregnancy. Insulin resistance may be due to increasing secretion of human placental lactogen and other placental secretions or to a systemic inflammation dur-ing pregnancy.8,9 There is an increasing recognition that iron overload may play a role in insulin resistance at the cellular level.10,11 Some epidemiologic studies have reported higher levels of ferritin in women with GDM.12,13 However, data are conflicting regarding whether elevated serum ferritin reflects inflammation or increased iron stores.14,15 Furthermore, data are not available on the relationship between serum ferritin concentrations during pregnancy and insulin resistance, and also the risk of subsequent development of postpartum impaired glucose tolerance and overt DM. The objective of this case-control study was to analyze serum ferritin and C-reactive protein concentrations in GDM and also to evaluate the association of ferritin with pregnancy outcomes and early development of postpartum glucose intolerance and DM.
Materials and methods
This case-control study was conducted at Vali-e-asr Hospital, a general hospital in Zanjan, a major city located to the west of Tehran and the capital of the Iranian province with the same name. The province has a predominantly urban popula-tion of 1.1 million.
A total of 128 pregnant women, including 64 subjects with GDM and 64 healthy age-matched pregnant women, were enrolled serially at 24–28 weeks of gestation. All women with acute or chronic inflammatory or infective diseases, history of malignancy, DM, seizure disorders, acute or chronic liver disease, acute or chronic renal disease, drug or alcohol abuse, and iron deficiency anemia were excluded. Perinatal iron supplementation was continued by all the participants based on a national policy, and all women received an equal dosage (50 mg of elemental iron per day) after the fourth month of pregnancy.
Prepregnant weight was used to calculate body mass index (BMI, weight in kilograms divided by the square of height in meters). Blood pressure was measured with the subject seated using a random zero sphygmomanometer. Blood pressure was measured twice on the left upper arm, and the average of the two measurements was used for analysis.
A two-step approach was applied to diagnose GDM. All the women were initially screened by the glucose challenge test with 50 g glucose at 24–28 weeks of gestation. A three-hour oral glucose tolerance test was performed for women with plasma glucose concentrations exceeding 130 mg/ dL on a glucose challenge test. Carpenter/Coustan diag-nostic criteria were used to interpret oral glucose tolerance
test results.16 The fasting plasma glucose concentration of the diagnosing oral glucose tolerance test was used as the mid-pregnancy fasting plasma glucose in this study.
Blood samples of the participants were collected at 24–28 weeks of pregnancy after at least 12 hours of fast-ing. Plasma glucose was measured by the glucose peroxi-dase colorimetric enzymatic method, with a sensitivity of 5 mg/dL. Glycosylated hemoglobin (HbA1c) (normal range 4.8%–6.2%) was measured by ion exchange chromatography with DS5. Complete blood count was performed for all the participants using a hematologic analyzer (Sysmex, KX-21, Toa Co, Japan). C-reactive protein was measured by a high-sensitivity assay, with the use of the latex particle-enhanced immunoturbidimetric assay, with an analytical sensitivity of 0.175 mg/dL and an upper limit of normal of 5 mg/dL. Serum ferritin was measured by a [I125] coated-tube immu-noradiometric assay (Kavoshyar Co, Tehran). The assay was performed in duplicate. The interassay coefficients of variation ranged from 2% to 4%. Electrochemiluminescence immunoassay was used to detect serum insulin concentrations (Elecsys kit, Roche Diagnostics, Germany). The sensitivity of the assay was 1.3 pmol/L.
All the participants were followed until delivery, and their pregnancy outcomes were recorded. All subjects with rupture of membranes prior to 37 weeks’ gestation were considered to have preterm premature rupture of membranes. Preterm labor was defined as the presence of uterine contractions of sufficient frequency and intensity to affect progressive effacement and dila-tion of the cervix prior to term gestadila-tion (20–37 weeks). Dystocia was considered in subjects with difficult parturition to the point of needing human intervention due to large fetal size.
In women with GDM an additional two-hour oral glucose tolerance test with 75 g of glucose was performed eight weeks after delivery. The oral glucose tolerance test results were interpreted based on World Health Organization criteria.
Approval was obtained from the ethics committee of Zanjan University of Medical Sciences. All the participants were notified about the goals of the study, and informed consent was obtained.
Statistical analysis
Data are presented as mean ± standard deviation. Proportions were compared using the Chi-square test. Group means were compared using the Student’s t-test and analysis of variance (ANOVA). The Mann-Whitney test was used for variables with-out a normal distribution. We also used log transformation for the variables without normal distribution, like ferritin and C-reactive protein. The Pearson correlation statistic was used to examine
Diabetes, Metabolic Syndrome and Obesity: Targets and Therapy downloaded from https://www.dovepress.com/ by 118.70.13.36 on 21-Aug-2020
Dovepress Ferritin in gestational diabetes mellitus
the relationship between elevated serum ferritin and BMI. An odds ratio (OR) was calculated to compare the risk of GDM in people with higher ferritin levels. The conditional logistic regression analyses were performed to determine the influence of elevated serum ferritin on the risk of GDM and pregnancy morbidities. For independent variables, a change of 10 mmHg in blood pressure, 1 mg/dL of C-reactive protein, 1 µIU/L of insu-lin, more than the 95th percentile of serum ferritin for normal pregnant women, and changes in BMI were considered in the analysis. BMI was categorized as normal, overweight, and obese in the analysis. In addition, a stepwise multiple linear regression analysis was performed, with the two-hour blood glucose after glucose load acting as the dependent variable. A significance of P , 0.05 was used for all statistical tests.
Results
Ferritin and risk of gDM
The baseline characteristics of participants with and without GDM are shown in Table 1. Serum ferritin concentration
Table 1 Baseline clinical characteristics, biochemical indices, gDM risk factors and pregnancy complications of pregnant women with gDM and their control group (n = 128)
Variables (mean ± SD) GDM subjects (n = 64) Control subjects (n = 64) P value
Age (year) 30 ± 4.7 30 ± 4.9 0.8
Weight (kg) 75 ± 8 67.6 ± 9.9 0.00
BMi (kg/m2) 30.2 ± 3.2 27 ± 3.9 0.06
Systolic BP (mmhg) 111.7 ± 16 106.7 ± 11.9 0.06
Diastolic BP (mmhg) 72.8 ± 11.4 67.7 ± 9.1 0.01
gravidity 2.8 ± 1 2.5 ± 0.9 0.9
Parity 1.2 ± 0.6 1.3 ± 0.8 0.4
hb (g/dL)* 128 ± 8 125 ± 5.8 0.9
Ferritin (pmol/L)* 112.3 ± 28.4 65 ± 16.9 0.001
crP (mg/L)* 9.2 ± 1.7 7.3 ± 0.6 0.09
FPg (mmol/L)* 5.8 ± 0.18 4 ± 0.27 0.01
insulin (pmol/L)* 201 ± 111 347 ± 166 0.01
GDM risk factors (freq)
history of abortion 9 (14.1%) 4 (6.2%) 0.1
history of stillbirth 5 (7.8%) 1 (1.5%) 0.1
history of prior gDM 5 (7.8%) 0 (0%) 0.03
Family history of DM 30 (47%) 3 (4.6%) 0.001
Pregnancy morbidities (freq)
Pre-eclampsia and eclampsia 4 (6.7%) 0 0.1
hypertension 10 (16.7%) 0 0.001
PPrOM 2 (3.1%) 2 (3.1%) 0.6
Premature labor 5 (7.8%) 1 (1.5%) 0.1
Dystocia 3 (4.6%) 0 0.2
Abortion 1 (1.6) 0 0.3
LgA 13 (20.3) 0 0.00
LBW 0 0 1
cesarean section 45 (70.3%) 15 (23.4%) 0.00
Note: *All the measurements were performed at 24–28 weeks of pregnancy.
Abbreviations: BMi, body mass index; BP, blood pressure; hb, hemoglobin; FPg, fasting plasma glucose; gDM, gestational diabetes mellitus; DM, diabetes mellitus; PPrOM, preterm premature rupture of membrane; LgA, large for gestational age; crP, c-reactive protein; freq, frequency; LBW, low birth weight.
was significantly higher in pregnant women with GDM. Hemoglobin levels were not significantly different between the two groups. Linear relationships between serum ferritin with mid-pregnancy fasting plasma glucose (r = 0.241,
P = 0.01) and HbA1c were observed. A negative correlation between serum ferritin and fasting serum insulin concentra-tion was also determined (r =−0.332, P = 0.02). There was no significant correlation between serum ferritin and C-reactive protein levels.
A ferritin concentration of 84.7 pmol/L was calculated to be the 75th percentile for healthy pregnant women. Considering this level as the cutoff point to define high ferritin levels, 26 patients (65%) in the GDM group and 14 normal subjects (21.8%) exhibited high ferritin levels (P = 0.02). The risk of having GDM with these high levels of ferritin was calculated to be 2.3-fold higher than that for patients with lower ferritin concentrations (OR 2.3, 95% confidence interval [CI] 1.06–5.1). For women with a ferritin level above 186 pmol/L (95th percentile for healthy pregnant women),
Diabetes, Metabolic Syndrome and Obesity: Targets and Therapy downloaded from https://www.dovepress.com/ by 118.70.13.36 on 21-Aug-2020
Dovepress
Sharifi et al
the risk of having GDM was calculated to be 4.4-fold higher than the risk for those with lower concentrations of ferritin (OR 4.4, 95% CI 1.19–16.8). This risk estimation remained significantly positive but was moderately reduced after adjust-ment for C-reactive protein and other confounding variables like BMI, blood pressure, history of GDM, and family history of DM (OR 2.4, 95% CI 1.2–6.8).
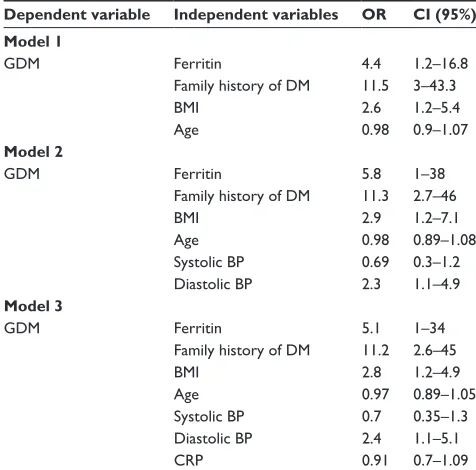
Logistic regression analyses were performed to determine the influence of elevated serum ferritin on the risk of GDM. Potential confounding variables, including age, familial history of DM, BMI, blood pressure, C-reactive protein, and insulin concentrations were included in multivariable models. The most potent prognostic variables in this model were family history of DM and serum ferritin concentrations (Table 2).
gDM risk factors
and pregnancy complications
Table 1 compares GDM cases with normal pregnant women for the frequency of some risk factors and pregnancy compli-cations. Obesity was more prevalent in the cases with GDM (22 subjects [39%] in the GDM group versus nine subjects [14%] in the control group, P = 0.002). Positive family history for DM, especially paternal history of DM, was significantly more prevalent in the GDM patients (31% of paternal DM versus 8% of history of maternal DM, P = 0.001).
A logistic regression analysis was used to determine the influence of elevated serum ferritin on the risk of pregnancy morbidities, including pre-eclampsia, preterm premature rupture of membranes, dystocia, and premature labor. Confounding variables including age, BMI, blood pressure, fasting plasma glucose, HbA1c, C-reactive protein, and insulin concentrations were included in the model. The only significant prognostic variable in this model was mid-pregnancy fasting plasma glucose concentrations (OR 3.1, 95% CI 1.9–18).
Ferritin and early postpartum
glucose tolerance
All the GDM subjects were evaluated eight weeks after delivery. Based on a standard oral glucose tolerance test with 75 g glucose, DM and impaired glucose tolerance were diagnosed in eight (12.5%) and 15 subjects (23.4%), respectively. A comparison between GDM patients who developed impaired glucose tolerance or DM and those who presented with a normal postpartum oral glucose tolerance test in terms of general characteristics, basal laboratory data, and pregnancy complications appears in Table 3. Although a significant difference was found in mid-pregnancy blood pressure and fasting plasma glu-cose between the two groups, no difference was found for blood glucose levels at hours 1, 2, or 3 after oral glucose loading at the time of diagnosis of GDM. Furthermore, the frequency of pregnancy complications was similar in both groups.
Stepwise linear regression analyses were performed to determine the relationship between elevated serum ferritin and two-hour plasma glucose in the postpartum oral glucose tolerance test. The postpartum two-hour plasma glucose concentration after a standard oral glucose tolerance test was considered to be the dependent variable. Potential confound-ing variables, includconfound-ing history of prior GDM, family history of DM, BMI, blood pressure, mid-pregnancy fasting plasma glucose, plasma glucose concentration at the first, second, and third hour after 100 g oral glucose load, C-reactive protein, and insulin concentration, were included in the model. There was no significant relationship between ferritin and two-hour plasma glucose concentration in the postpartum oral glucose tolerance test. We determined that only mid-pregnancy fast-ing plasma glucose (OR 1.05, 95% CI 1.01–1.1) and BMI (OR 1.4, 95% CI 1.2–4.7) were prognostic for postpartum two-hour plasma glucose concentration in the oral glucose tolerance test. Although a correlation between positive family history of DM and presence of hypertension during
Table 2 Logistic regression analyses of ferritin and other confounding variables to predict gDM in the pregnant women
Dependent variable Independent variables OR CI (95%) Model 1
gDM Ferritin 4.4 1.2–16.8
Family history of DM 11.5 3–43.3
BMi 2.6 1.2–5.4
Age 0.98 0.9–1.07
Model 2
gDM Ferritin 5.8 1–38
Family history of DM 11.3 2.7–46
BMi 2.9 1.2–7.1
Age 0.98 0.89–1.08
Systolic BP 0.69 0.3–1.2 Diastolic BP 2.3 1.1–4.9
Model 3
gDM Ferritin 5.1 1–34
Family history of DM 11.2 2.6–45
BMi 2.8 1.2–4.9
Age 0.97 0.89–1.05
Systolic BP 0.7 0.35–1.3
Diastolic BP 2.4 1.1–5.1
crP 0.91 0.7–1.09
Abbreviations: gDM, gestational diabetes mellitus; DM, diabetes mellitus; BMi, body mass index; BP, blood pressure; crP, c-reactive protein; Or, odds ratio; ci, confidence interval.
Diabetes, Metabolic Syndrome and Obesity: Targets and Therapy downloaded from https://www.dovepress.com/ by 118.70.13.36 on 21-Aug-2020
Dovepress Ferritin in gestational diabetes mellitus
Table 3 comparison of basal clinical characteristics, biochemical indices, past history, and pregnancy complications between two groups of women with gDM based on their postpartum OgTT results (n = 64)
Variables (mean ± SD) Impaired glucose tolerance or DM (n = 23) Normal glucose tolerance (n = 41) P
Age (years) 30.3 ± 1.1 30.4 ± 0.7 0.9
BMi (kg/m2) 31.3 ± 0.5 29.6 ± 0.5 0.06
Systolic BP (mmhg) 118 ± 40 107.7 ± 21 0.01
Diastolic BP (mmhg) 77 ± 25 70 ± 17 0.03
hb (g/dL) 129 ± 2.3 128 ± 1.8 0.8
Ferritin (pmol/L) 107.8 ± 22 115.9 ± 24.7 0.8
crP (mg/L) 9.5 ± 1.5 8.9 ± 1.9 0.09
FPg (mmol/L) 6.1 ± 0.2 5 ± 0.17 0.00
insulin (pmol/L) 234 ± 122 182 ± 99 0.06
1-hour BS in gTT (mmol/L) 10.8 ± 0.76 9.6 ± 0.3 0.08
2-hour BS in gTT (mmol/L) 10.8 ± 0.85 9.8 ± 0.58 0.3
3-hour BS in gTT (mmol/L) 9.4 ± 1.2 7.8 ± 0.3 0.3
hbA1c (%) 5.16 ± 0.19 5.1 ± 0.16 0.8
GDM risk factors (freq)
history of abortion 4 (17.3) 5 (12) 0.9
history of stillbirth 2 (8.7) 3 (7.3) 0.6
history of prior gDM 4 (17.3) 1 (2.4) 0.06
Family history of DM 16 (69.5) 14 (34) 0.08
Pregnancy morbidity (freq)
Pre-eclampsia and eclampsia 4 (17.3) 0 0.06
hypertension 4 (17.3) 2 (4.8) 0.1
PPrOM 1 (4.3) 1 (2.4) 0.6
Premature labor 3 (13) 2 (4.8) 0.2
Dystocia 3 (13) 0 0.052
LgA 8 (34.7) 6 (14.6) 0.04
cesarean section 18 (78.3) 27 (65.9) 0.2
Abbreviations: BMi, body mass index; BP, blood pressure; hb, hemoglobin; FPg, fasting plasma glucose; crP, c-reactive protein; 1-hour BS, blood sugar one hour post-OgTT in mid-pregnancy; 2-hour BS, blood sugar two hours post-OgTT; 3-hour BS, blood sugar three hours post-OgTT; OgTT, oral glucose tolerance test; gDM, gestational diabetes mellitus; DM, diabetes mellitus; PPrOM, preterm premature rupture of membrane; LgA, large for gestational age.
pregnancy with postpartum two-hour glucose concentration was observed, this correlation was modified and lost signifi-cance after adjusting for BMI.
Discussion
We found a significant association between serum ferritin levels and GDM that was independent of BMI and C-reactive protein. However, no association of serum ferritin levels with pregnancy morbidities or postpartum glucose concentration in the oral glucose tolerance test was found.
Other studies has revealed that higher ferritin levels raise the risk of DM3,4 and prediabetic conditions.5 Whether this association is independent of BMI is not clear.1,2,14,17 Few data regarding the correlation of ferritin levels and body fat during pregnancy have been reported. In spite of reports from China that revealed no correlation between ferritin levels and BMI in pregnant Chinese women,11 a report from the US demonstrated a significant correlation.12 In the current study, ferritin level was an independent prognostic factor for GDM and was highly correlated with glycemic control.
Women with GDM are characterized by relatively diminished insulin secretion, coupled with pregnancy-induced insulin resistance, primarily in skeletal muscle tissue.7 In the current study, it is interesting that the fasting serum insulin concentration was significantly lower in the GDM group than that in the non-GDM group (201 ± 111 versus 347 ± 166 pmol/L). Although a lower insulin level was not an independent risk factor for developing GDM in this study, this finding implies that insulin secretion might be decreased in the GDM group. There have been similar reports stating that β-cell function is decreased in patients with GDM.18,19
It is not clear how ferritin is related to insulin deficiency or to insulin resistance. Ferritin has been identified as a marker of inflammation, and pregnancy is considered an inflamma-tory state. Whether or not elevated serum ferritin in GDM is a consequence of inflammation is not clear. Although it would be of interest to assess levels of ferritin at different time points of pregnancy, we could not do that because of difficult accessing the same subjects on several occasions. However,
Diabetes, Metabolic Syndrome and Obesity: Targets and Therapy downloaded from https://www.dovepress.com/ by 118.70.13.36 on 21-Aug-2020
Dovepress
Sharifi et al
with the case-control design used in our study, the effect of the inflammatory state of pregnancy on ferritin levels has been removed. Similar to a previous study,12 we did not find a posi-tive correlation between C-reacposi-tive protein (an inflammation marker) and ferritin. On the other hand, although the role of ferritin as a potent indicator of GDM was confirmed in this study, C-reactive protein was not able to be determined to be an independent risk factor for development of GDM.
Jiang et al20 found that high serum ferritin and C-reactive protein levels are independent risk factors for type 2 diabetes. These data are inconsistent with the role of inflammation in raising ferritin levels in GDM and other insulin-resistant states.
Ferritin can reflect body iron stores. Higher iron stores can be associated with insulin resistance in nonpregnant subjects.17,20 Lao et al found that higher hemoglobin (.13 g/dL) was an independent risk for GDM21 and that iron deficiency anemia is associated with a lower risk of GDM.22 Like a previous report,12 our results revealed no correlation between ferritin and hemoglobin concentrations. Further-more, no difference in hemoglobin concentrations was found between women with GDM and the control group. Although these findings do not support the hypothesis that higher serum ferritin levels reflect excess iron stores in patients with GDM, we cannot rule out subclinical manifestations of iron overload in GDM. One limitation of our study is that we did not measure serum iron or serum transferrin concentra-tions, which would have helped us to interpret the role of serum ferritin as a marker of iron overload during pregnancy. Minimal iron excess that does not have a significant effect on the hemoglobin concentration may affect insulin action or insulin secretion at the cellular level.2 Recently, a genetic susceptibility to iron overload in GDM was suggested.23
GDM was a potent risk factor for subsequent development of DM, increasing the risk of DM by 12.5%. Mid-pregnancy fasting plasma glucose (and not postoral glucose tolerance test blood sugars) and BMI were the strongest prognostic factors for early postpartum impaired glucose tolerance or DM. Ferri-tin was not correlated with blood glucose levels after delivery. Lack of a correlation between ferritin and postpartum glucose tolerance test results may be due to the relatively small sample size. On the other hand, an oral glucose tolerance test was per-formed eight weeks after delivery, which may have been too early to find an association between ferritin level and glucose intolerance. Furthermore, a family history of DM and history of prior GDM were proven not to be independent predictors of postpartum DM. Although these data are consistent with those reported by Huidobro,24 there are reports of high postpartum
oral glucose tolerance test plasma glucose levels that predict future DM.25,26 We could not find any study on ferritin as a risk factor for postpartum diabetes. This is the first report in this field that demonstrates the lack of any relationship between ferritin levels at the time of diagnosis of GDM and early postpartum oral glucose tolerance test results.
In conclusion, we found that the serum ferritin level is highly associated with GDM independently of BMI and C-reactive protein, the mid-pregnancy ferritin level is not a prognostic factor for pregnancy morbidity or subsequent impaired glucose tolerance after delivery, and fasting plasma glucose values at the time of diagnosis of GDM are the most important prognostic factors for glucose concentration in an early postpartum oral glucose tolerance test.
Acknowledgments
This study was supported by the Zanjan University of Medical Sciences. We are grateful to Dr Sheikholeslami, Dr Najmi, and the laboratory staff of the primary health care units in Zanjan for their assistance in this research.
Disclosure
All authors disclose no relevant conflicts of interest in this work.
References
1. Ramakrishnan U, Kuklina E, Stein AD. Iron stores and cardiovascular disease risk factors in women of reproductive age in the United States.
Am J Clin Nutr. 2002;76:1256–1260.
2. Fernandez-Real JM, Lopez-Bermejo A, Ricart W. Cross-talk between iron metabolism and diabetes. Diabetes. 2002;51:2348–2354. 3. Fernandez-Real JM, Ricart-Engel W, Casamitjana-Abella R, et al.
Serum ferritin as a component of the insulin resistance syndrome.
Diabetes Care. 1998;21:62–68.
4. Sharifi F, Sazandeh SH. Serum ferritin in type 2 diabetes mellitus and its relationship with HbA1c. Acta Medical Iranica. 2004;42:142–145. 5. Sharifi F, Mousavinasab SN, Jazebizadeh H. Elevated serum ferritin
concentrations in prediabetic subjects. Diab Vasc Dis Res. 2008; 5:15–18.
6. Clark CM, Qiu C, Amerman B, et al. Gestational diabetes: Should it be added to the syndrome of insulin resistance? Diabetes Care. 1997; 20:867–871.
7. Damm P. Gestational diabetes mellitus and subsequent development of overt diabetes mellitus. Dan Med Bull. 1998;45:495–509.
8. Wolf M, Sandler L, Hsu K, Vossen-Smirnakis K, Ecker JL, Thadhani R. First-trimester C-reactive protein and subsequent gestational diabetes.
Diabetes Care. 2003;26:819–824.
9. Qiu C, Sorensen TK, Luthy DA, Williams MA. A prospective study of maternal serum C-reactive protein (CRP) concentrations and risk of gestational diabetes mellitus. Paediatr Perinatal Epidemiol. 2004; 18:377–384.
10. Ferrannini E. Insulin resistance, iron, and the liver. Lancet. 2000; 355:2181–2182.
11. Lao TT, Chan PL, Tam KF. Gestational diabetes mellitus in the last trimester – a feature of maternal iron excess? Diabet Med. 2001; 18:218–223. 12. Chen X, Scholl TO, Stein TP. Association of elevated serum ferritin
levels and the risk of gestational diabetes mellitus in pregnant women: The Camden study. Diabetes Care. 2006;29:1077–1082.
Diabetes, Metabolic Syndrome and Obesity: Targets and Therapy downloaded from https://www.dovepress.com/ by 118.70.13.36 on 21-Aug-2020
Diabetes, Metabolic Syndrome and Obesity: Targets and Therapy
Publish your work in this journal
Submit your manuscript here: http://www.dovepress.com/diabetes-metabolic-syndrome-and-obesity-targets-and-therapy-journal
Diabetes, Metabolic Syndrome and Obesity: Targets and Therapy is an international, peer-reviewed open-access journal committed to the rapid publication of the latest laboratory and clinical findings in the fields of diabetes, metabolic syndrome and obesity research. Original research, review, case reports, hypothesis formation, expert
opinion and commentaries are all considered for publication. The manuscript management system is completely online and includes a very quick and fair peer-review system, which is all easy to use. Visit http://www.dovepress.com/testimonials.php to read real quotes from published authors.
Dovepress
Dovepress
Ferritin in gestational diabetes mellitus
13. Lao TT, Tam KF. Maternal serum ferritin and gestational impaired glucose tolerance. Diabetes Care. 1997;20:1368–1369.
14. Williams MJA, Poulton R, Williams S. Relationship of serum ferritin with cardiovascular risk factors and inflammation in young men and women. Atherosclerosis. 2002;165:179–184.
15. American Diabetes Association: Gestational diabetes mellitus. Diabetes Care. 2000;23 Supp1 1:S77–S79.
16. Knuiman MW, Divitini ML, Olynyk JK, Cullen DJ, Bartholomew HC. Serum ferritin and cardiovascular disease: A 17-year follow-up study in Busselton, Western Australia. Am J Epidemiol. 2003;158:144–149. 17. Wilson JG, Lindquist JH, Grambow SC, Crook ED, Maher JF.
Potential role of increased iron stores in diabetes. Am J Med Sci. 2003; 325:332–339.
18. Metzger BE, Cho NH, Roston SM, Radvany R. Prepregnancy weight and antepartum insulin secretion predict glucose tolerance five years after gestational diabetes mellitus. Diabetes Care. 1993;16:1598–1605. 19. Xiang AH, Peters RK, Trigo E, Kjos SL, Lee WP, Buchanan TA.
Multiple metabolic defects during late pregnancy in women at high risk for type 2 diabetes. Diabetes. 1999;48:848–854.
20. Jiang R, Manson JE, Meigs JB, Ma J, Rifai N, Hu FB. Body iron stores in relation to risk of type 2 diabetes in apparently healthy women.
JAMA. 2004;291:711–717.
21. Lao TT, Chan LY, Tam KF, Ho LF. Maternal hemoglobin and risk of gestational diabetes mellitus in Chinese women. Obstet Gynecol. 2002; 99:807–812.
22. Lao TT, Ho LF. Impact of iron deficiency anemia on prevalence of gestational diabetes mellitus. Diabetes Care. 2004;27:650–656. 23. Cauza E, Hanusch-Enserer U, Bischof M, et al. Increased C282Y
heterozy-gosity in gestational diabetes. Fetal Diagn Ther. 2005;20:349–354. 24. Huidobro A, Prentice A, Fulford T, Parodi C, Rozowski J. Gestational
diabetes, comparison of women diagnosed in second and third trimes-ter of pregnancy with non GDM women: Analysis of a cohort study.
Rev Med Chil. 2010;138:316–321.
25. Retnakaran R, Qi Y, Sermer M, Connelly PW, Hanley AJ, Zinman B. Glucose intolerance in pregnancy and future risk of pre-diabetes or diabetes. Diabetes Care. 2008;31:2026–2031.
26. Retnakaran R, Qi Y, Sermer M, Connelly PW, Hanley AJ, Zinman B. The antepartum glucose values that predict neonatal macrosomia differ from those that predict postpartum pre-diabetes or diabetes: Implications for the diagnostic criteria for gestational diabetes. J Clin Endocrinol
Metab. 2009;94:840–845.
Diabetes, Metabolic Syndrome and Obesity: Targets and Therapy downloaded from https://www.dovepress.com/ by 118.70.13.36 on 21-Aug-2020