A Quantitative Method for the Description
and Classif ication of Range Vegetation’
CHARLES E. POULTON AND E. W. TISDALEZ Professors of Range Management, Oregon State College and University of Idaho, respectively
Infroducfion
Numerous contributions by
ecologists of an earlier period as well as those of our contempo- raries have enhanced the under- standing of range vegetation, but few of these studies have pro- vided the detail which is desir- able for the evaluation of site
potential in modern manage-
ment. The notion appears still prevalent that the comparatively
low production of range lands
makes detailed attention to their
ecology uneconomic. This atti-
tude fosters the study of com-
plexes rather than the basic
units, or individual ecosystems (Tansley, 1935) that comprise them. Data thus assembled are
confounded by unrecognized site
differences and defy understand- ing from the outset, particularly
in regard to interpretation of
plant succession or range condi-
tion and trend (Hanson, 1950;
Dyksterhuis, 1958).
Growing awareness of the
need for a more detailed and
clearer understanding of the
range resource makes it impor- tant that we consider how ecol- ogy can contribute to the devel-
opment of improved guides for
the evaluation of range sites re- gardless of current condition. In spite of the amount of work di- rected at the problem of range site quality and its component
factors, general agreement has
not been reached on such ques- tions as: how best to gain an un- derstanding of site, what kinds of information are required, how much emphasis should be placed on vegetation and how much on soils and climate. Granted dif- ferences in intensity and details
of study, it would seem that
f
sound application of ecological
principles should result in an
overall approach of broad appli- cation and usefulness.
Such ecological understanding is essential if we aim to. judge the potential and limitations of range lands and to classify them
for management and improve-
ment purposes. This is particu- larly true in areas of variable
topography and soils such as
characterize much of the west- ern range. Under these condi- tions valid extrapolation of re- sults from one area to another becomes more difficult than on
comparatively uniform areas.
Even on areas of apparent uni- formity, unrecognized diversity frequently exists and creates a
danger of “lumping” vegeta-
tional units that are different.
Until individual ecosystems are
recognized in research and in
management, ecology will not
make its potential contribution
to practical resource manage-
ment.
It is the purpose of this paper to present a research approach
which has proved satisfactory
for developing an understanding of range sites and hence for clas- sifying range lands. This method seeks to define the basic units of vegetation and to determine their relation to soils and other factors of the environment. The advantages of a combined study
of vegetation and soils are
stressed. Work of the authors in
the sagebrush-grass region of
Oregon and Idaho is used as the basis for the discussion.3 Pre-
liminary results from this in-
vestigation suggest the kinds of
information needed to classify
non-arable lands and to differ-
13
ment and appraisal purposes. Review of Liferafure
Early ecological research in
the western United States em-
phasized the recognition of
major vegetational types. The
sagebrush-grass community was
separated by vegetational and in some cases by gross soil charac- teristics from the bunchgrass and salt-desert shrub types (Weaver, 1917; Clements, 1920; Shantz and Zon, 1924). As in the case of many other major communities,
subsequent investigations have
not yet provided an adequate
analysis of the various units evi- dent in this extensive complex- to say nothing of explanations
for their existence (Billings,
1951).
Most of the early studies were either non-quantitative or lacked
adequate geographical scope to
enable correlation of data from area to area within the region. During this early period much attention centered on the value of individual plant species as in- dicators of land potential and use (Shantz, 1911; Kearney, et al., 1914; Clements, 1920; Kelley,
ITechnical Paper No. 1287 of the 0 r e go n Agricultural Experiment Station.
2The authors are indebted to many persons for help in the development and. use of the approach and meth- ods described. Particular thanks are due to R. E. Eckert of the Agri- cultural Research Service and to M. A. Fosberg and M. Hironaka of the University of Idaho who were directly involved in the develop- ment and refinement of the meth- ods, to L. D. Calvin of Oregon State College for statistical guidance and help in the early development stages and to R. Daubenmire of Washington State University and D. N. Hyder of the Agricultural Re- search Service for review and val- uable criticism of the manuscript. 3The specific project in which this
1922; Aldous and Shantz, 1924; Shantz and Piemeisel, 1924).
Continuing interest in the re-
lation between vegetation and
site factors is evident in numer- ous, more recent studies. Some of these were concerned with the relationships between vegetation
zones and great soil groups
(Dunnewald, 1930; Thorp, 1931;
Martin and Fletcher, 1943; Spils- bury and Tisdale, 1944). These studies served to focus interest on vegetation-soil relationships and to utilize knowledge of soil development and profile charac- teristics. Increased impetus was given this approach as more soil
scientists became interested
(Gardner and Retzer, 1949;
Olson, 1952; Wieslander and
Storie, 1952). More detailed stu- dies of regional vegetation have been reported by a number of
workers (Daubenmire, 1942; Tis-
dale, 1947; Billings, 1949). These studies considered both seral and
permanent vegetation and pro-
vided more knowledge concern-
ing the plant communities.
Other research has been con- cerned with the correlation be- tween individual or small groups of soil factors and plant species
or communities in attempts to
clarify the sit.e concept. A pio- neer study in this field was that
of Hanson and Whitman (1938)
on grassland vegetation in North
Dakota. Other studies of this
general type include those of
Billings (1950) ; McMinn (1952) ; and Gates, et. al. (1956).
Progress in the combined
study of vegetation and soils has been made possible by the clari- fication of concepts for studying vegetation, reflecting in part the influence of European ecologists
(Hanson, 1950, and Becking,
1957). Equally important has
been the increased knowledge
available regarding the morphol- ogy, genesis, and composition of range soils. The combination of these two disciples in the inter- pretation of range site is illus- trated by the published work of
Anderson and Fly (1955) and
Anderson (1956). Increased
awareness of the values of con-
currently studying vegetation
and soils has set the stage for advancing the usefulness of ecol-
ogy in range improvement and
management.
Methods
The procedures adopted by the authors are designed to effect an
integrated vegetation-soil ap-
proach to the understanding of
range site. Basically this in-
volves a study of the individual
ecosystems comprising the veg-
etation and concomitant inter-
pretation of both vegetation and
soil. The interpretive unit is
taken as the habitat-type. It is the basic environment unit of the landscape for classification and management purposes. The hab- itat-type is an abstract unit that may be defined as the collective area which is capable of support-
ing the same relatively homo-
geneous climax plant association
(Daubenmire, 1952). Thus the
habitat-type denotes a specific
ecosystem-the fundamental
unit of effective environment or site. It is hypothesized, therefore,
that habitat-types may be ex-
pected to differ not only in their climax vegetation and soils, but also in their seral vegetations
which develop as a result of
management treatments or dis-
turbances such as grazing, fire, insects, artificial revegetation, etc.
The initial objective of this method is, therefore, to define
and characterize each habitat-
type of a given region in quanti- tative terms. The methodology used is guided by two major considerations. First, it is es- sential that the geographic varia- tion and patterns of the plant cover and soils be measured ade-
quately. This demands the in-
tensive study of many locations thus creating two major prob-
lems in research: (1) the re-
quirement of abnormally high
budgets for travel, and ’ (2) the balancing of precision of indi- vidual measurements against the need for an adequate sample in terms of numbers of stands ex-
amined. Secondly, the methods
used must attempt to sample es- sentially all features of the veg- etation and soil since, at the out- set, it is impossible to predict relevant or limiting factors or to identify correctly all diagnostic characteristics of each habitat- type.
A combination of methods was developed which appears to pro- vide an adequate sample at each location and which is sufficiently rapid to enable the study of
many stands. In the soils in-
vestigation, the approach in-
volves a detailed study and de- scription of the profile at each site and collection of adequate samples for laboratory analyses. These two areas of investigation, vegetation and soils, have been
worked into a systematic pro-
cedure for the description and
classification of habitat-types in range areas. These procedures consist of the following essential steps.
Reconnaissance
Make a thorough reconnais-
sance of the general area se- lected for study to obtain a pre- liminary idea of the nature and variability of the vegetation and soils. The area included in one study can be of any size, but preferably it should be fairly ex- tensive so that the full range of variation in the vegetation and soils typical of the ecological re- gion may be encountered. In the
course of the reconnaissance,
preliminary information is
sought regarding the kinds of
permanent vegetation present in the area and the seral communi-
F--- 30 FEI
1: 2 II 109 8 7 6 5 4 3
!
REFERENCE CORNEW Fl
f
ties which may have been pro-
duced by such influences as
heavy grazing, fire, or insect epidemics. Advantages are real- ized in gathering this informa- tion by systematic note-taking.
Marginal-punch, hand-sort cards
with spaces provided for perti-
nent vegetation and soils data
have been used by the authors
with considerable success. The
use of these cards facilitates ref- erence to the data and greatly
speeds summarization and com-
parison, particularly when the
data have been obtained over an extensive area during a period of several years.
I i,j,
ORIGIN
7
E
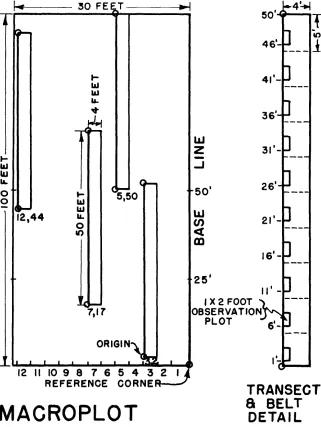
MACROPLOT
FIGURE 2. The macroplot and its subsampling design.
w
z
3
25’
JX2FOOT DBSERVATIO
PLOT
46’- ---.
36’- _--.
3l’- -w-s
26’- B-w
21’- ---.
16’0 ---.
TRANSECT
8 BELT
Quantitative Study Selection of Sfudy Loclafions Selection of relatively undis- turbed sites for intensive study is the next major step. It devel-
ops naturally from the recon-
naissance phase which yields hy- potheses as to the habitat-types comprising the study area. This selection of study locations is subjective to a considerable ex- tent; and it involves the biases as well as the training, experi- ence, and judgment of the work- ers involved. The objective is to sample the natural units of the vegetation as they have devel-
oped through evolution, plant
migration, succession, and com-
petitive sorting of the species. The approach adopted by the au- thors has been to set up a few readily observable criteria based
upon the reconnaissance data
and to consider all locations
which satisfy these criteria-re- gardless of how suitable they in-
itially may seem for detailed
study. In the sagebrush-grass re- gion, the authors have followed the hypothesis that the perma- nent vegetation of the area con- sisted of an overstory of shrubs, usually species of Artemisia, and
a moderately dense understory
of perennial herbs, chiefly
grasses. Any area meeting these simple criteria must be consid- ered as a possible study location. Rejection of a stand for intensive study must be based on lack of
sufficient area for adequate
sampling or on some abnormal- ity of vegetation or soil (usually
related to disturbance) which
can be substantiated from the
reconnaissance data. Even where potential study locations are re- jected, the reconnaissance notes for them are retained and sum-
marized. Such sites may later
prove valuable in the study of succession or because of the light they throw on the effect of spe- cific factors in the ecosystem.
They are not uncommonly
picked up later for intensive
study as a better understanding
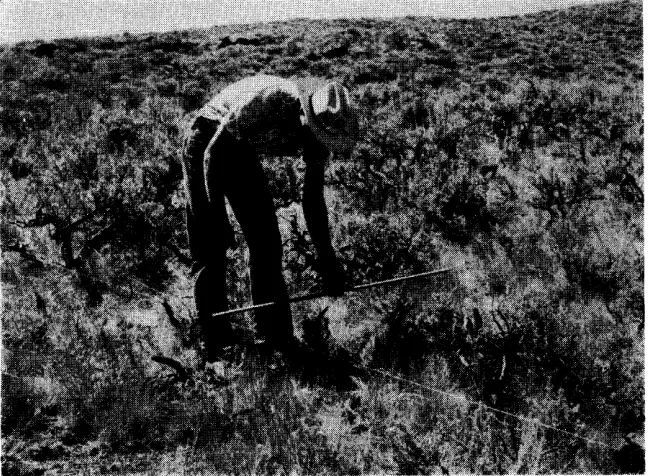
FIGURE 3. Determining shrub density on the four-foot belt transect.
of the vegetation is developed. If numerous stands represent- ing essentially equivalent, per- manent vegetation are available, selection of study sites could be
by random drawing. Relatively
uniform geographical distribu-
tion of study sites over a region is also an important factor to be considered, and thus restricted
randominzation may be desir-
able. In the experience of the authors, it is usually feasible to study virtually all available stands of near-climax sagebrush- grass vegetation. In these stu- dies, five stands represent the minimum group used to describe and characterize a habitat-type; and it is usually found that little
new information is discovered
by studying more than ten sam- ples of each.
Each location is examined
carefully for homogeneity of
vegetation-based on species
composition, relative dominance, and vigor-and stratified if this
appears justified. Many stands
will not require stratification be- cause of the diversity of the veg- etation, but the investigator must continually watch for vege- tation patterns with in stands. The authors proceed on the hy-
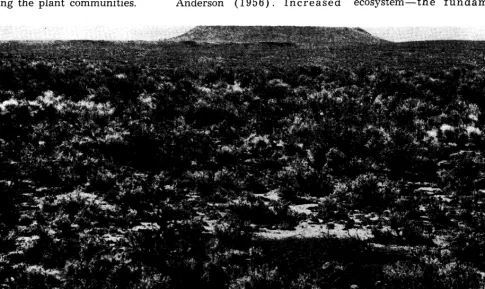
pothesis that if a repetitive veg- etation pattern can be seen in the species composition, relative dominance, or relative vigor, this pattern has causes which can be determined only if each variant is represented by its own sample. This is particularly true where the vegetation pattern coincides with observable soil and relief characteristics. Stratification is required in Figure 1, for ex- ample, because of consistent dif- ferences between the vegetation in the foreground and that in the background. The height and den- sity of big sagebrush (Artemisia trident&a) is sharply decreased in the foreground. The dominant grasses are bottlebrush sitanion (Situnion hystrix) and sandberg bluegrass (Pou secundu). In the
background, in contrast, blue
bunch wheat grass, (Agropyron
spicutum) and thurber needle-
grass, (Stipu thurberiunu) are
dominant beneath the taller
shrubs. The difference in the
foreground is interpreted as
being primarily due to a funda- mental site difference associated with the following obvious soil
characteristics: more bare
friable soil surface in the fore- ground. This stratification tech- nique, where applicable, defines the population to be sampled.
Vegetation Data
If a stand is stratified, a
sample plot is established in each of the subdivisions. Each vari- ant is sampled by a macroplot 50 by 100 feet in size, within which four 50-foot transects are located
in restricted random fashion.
Along these transects, 4-foot
belts and l- by 2-foot observation plots are located (Figure 2).
A list of all identifiable spe- cies is prepared for the macro- plot to provide constancy data. Plants whose identification is in doubt are given a number and collected for future study. Dif- ferences in the period of seasonal
development plus the ephemeral
nature of many spring-flowering species in sagebrush-grass vege- tation make it impossible to ob- tain a complete species list at any one time. At least two ob- servations are needed during one growing season.
The foliage intercept of shrub species is measured along each transect line marking the refer- ence side of the four-foot belt.
The density (number per unit
area) of shrub species is re-
corded by size classes for each
four-foot belt (Figure 3). The
mean maximum height of ma-
ture shrubs is determined as a site index by measuring the tall- est mature plant of each shrub
species in each five-foot com-
partment of the belt.
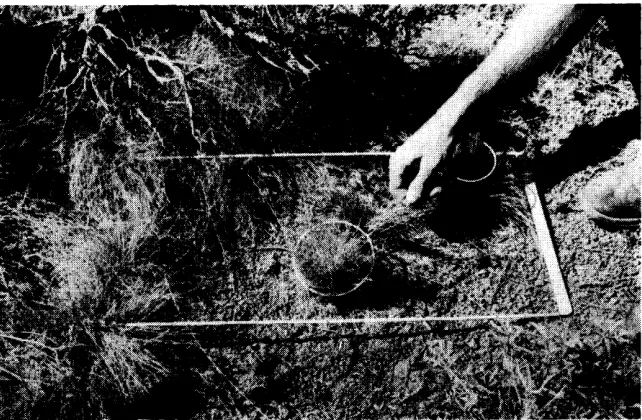
The basal area percent and fre- quency of all herbs are deter- mined on the l- by a-foot obser- vation plots (Figure 4). Data in percent basal area for all herba- ceous, vascular plants, percent
ground cover for mosses and
lichens, litter, stones and gravel, and percent bare ground are de- termined with the aid of esti- mate rings equivalent to two and five percent of the observation plot area. Basal area rather than foliage cover of the herbaceous
species was adopted as a stand- ard of measurement in order to
minimize year to year differ-
ences due to climatic variation
and/or grazing use and season
to season differences due to veg- etation growth. In certain cir-
cumstances a foliage area or
crown-spread cover method may
be satisfactorily used (Dauben- mire, 1959).
A set of “ground rules” must be prepared to insure uniformity
of estimate. For example, the
presence of lobes and discon-
tinuities in shrub crowns, irregu- larities in the bases of bunch- grasses, the special case of mat- formers, the basal area of rosette
plants, single-stemmed grasses
and annuals all require rules to insure consistency of estimate. Since these rules are determined largely by the characteristics of the plants themselves, the rules will vary with the vegetation being studied. Careful documen- tation of these rules is a basic requirement of this method.
Yield determinations are not
made as a part of the regular
sampling procedure. After the
ecological interpretation is made,
two or more representative ex-
amples of each habitat-type are
selected for a replicated plot
study of herbage yield. These
yield studies are designed to ex- tend over a period of at least five years to provide a measure of variability among years as well as among habitat-types.
Soils Data
The soil at each macroplot lo- cation is examined from pits and
described by genetic horizons
following standard procedures in the Soil Survey Manual (U. S. Dept. Agric., 1951). This exam- ination is made at an intensity sufficient to allow correlation of the soil at each macroplot loca- tion at Phase of Soil Type level. Following preliminary t e s t in g along the perimeter of the ma- croplot, one or more pits are dug at points just outside the macro- plot boundary. The soil descrip- tions are made or checked by
qualified soils personnel. A
sample from each soil horizon is also collected for laboratory analysis. Bulk density, perma-
nent wilting percentage, and
moisture equivalent are deter-
mined for representative profiles to enable calculation of impor- tant soil moisture characteristics for each habitat-type.
The procedure adopted for lab- oratory analysis is to make cer- tain determinations such as pH, salt content, organic matter, per
FIGURE 4. The area estimation.
cent nitrogen, and carbon: nitro- gen ratio on all sites. Additional chemical analyses, including ex- change capacity, base saturation percentage, and exchangeable ions, are made only for selected profiles, usually one or two from each habitat-type. Further chem- ical analyses are made only if their importance is suggested by the data from these selected sites.
Supplementary Data and Information
The location of each site is re- corded in detail and the general site denoted by a metal fence post or other prominent and fire proof marker. A designated cor- ner of the macroplot, the ends of each transect, and the loca- tion of the soil pits are also
marked with smaller metal
stakes to make possible re-sam- pling of the same area.
value in relation to specific sites or habitat-types unless related to
factors such as seasonal soil
moisture supply or effect of tem- perature on growth period. Soil
moisture and temperature data
collected throughout several sea-
sons on one example of each
habitat-type would constitute
important environmental infor-
mation now lacking-informa- tion possibly of greater value
than conventional climatic rec-
ords.
Information regarding the past history of the site is obtained wherever possible. Frequently it is possible to learn much about
the grazing history from the
owner or land administrator, but
information regarding fires and
disturbances other than those of recent date usually has to be de- duced largely from the vegeta- tion itself.
Photographs, both mono-
chrome and color, are taken of the general site and of details of
the vegetation and soil. All
photos are taken as photopoints with permanently ‘.marked loca- tions. One of the most useful types of photograph obtained to
illustrate the habitat-type has
been a color photograph showing the exposed soil profile and a sectional view of the vegetation immediately above it.
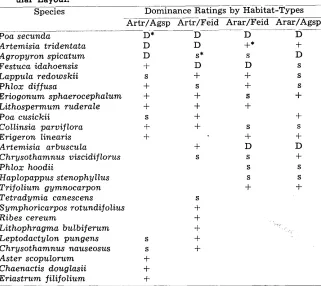
Table 1. A Simplified Example of a Species Association Table Adapted From Unpublished Oregon Data (Eckerf, 19571.1 Actual Dominance Data Are Not Used Because the Purpose Is Only fo Illusfrafe fhe Tab- ular Layout.
Species Dominance Ratings by Habitat-Types __________. Artr/Agsp Artr/Fsd Arar/Feid Arar/Agsp
The physiography and other
gross features of the habitat are
noted in detail according to
standard descriptive terms and
criteria. For example, the fol-
lowing observations have been
found useful: slope percent, di-
rection of slope, position on
slope, classification of land form and macro- and micro-relief, ele- vation, and nature of soil form- ing material.
Climatic data are obtained
where possible, but few weather records are available for stations
in or immediately adjacent to
areas of undisturbed sagebrush- grass vegetation. Interpolation of climatic data from sites even a few miles away is likely to lead to error in regions of complex
topography. Even where data on
precipitation and temperature are available, these have limited
Poa secunda
Artemisia tridentata Agropyron spicatum
Festuca idahoensis Lappula redowskii Phlox diffusa
Eriogonum sphaerocephalum Lithospermum ruderale Poa cusickii
Collinsia parviflora Erigeron linearis Artemisia arbuscula Chrysothamnus viscidiflorus Phlox hoodii
Haplopappus stenophyllus Trifolium gymnocarpon Tetradymia canescens S ymphoricarpos rotundifolius Ribes cereum
Lithophragma bulbiferum Leptodactylon pungens Chrysothamnus nauseosus Aster scopulorum
Chaenactis douglasii Eriastrum filifolium Footnote
*D=important, s=subordinate, +=&en present but very subordinate lunpublished Ph.D. thesis.
Time Requirements
The time required to sample vegetation and soils by the pro- cedures outlined varies with the
habitat-type and with the dis-
tance between study locations.
On the average, about three man days are required to complete the field work on one location and travel to the next if only one macroplot sample per loca- tion is involved. An efficient crew consists of an experienced staff member and one student
helper. Two such teams can
work together to advantage, es- pecially where one concentrates
on the vegetation sampling and
the other on soils. The total number of locations that can be sampled during a given season depends largely on the length of time during which the vegeta- tion remains green and in suit- able condition for study. In the
sagebrush-grass region this pe-
riod is usually limited to about
D* D D D
D D
S
S
D
S”
D
S
S
S
+* +
:
D
S
+ S
+ S
S +
S S
+ +
D D
S +
S S
S S
six weeks. Soil studies can be continued beyond this period if necessary, but there are definite advantages to making the study of vegetation and soils at the same time.
Interpretation of Data
Following compilation of the
field and laboratory results, the stand data are grouped on the basis of similarities in vegeta- tional, soil, and other character- istics. Effective analysis of this
kind of information requires a
logical sequence of steps in the development of association tables designed to show the similarities and differences in the vegetation of the stands sampled (Table 1).
These tables are developed by
arranging the species and the
data concerning them in groups of similar distribution and dom- inance. This ecological arrange- ment is the basis for interpreta- tion of the data and for showing the natural groupings with their similarities and differences. It is essential to consider all char- acteristics of the vegetation sampled in this tabular analysis
and interpretation. Mere pres-
ence of a given species in two groups of stands, for instance,
may have no significance; but
the fact that the frequency or basal area is consistently greater in one group of stands than in another may constitute the dif- ferentiating criterion. The prep- aration of these association tables is an essential, yet not in- frequently overlooked, first step in the analysis and interpretd- tion of community ecology data. These tables enable one to see the degree to which the mul- tiple-factor criteria of the ab- stract classification units are dis- tinct or tend to intergrade and thus to represent a continuum.
Following the vegetational in- terpretation, a somewhat similar
approach is used for the soil
characteristics. When the soils
interpretation is completed at
Series or Phase of Soil Type *
level, the soils and vegetation
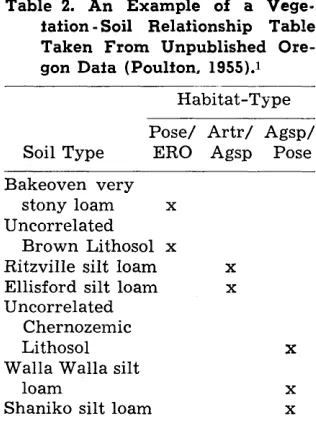
classifications are c a r e f u 11 y cross-checked by preparing vege-
tation/soils association tables
(Table 2) . Similarities and dif- ferences in tentative groupings are then re-examined in the light of both kinds of information to- gether with any accessory data available on climate, past his- tory, etc., which may throw light on the ecological interpretation.
Statistical analysis to deter- mine the reliability of the hy-
pothesized differences and sim-
ilarities among the descriptive c r i t e r i a of the habitat-types should follow the development This does not imply universal
and careful appraisal of the vari- coincidence of units of vegeta- tion and soil. Many contributing
ous association tables. Unfor-
reasons for disparity may be
identified: classification stand-
tunately,
ards for vegetation and soil may differ; the interpretation of the
many workers have
classification units of soil and/or
attempted to short-circuit this
vegetation may not sufficiently
approach their natural units;
step by jumping directly to bio- obscure vegetational differences
resulting from unrecognized or
uninterpretable successional
status may obscure the t r u e
vegetation-soil relationship; fac-
tor compensation may result in
apparently identical vegetation’s occurring on two or more tax- onomic soil units; or significant
vegetational differences m a y
occur on two soils which are not
readily distinguishable on the
basis of their morphology and
other obvious characteristics. In spite of these sources of “con- fusion” and uncertainty, the im-
portant consideration is that
when done concurrently the soils interpretation adds a major cri- terion to the vegetation interpre- tation and vice versa. When in- consistencies appear in the rela- tionships, the need for re-ex- amination of both vegetation and soils interpretations is indicated -often with mutually beneficial results.
Table 2. An Example of a Vege- tation -Soil Relafionship Table Taken From Unpublished Ore- gon Data (Poulfon, 1955).1
Habitat-Type
Soil Type
Pose/ Artr/ Agsp/
ERO Agsp Pose Bakeoven very
stony loam x Uncorrelated
Brown Lithosol x Ritzville silt loam X
Ellisford silt loam X
Uncorrelated Chernozemic
Lithosol X
Walla Walla silt
loam X
Shaniko silt loam X
1 Unpublished Ph.D. thesis.
metric and mathematical manip- ulation as though it were the key
Before investigations of this to, rather than a tool in, ecologi-
kind can be considered complete, cal interpretation. In the opinion and experience of the writers,
the interpretations should be
statistical tests are inappropriate up to this point. Until the as- sociation tables are developed,
checked in the field to see if they on_ does not know what one
will withstand objective re-ex-
should compare or what hy-
potheses to test-it is mere prob- ing in the dark. As a minimum,
amination. Actual use of the in- succeeding
formation in range resource in- statistical analysis should determine the degree of variability and central tenden-
ventory and in condition and
cies within groups of classifica- tion criteria. The confidence one
can have in differences amoq
trend appraisal is, of course, the
habitat-types should be deter-
mined as a check on the descrip-
best check against its validity. tive criteria isolated. In addition to the obvious characterization
can, however, be used as a field test of the validity of the ecologi- cal interpretations and hypothe- s i z e d vegetation-soil relation-
ships. The earlier data from
“potential study locations” as
well as from additional new
stands are often useful in this respect. An additional test of the
validity and usefulness of the
habitat-type concept is the ex- tent to which each can be recog- nized by others on a purely ob- servational basis using criteria
developed from the intensive
study. In the tests of this nature made to date by the authors, it has proved possible to recognize habitat-types not only in rela-
tively undisturbed areas, but
also to a considerable extent in
disturbed vegetation. F u 11 e r
recognition in disturbed areas
must, in some cases, await in- v e s t i g a t i 0 n of successional patterns in each habitat-type and further studies of vegetation-soil
relationships. Preliminary tests
indicate that these same meth-
ods, with modification, m a y
prove suitable for sampling seral vegetation.
As the interpretation of these
synecological studies is com-
pleted, they make a significant
and essential contribution to
autecology. The association table also provides the orientation for etiologic ecology through experi-
mentation by making possible
the recognition and statement of
hypotheses regarding the inter-
relationships among individual
species and between the species
and measurable characteristics
of its environment.
Associations a m o n g species
and between species-environ-
ment characteristics may be
tested biometrically from the
data available. Such attempts
(Gates, et al., 1956) are more likely to be successful where the
habitat-types have been previ-
ously and accurately determined.
Each habitat-type may be ex-
pected to differ not only in its climax vegetation and soils, but also in its reaction to various
treatments or disturbances such as grazing, fire, insects, artificial
revegetation, etc. Thus the
study of individual species-envi-
ronment relationships will tend
to be confounded if habitat-type differences a r e unrecognized. Species tend to have different ecologies, different phenotypic expression, in different environ-
ments. For example, the same
species may respond differently to the same kind of treatment on different habitat-types. Needle-
and-thread grass (Stipa comata
Trin. & Rupr.), for instance, is a major component of undisturbed vegetation in the big sagebrush/ needle and thread grass associa- tion on sandy soils in the Pacific Northwest; but it occupies a suc- cessional position in other habi- tat-types on finer soils, even
under similar climatic condi-
tions. In terms of grazing man- agement this species acts as a decreaser in a sandy-soil habitat- type and an increaser on finer- textured soil. Attempts to study its autecology or environmental requirements in the field with- out recognizing this habitat-type
difference would likely prove
futile.
The authors are convinced that research of the type outlined in this paper provides a way to tie
together the findings of plant
ecology and soil science and thus to obtain their full contribution towards a better understanding of the range resource-a degree of understanding ess tial to in-
tensive management. While de-
!
signed primarily fo non-for-
ested range lands, recent experi- ence has indicated that this ap- proach can prove equally useful on other types of non-arable lands and for ot er land manage- ment interests.
P
Numerous ecological studies
have shown that native vegeta- tion in a relatively undisturbed condition is an excellent index of land potential and a sound basis for classification of g r a z i n g
lands. More recently, soils in- vestigations have shown similar
value-especially when corre-
lated with intensive studies of
the vegetation to provide for
soils interpretation in land man- agement. Few studies are avail- able where a combined investi-
gation and interpretation of
vegetation and soils has been
made with sufficient intensity
and correlated over a sufficiently large area to define the individu- al ecosystems (habitat-types) on a combined vegetation and soils basis. Such natural units con- stitute the logical basis for range
management and improvement
and for the generalization of
other research results.
A method is described which consists of extensive reconnais- sance followed by i n t e n s i v e study of the vegetation and soils in numerous stands of relatively
undisturbed vegetation. Use is
made of a large macroplot sub- sampled by line and belt tran- sects and by small observation plots. The concomitant study of vegetation and soils is an essen- tial part of the procedure. The methods described appear to be sufficiently intensive to accom- plish the objective and to permit the sampling of a large number of stands. Analysis of the plant data in association tables and a
comparable treatment of
soils information enables
the the recognition of natural groupings among the stands. The reliabil-
ity of these groupings can be
tested by the degree of associ-
ation between plant and soil
data, by statistical analysis, and by application of the results in the field.
The method appears useful on non-arable lands in general, as well as for other multiple-use interests besides range manage- ment.
LITERATURE CITED
ALDOUS, A. E. AND H. L. SHANTZ.
ANDERSON, E. WILLIAM. 1956. Some soil-plant relationships in eastern Oregon. Jour. Range Mangt. 9: 171- 175.
ANDERSON! K. L. AND C. L. FLY. 1955. Vegetation-soils relationships in Flint Hills bluestem pastures. Jour. Range Mangt. 8: 163-169.
BECKING, R. W. 1957. The Zurich- Montpellier school of phytoso- ciology. Bot. Review 23: 411-488. BILLINGS, W. D. 1949. The shadscale
vegetation zone of Nevada and eastern California in relation to climate and soils. Am. Midl. Nat. 42: 87-109.
1950. Vegetation a n d plant growth as affected by chemically altered rocks in the western Great Basin. Ecol. 31:62- 74.
1951. Vegetation zonation in the great Basin of western North America. In: Les bases ecologiques de la regeneration de la vegetation des zones arides. Union Internationale des Sciences Biologiques Serie B. No. 9: 101-122. CLEMENTS, F. E. 1920. Plant indica-
tors, the relation of plant com- munities to process and practice. Carnegie Inst. Washington Publ. 290. 388 pp.
DAUBENMIRE, R. F. 1942. An ecologi- cal study of the vegetation of southeastern Washington and ad- pgcent Idaho. Ecol. Monog. 12: 53-
.
1952. Forest vegetation of northern Idaho and ad j ace n t Washington and its bearing on concepts of vegetation classifica- tion. Ecol. Monog. 22: 301-330.
1959. A canopy coverage
method of vegetational analysis. Northwest Sci. 33: 43-64.
DUNNEWALD, T. J. 1930. Grass and timber soils distribution in the Big Horn Mountains. Jour. Am. Sot. Agron. 22: 577-586.
DYKSTERHUIS, E. J. 1958. Ecological principles in range evolution. Bot. Rev. 24: 253-272.
GARDNER, R. A. AND J. L. RETZER. 1949. Interpretative soil classifica- tion: timber, range, and water- sheds. Soil Sci. 67: 151-157. GATES, D. H., L. A. STODDART, AND C.
W. COOK. 1956. Soil as a factor in- fluencing plant distribution on salt-deserts of Utah. Ecol. Monog. 26: 155-175.
HANSON, H. C. AND W. WHITMAN. 1938. Characteristics of m a j o r grassland types in western North Dakota. Ecol. Monog. 8: 57-114.
1950. E c o 1 o gy of the grassland. II. Bot. Rev. 16: 283-360. KEARNEY, T. H., L. J. BRIGGS, H. L. SHANTZ. J. W. MCLANE. AND R. L. PIEMEI~EL. 1914. Indicator signifi- cance of vegetation in Tooele Valley, Utah. Jour. Agric. Res. 1: 365-417.
KELLEY, A. P. 1922. Plant indicators of soil types. Soil Sci. 13:411-424. MARTIN, W. P. AND J. E. FLETCHER.
1943. Vertical zonation of great soil groups on Mt. Graham, Ari- zona. Univ. Ariz. Tech. Bull. 99. MCMINN, ROBERT G. 1952. The role
of soil drought in the distribution of vegetation in the northern Rocky Mountains. Ecol. 33: 1-15. OLSON, 0. C. 1952. The soil profile
as an aid to range management. Jour. Range Mangt. 5: 124-128.
SHANTZ, H. L. 1911. Natural vegeta- tion as an indicator of the capa- bilities of land for crop production in the Great Plains area. U.S.D.A. Bur. Plant Ind. Bull. 201.
AND R. L. PIEMEISEL. 1924. Indicator significance of the nat- ural vegetation of the south- western desert region. Jour. Agric. Res. 28: 721-801.
AND R. ZON. 1924. Natural vegetation, grassland and desert shrub. In: Atlas of Am. Agric. The physical basis of agriculture. U.S.D.A. 29 pp., illus.
SPILSBURY, R. H. AND E. W. TISDALE. 1944. Soil-plant relationships and vertical zonation in the southern interior of British Columbia. Sci. Agr. 24: 395-436.
TANSLEY, A. G. 1935. The use and abuse of vegetational concepts and terms. Ecol. 16: 284-307.
THORP, J. 1931. The effects of vegeta- tion and climate upon soil profiles northern and northwestern Wyoming. Soil Sci. 32: 283-297. TISDALE, E. W. 1947. The grasslands
of the southern interior of British Columbia. Ecol. 28: 346-382.
U. S. DEPT. AGRIC., SOIL SURVEY STAFF. 1951. Soil Survey Manual. U.S.D.A., Agric. Res. Adm. Hand- book Number 18. 503 pp.
WEAVER, J. E. 1917. A study of the vegetation of southeastern Wash- ington and adjacent Idaho. Univ. of Nebraska. The University Studies 17: 1-114.
WIESLANDER, A. E. AND R. E. STORIE. 1952. The vegetation soil survey in California and its use in the management of wild lands for yield of timber, forage, and water. Jour. Forestry 50: 521-526.
EDUCATION COUNCIL TO MEET
The Range Management Education Council will meet at the Newhouse
Hotel, Salt Lake City at 1 p.m. January 30, 1961. All educators and others
interested in range education are urged to attend.
INDEXES FOR SALE