Influence of Number and Spacing of
Points on Accuracy and Precision
of Basal Cover Estimates1
H. G. FISSER AND G. M. VAN DYNE2
Associate Professor, Plant Science Division, University of Wyoming, Laramie, and Ecologist, Radiation Ecology Section, Health Physics Division, Oak Ridge National Laboratory, Oak Ridge, Tennessee.
Highlight
Records from 350 line intercept transects from a foothill bunchgrass range were sampled systematically and at random with 25, 50, and 100 points per line. Statistical analyses were made fo compare point densi- ties, point placement. and their in- teractions for 12 plant categories. Sod-forming species were sampled besi by random placement. bunch- grasses by systematic placement, and for plant groups with high basal cover either placement would suffice.
Two common methods of basal
area or cover determination are
the line intercept technique
(Canfield, 1942) and the point-
analysis technique (Cockayne,
1926; Levy, 1927). The line inter-
cept technique generally is con-
sidered to give accurate results
and has been used as the stan-
dard for comparison in many
methodological studies, but it is
a time-consuming procedure.
Point analysis technique has fre- quently been used in range anal-
ysis but many factors includ-
ing number, size, and spacing of
points have influenced its suc-
cess.
IPublished with joint approval of the Director, Wyoming Agricul- tural Experiment Station, us Jour- nal Article No. 284, and of the Oak Ridge National Laboratory.
2Field work, conducted by the uu- thors, was supported by the Animal and Range Science Department, Montana AgricuZturuZ Experiment Station. Analyses and completion of the work were done in the uu- thors’ present positions and was supported in part by the U. S. Atomic Energy Commission under contract with the Union Carbide Corporation and by the Plant Sci- ence Division, University of Wyo- ming.
This paper reports a compari- son of point procedures for ana- lyzing basal cover of grassland. Records from 350 line intercept
transects were obtained from a
foot hill grassland. This popula-
tion was sampled both systemat- ically and randomly with 25, 50, and 100 points per 5-ft line.
Theoretical Aspects
Artificial Populations. - The
true values of vegetation basal
area or cover parameters are sel-
dom known in range investiga- tions. Although precision or re-
peatability of different proce-
dures is compared in field
studies, the validity or accur-
acy of vegetation sampling tech- niques usually cannot be estab- lished (Schultz et al., 1961). Ac- curacy and precision of different
techniques have been compared
by sampling artificial popula-
tions for which the values of the
parameters were known (Bauer,
1943; DeVries and DeBoer, 1959; Heady, 1961; McIntyre, 1953; and Schultz et al., 1961). It is diffi- cult, however, to construct arti-
ficial populations sufficiently
complex to simulate real life
variation in plant size, shape,
and distribution. These charac-
teristics must be considered
when investigating the relative
efficiency of vegetation esti-
mates (Aberdeen, 1958; Hoell,
1943).
Determination of sampling ac-
curacy and precision of any one method as related to another can
be facilitated by comparison of
data derived from actual field
procedures with measurements
205
et al., 1959). The obvious diffi-
culty of determining exact com-
parisons because of human bias
and error inherent with field
procedures limits the value of
subsequent inferences (Ellison,
1942). ~
If data derived by a standard
field procedure could be sam-
pled as a population by the
method under investigation, the
determination of relative effi-
ciency of the methods would not be subject to the errors associ-
ated with artificial populations,
or human bias and error. The
field data obtained for this paper
consisted of 350 line intercept
transects, each 5 ft in length.
This sample of an upland range
is here considered a population,
with known parameters, from
which various samples of point data were obtained.
Point Data From Intercepts.-
The derivation of point data
from intercept readings is de-
pendent upon the basic meth-
odological concepts of the two
methods. Both can be consid-
ered plot methods, but with cer-
tain limitations. A line intercep-
tion transect is essentially a lin-
ear quadrat with no breadth
while basal point contact analy- sis employs units of no area or, in another sense, plotless points (Brown, 1954).
Theoretically a line intercept
transect is composed of an infi- nite number of points. The in- ference of point data from inter- cept with this concept is impos-
sible. In practical application,
however, the point method, in
effect, actually measures small
circular plots with finite area.
The resulting bias is associated
with the variation from true
presence or absence data which
is theoretically expected from
the point method (Hyder et al.,
1963; Kershaw, 1964; p. 15; War-
ren-Wilson, 1959). The amount
of area actually measured has
Greig-Smith (1964, p. 43). He
indicates that the effective sam-
pled area, recorded by use of a
finite diameter pin, has a ra-
dius equal to that of the pin.
Goodall (1952) compared pin
diameters of 0, 1.84, and 4.75
mm when recording all hits in
dense multilayered grassland
vegetation. The largest pin gen-
erally overestimated cover more
than the next smaller size. He
expressed concern over the fact
that most workers were using
pins which usually resulted in
cover overestimation. Basal con-
tact hits were analyzed by Elli-
son (1942) and Whitman and
Siggeirsson (1952) on semi-arid
shortgrass vegetation. They did
not indicate pin diameters, but
their results were in general ac- cord with those of Goodall (1952) in that basal cover was overesti- mated by point analysis.
The O.Ol-ft units of the present
study, when converted to the
metric system, are 3.05 mm in
length but have no breadth as
associated with pins. Since the length of these units is less than the 4.75 mm diameter of the pins used by Goodall (1952) and since area is not a component as with
the usual circular pin, the O.Ol-
ft units with no breadth should more closely approach estimates
of the theoretical point of no di-
mension. However, since most
field work is conducted with
pins, analysis of the relationship of intercept data to that derived
from points should logically be
conducted under conditions of
common use. Data derived from a short linear plot closely ap- proaches that of a point. A con- tiguous series of the linear plots
can then be considered a series
of points with application to
general point analysis proce-
dures. With this conceptual basis
the line interception data of the
present study can be considered a series of contiguous point plots
from which individual units of
cover data may be selected for
analysis on the basis of general- ized point procedures. The close- ness to which any point-sam- pling result compares with the
population parameter then will
indicate the accuracy of that
particular point-sampling proce-
dure.
Population of Intercept Transects Field Measurements. - Line-
intercept data were collected
with a mechanical device (Fisser
and Van Dyne, 1960) from 350 transects located by a multistage
randomization procedure (Van
Dyne, 1960) on a foothill grass-
land in southwestern Montana
in 1958. Five transects were lo-
cated in each of 70 clusters on about 12,000 acres.
Intercepts along transects 5 ft
in length were noted at ground level with a pointed needle at- tached to a sliding mechanism
on an immovable horizontal bar
in which a steel tape, calibrated
in hundredths of feet, had been
imbedded. The data from each
transect thus consisted of 500
units. Unit distances along the
line were noted with the aid of a cross hair device on the slide. Each unit of intercept was iden- tified and recorded at the num-
ber of the intercept on a pre-
pared form. Every unit of inter- cept, from the zero end of the tape to the last unit, number 500, was in a definite known position along the line, and each unit was 0.01 ft in length but had no mea- surable breadth.
Ground level intercepts of all
individual plant species, litter,
fecal material, rock, erosion
pavement, and bare ground were
recorded. These data from the
350 transects, each with 500
units identified by kind of inter-
cept and location on the line
were considered the population.
More detailed discussion of the
experimental procedures is given
by Fisser (1961).
Results . - Physical character-
istics of the experimental sites
are summarized in Table 1. The
research unit was in a foothill
area of rough terrain with eleva-
tions ranging from 5,260 ft to
6,120 ft. Approximately one-half
of the area was classified as silty site. The light to rocky textured
soils were mildly alkaline with
weak structure.
The study area was predomi- nantly a grass range although a
variety of important forb and
browse species was present. The
vegetation was dominated by
bluebunch wheatgrass (Agropy-
ron spicatum), prairie junegrass
(Koeleria cristata), Idaho fescue
(Festuca idahoensis), needleand-
thread (Stipa comata), and blue
grama grass (Bouteloua gracilis)
and forbs such as silky lupine
(Lupinus sericeus) and prairie
milkvetch (Astragalus striatus).
Needleleaf sedge (Carex eleo-
charis) was the most common
rhizomatous species. Shrubs
were present but dominated only on limited areas. Average oven-
dry production, as determined
by clipping procedures, was
almost 1,000 lb/acre (Table 1). From the population of 350 line
intercept transects, i.e., sets of
500 “points”, each of infinite
thinness and of O.Ol-ft length, 12
vegetation categories of impor-
tant species and groups of plants were selected for analysis (Table
2). Percent frequency, based on
presence or absence by transect, ranged from 100% for All Live
Vegetation to 17% for Shrubs.
Percent basal cover over all tran- sects was 15.9% for All Live
Vegetation. Small Clubmoss
(Selaginella densa) was most abundant with 8.9% basal cover. Basal cover of All Grasses was 4.3%. The most abundant species
was Bluebunch Wheatgrass with
0.5% basal cover. All Grasses
contr,ibuted 27% of All Live Veg- etation composition.
Variance, based on numbers of
O.Ol-ft intercepts per 5-ft tran-
sect line, ranged from 3977 for
All Live Vegetation to 3 for
Needleleaf Sedge. Small Club-
Table 1. Characferisfics of fhe experimental rangel. Methods of AnaZysis.-Analy- sis of variance and appropriate F tests, following procedures out- lined by Snedecor (1956), were used to compare different inten- sities of point sampling, system- atic vs. random sampling, and point vs. line intercept technique for frequency of occurrence, mean percent basal cover, and coefficients of variation of cover for the 12 important species or groups of plants. Number of point transects required to sam- ple within lo%> of the mean with 95% confidence on the basis of 350 individual and randomly lo- cated transects, were calculated by the procedure of Stein (1945).
Factor Units
Standard .
Mean deviation range Physiographic
Elevation Slope Edaphic
Soil depth Sand Clay Rock Vegetational
Grasses and sedges Forbs
Shrubs and half -shrubs
feet 5260 350 4780-6120
percent 17 12 1-71
inches percent percent percent lb/acre lb/acre lb/acre
7.2 3.5 2-24
75 9 46-93
8 4 2-25
16 16 l-62
580 350 <lO-1740 260 300 <lO-1350 100 230 <lo-2080 IAverages for data from 1958 and 1959 (Van Dyne and Kittams, 1960). Table 2. Population characferisfics for 12 vegetation groupings from 350
fransecfs.
Plant Group
Percent frequency’
Percent basal cover2
Percent cover
compositiono Variance4
All live vegetations 100 15.9 3 100 3977
All grasses 98 4.3 27 213
Bunchgrasses 79 2.3 14 151
Sod-formers 73 2.0 12 164
Bluebunch wheatgrass 32 0.5 3 25
Needleandthread 38 0.4 3 18
Needleleaf sedge 32 0.1 1 3
All forbs 58 1.6 10 251
Upright forbs 33 0.4 3 27
Mat forbs 38 1.2 8 288
Small clubmoss 52 8.9 56 3514
Shrubs 17 0.3 2 44
1 Frequency- based on presence or absence by transect
ZCover-based on total intercepts over all transects
sCornposition -based on percent of total basal cover intercept
“Variance-based on number of O.Ol-ft intercept units per 5-ft transect SIncludes lichens and moss
ences of amounts intercepted these points on the ground were per line with a variance of 3514. 2.4, 1.2, and 0.6 in, respectively.
The six sets of point data were Poinf Sampling from fhe Populafion summarized by percent transect
Procedures. - Point samples from the line intercept transects were taken by different inten- sities of sampling and by random and systematic selection. From each transect 25,50, and 100 units were selected. Random number
tables were utilized for random selection. Systematic selection
frequency of occurrence, percent basal cover, variance, and coef- ficient of variation for each of the 12 vegetation groupings se- lected from the population. These statistics were converted to the 500-unit-intercept basis by multiplying cover values of the 25, 50, and loo-point samples by 20, 10, and 5, respectively. Cover was conducted by designating variance and coefficient of vari- every 20th, lOth, and 5th unit ation values of the 25, 50, and along the transect line for the 25, loo-point samples were multi- 50, and loo-point samples, re- plied by 400, 100, and 25, respec- spectively. Distances between tively.
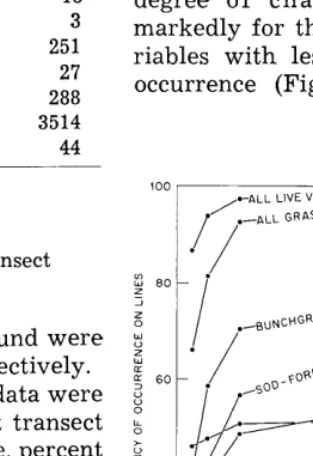
Results of Point Sampling Percent Frequency o-j Occur- ‘rence by Transect.-As expected, the percent transect frequency of occurrence decreased signifi- cantly as the number of points were decreased (Table 3). The degree of change increased markedly for the vegetation va- riables with lesser amounts of occurrence (Fig. 1) , accounting
UNCLASSIFIED ORNL- DWG w- 8018 1.
.-ALL LIVE VEGETATION .
.-ALL GRASSES
I
I-
1
c3 3” I”” 500
NUMBER OF POINTS PER LINE
Table 3. Mean squares from analysis of variance of percent transect fre- quency of occurrence, mean percent basal cover, and cover coefficient of variation data for 12 plant groups with (A) random and systematic spacing of points at three densities (25, 50, and 100 points per line) and (B) for systematically spaced points af four densities (25, 50, 100, and 500 points).
Degrees of Percent Coefficient
freedom frequency Percent cover1 of variation
Plant(s) Density Spacing PxD PXS DxS Error Plant(s) Density Error
P 11 D 2
S 1
22 11 2 22
11
3 33
A
4643.9**
1457.5** 137.0”” 37.2”” 9.6”* 0.4 1.2
B
3056.** 1303.“‘:’
26.
3229.469”” 87237.“”
.022 23820.“*
.479 5460.**
.159 1449.**
.190 639.“”
1.116 424.
.191 168.
2177.8** 47584.” *
.4 11010.**
.1 1424.
‘Mean squares for cover should be multiplied by .04 to convert them from a point to a percent basis.
** P < .Ol
for the significant plant group
by point density interaction.
Percent frequency of occurrence
was slightly but significantly
greater when points were taken
systematically than when se-
lected randomly except for
needleleaf sedge, the only rhi-
zomatous plant which was ana- lyzed individually.
“NCLASSlFlED ORNL-DWG 64-80, z .--• ALL LIVE VEGETATION
SMALL CLUBMOSS
.-.-. .
c
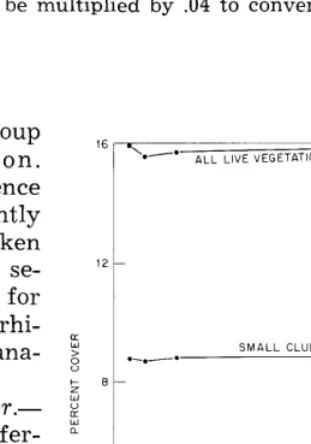
Mean Percent Basal Cover.-
There was no significant differ-
ence in average percent basal
cover among 100,50 and 25 points per line or between random and
systematically spaced points
(Table 3). A comparison of sys-
tematically spaced points only
shows that 25 points per line gave slightly higher estimates of basal cover than did 50, 100, or 500 points per line. There was no
relative difference among plants
in the way in which their basal cover was estimated by varying
the point densities (Fig. 2).
l -.-y$+----MAT-FORMING FOR&.
iz-_rit_+[sHR”Bs
*I
825 50 100 500
NUMBER OF POINTS PER LINE
FIG. 2. Mean percent basal cover of se- lected vegetation categories, averaged for systematic and random placement, as a function of number of points per line.
Coefficients of Variation. - A tistic. Because means were simi-
comparison am 0 n g coefficients lar for different point densities
of variation evaluates concomit- and because variances of esti-
ant differences in estimates of mates of cover varied inversely
means and variances for the dif- with point densities, the coeffi-
ferent point densities and spac- cients of variation for various
ing. Different plants can also be plant groups increased signifi-
compared directly with this sta- cantly w’ith decreasing numbers
of points per line (Fig. 3). Aver- aged over all plants and point
densities, the coefficients of vari-
ation were significantly higher
for random than for systematic spacing (Table 3).
Number of Transects Required.
-A practical measure of vari-
ability is the calculated number
of transects required to estimate cover within 10% of the mean
with 95% confidence. In almost
all instances point sampling
would require more lines (al-
though fewer points) than the
line intercept technique (Table
4). The high variability of this
foothill rang:. is reflected in the
impractical number of 5-ft line
intercept transects required for
sampling cover of most plant
groups. Only for major plant
groups All Live Vegetation and
All Grasses were the actual
number of transects, i.e., 350,
sufficient to sample with the
above precision.
Further insight into vegeta-
tion variability is shown by com-
parison of All Live Vegetation
variation among five lines in a
UNCLASSIFIED ORNL-DWG 64-801 .
8
.
ALL LIVE VEGETATION
ALL GRASSES :
II I I
25 50 100
NUMBER OF POINTS PER LINE
1
50,’
cluster with the variability among the 70 clusters (Table 5). The analysis of variance and the
F test indicate that between-
cluster variation was signifi-
cantly greater than within-clus-
ter variation for all data. Al-
though not significant, the F ra-
tio was slightly greater at any
point density for systematically
as compared with randomly
spaced points. The concomitant decrease of F values with sam- ple point numbers indicates that variation within clusters became
greater in relation to the be-
tween-cluster variation as the
number of sampling units were decreased.
Discussion
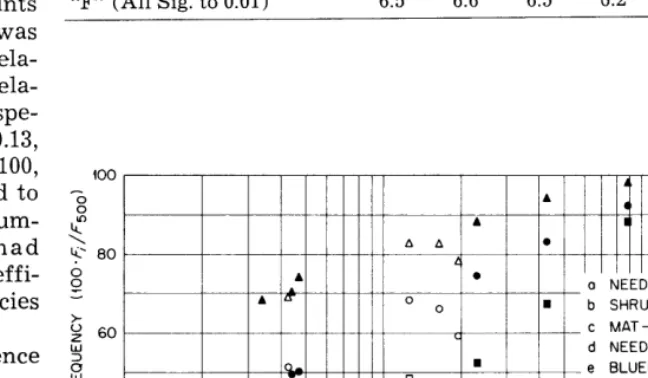
Intensity of Point Sampling.- For most plant categories and for
all point sampling intensities,
the relative frequency was di-
rectly proportional to the logar-
ithm of basal cover (Fig. 4). But
in plant categories containing
many rhizomatous species, the
relative frequency was less af-
fected by the number of points
per line. Needleleaf sedge was
the major exception to the rela-
tive frequency-basal cover rela-
tionship. Basal cover of this spe-
cies was estimated at 0.13, 0.13,
and O.l6a/,, respectively, for 100,
50, and 25 points as compared to 0.15% for 500 points. The num-
ber of points per line had
greater influence on the coeffi-
cient of variation for this species than any other (Fig. 3).
Lack of significant influence
of number of points per line on
percent cover is expected. The
minor variations in estimates of
percent cover by different point densities are not strongly related to plant growth forms (Fig. 2).
The number of transects re-
quired to sample within 10% of the mean with 95% confidence
varied inversely with percent
basal cover (Table 4). However,
needleleaf sedge required rela-
tively fewer lines and small
clubmoss required relatively
Table 4. Numbers of transects and point samples required to sample within 10% of the mean with 95% confidence.
Plant group
Number of Point samples required1 500-unit 100 pts. 50 pts. 25 pts.
lines Syst. Rand. Syst. Rand. Syst. Rand. All live vegetation 243 105 107 107 110 121 132
All grasses 185 131 141 170 190 236 308
Bunchgrasses 453 108 132 119 156 178 248
Sod-formers 656 139 128 167 179 198 239
Bluebunch wheatgrass 1712 134 163 168 198 274 351 Needleandthread 1522 121 146 131 186 184 273 Needleleaf sedge 1878 206 213 375 295 570 496
All forbs 1461 97 102 94 124 121 161
Upright forbs 2445 93 129 115 162 208 223
Mat forbs 2387 97 101 98 117 115 158
Small clubmoss 697 101 103 108 106 111 112
Shrubs 5963 112 126 143 160 127 191
3 Data given as percent of the number of 500 unit lines required to sample within the stated limits.
Table 5. Mean square and F values of between-cluster and within-cluster analysis of variance on “All Live Vegetation” data from 350 transects in 70 clusters, each with 5 transects.
Degrees Inter- Point sample data
of cept 100 pts. 50 pts. 25 pts. Mean square freedom data Syst. Rand. Syst. Rand. Syst. Rand. Between cluster 69 12,356 408 514 126 124 32 33 Within cluster 280 1,912 77 79 20 22 7 7 “F” (All Sig. to 0.01) 6.5 6.6 6.5 6.2 5.5 4.7 4.6
ORNL-DWG 65-3668
I III - k’nT-FORMING FORBS
_ ._3LE -AND-THREAD
Q1 n e BLUEBUNCH WHEATGRASS
0
0 c f UPRIGHT FORBS
0 g ALL FORBS
h SOD-FORMING GRASSES
0 I I II/l . 50 POINTS M k ’ SMALL CLUBMOSS 4
n 25 POINTS I ALL LIVE VEGETATION
I
I I
b cde f gh’ j k 1
I I
-0.t 0.2 0.5 1 2 5 10 20 50
PERCENT COVER (500 POINT BASIS)
FIG. 4. Percent relative frequency of 12 plant categories as a function of the logarithm of
be due to the extreme range of more lines than would be ex-
plant size.
petted in comparison with the
other 10 categories. For needle-
leaf sedge this effect is caused
by its rhizomatic growth form.
For small clubmoss, however,
the reason is not clear but may
for point samples but was 53%
points per line. However, the
for the population.
relative difference was greater
for 25 points per line, leading to
the significant point placement
x point-density interaction
(Table 3). Mean frequency of oc- currence varied from 27 to 45%
Systematic vs. Random Spac- ing. -Averaged over all plant
categories, there were signifi-
cantly higher estimates of fre-
quency with systematic than
with random spacing. But there
were significantly lower coeffi-
cients of variation and few tran-
sects required for sampling by
random than by systematic
placement of points (Tables 3
and 4.) Cover estimates, how-
ever, were not significantly dif-
ferent for systematic and ran-
dom sampling.
” There were important interac-
tions of point density and sys- tematic vs. random placement of
points for percent frequency, co-
efficients of variation, and num-
bers of transects required for
sampling (Table 6).
Averaged over all plant cate-
gories, systematic placement of
points gave higher estimates of
percent frequency than did ran-
dom placement of 25, 50 and 100
Table 6. Mean values of percenf frequency of fransecf occurrence, percenf coefficienf of variafion. and number of fransecfs required averaged over all planf cafegories showing inferacfion of poinf dens- ify and poinf placemenf.
Point Samples 100 pts. 50 pts. 25 pts. S2 R2 S R S R
~- Frequency
Transect
Occurrence 45 42 38 35 30 27 Coeff. of
Variation 201 212 223 238 256 283 Transects
Required1 120 133 150 165 204 249
IData are expressed as percent of
the numbers required for the 500 unit lines.
2s = systematic; R = random.
For coefficients of variation
and for number of lines re-
quired, there was greater actual
and relative difference between
systematic and random place-
ment for 25 points per line than
at higher densities. Mean coef-
ficients of variation varied from 201 to 283% for point samples but was 186% for the popula- tion.
Estimates of percent fre-
quency and coefficients of varia-
tion for the various plant cate- gories did not vary uniformly as
point density and point place-
ment varied, resulting in signifi-
cant interactions (see P x D and
P x S in Table 3).
That percent frequency, aver-
aged over random and sys-
tematic placement, generally
varied directly with percent
cover, was discussed above and
illustrated in Fig. 4. But fre-
quency of all plant categories
did not respond identically to
different point placements.
Needleleaf sedge was estimated
to have greater frequency by
random than by systematic
placement. In contrast Bunch-
grasses, Needleandthread, and
all three forb categories had
greater estimates of frequency
by systematic than by random
placement of points. Generally,
there was more difference be-
tween random and systematic
placement of frequency esti-
mates for loo-point sampling
than for 50- or 25-point sam-
pling. This is expected because
the average distance between
points for 100, 50, and 25-point
densities, respectively, is .05, .lO,
and .20 ft. The basal diameter of
these categories often exceeded
.05 ft but was usually less than .lO ft. For needleleaf sedge, how-
ever, the greatest difference be-
tween frequency estimates for
random and systematic point
placement was at the 25-point-
per-line density. The basal di-
ameter of this species was usu-
ally less than .05 ft; it is
rhizomatous and the mean dis-
tance between “plants” was
probably .20 ft or greater. These
data illustrate the importance of
relations between plant growth
form and sampling metholology,
a topic not well understood al-
though recently discussed in
some detail by Kershaw (1964)
and Greig-Smith (1964).
Estimates of coefficients of
variation and of numbers of lines
required for sampling varied
with point placement and point
density for different plant cate-
gories. These were greater for
systematic than for random sam-
pling for needleleaf sedge but
greater for random than for sys- tematic placement for individual
bunchgrasses, the All Bunch-
grasses, and all three forb cate-
gories. There was more differ-
ence in coefficients of variation
between random and systematic
placement of points at the 25-
point density than at higher
densities.
Pracfical Implicafions
There are numerous implica-
tions from these studies for sam-
pling foothill bunchgrass range.
The “best” sampling plan de-
pends upon the percent basal
cover and the growth form of the species to be sampled.
To sample a sod-forming spe-
cies, such as needleleaf sedge,
random placement of points
would be better than systematic
placement. However, for the
dominants, the bunchgrasses,
systematic placement would be
better, especially if the distance
between points is greater than
the average basal diameter of
the plants. Still, for species or
either random or systematic placement would suffice, but points should be spaced widely for greatest efficiency.
For almost all plant categories, estimates of percent frequency by point sampling are consider- ably lower than the respective population values. These esti- mates are not related in a linear manner to the point density or to the percent basal cover.
Estimates of percent cover would be relatively accurate with any of the point densities investigated.
Summary
This paper reports a compari- son of point techniques for ana- lyzing basal cover of grasslands. A population of 350 line inter- cept transect records, each re- corded to 0.01 ft intervals for 5 ft, was sampled both randomly and systematically with 25, 50, and 100 points (O.Ol-ft units) per line. Statistical analyses were made to compare point densities, point placements, and their interac-
tions with each other and with 12 plant categories. Comparisons were also made of the various point-sample estimates to the population parameters.
Some practical implications from these studies for sampling foothill grasslands similar to those described herein are:
(1)
(2)
(3)
DEVRIES, D. M., AND T. A. DEBOER. 1959. Methods used in grassland research in the Netherlands and their application. Herbage Abstr. 29: l-7.
To sample sod-forming spe- cies, such as needleleaf sedge, random placement of points would be better than systematic placement. To sample the dominant bunchgrasses, systematic placement would be better, especially if the distance between points is greater than the average basal di- ameter of the plants.
ELLISON, L. 1942. A comparison of methods of quadratting shortgrass vegetation. J. Agr. Res. 64: 595- 614.
To sample plant categories with high basal cover, either of the noint nlace-
FISSER, H. G. 1961. A comparison of line intercept, inferred point con- tact and weight measurement methods on foothill grassland vegetation. M.S. Thesis. Mont. St. Coil. 141 p.
FISSER, H. G., AND G. M. VAN DYNE. 1960. A mechanical device for re- peatable range measurements. J. Range Manage. 13: 40-42.
GOODALL, D. W. 1952. Some consid- erations in the use of point quad- rats for analysis of vegetation. L L Aust. J. Sci. Res. 5: 1-41.
ment procedures would suffice.
(4) Generally, greater effi- ciency in sampling would occur with 25 than with more points per line. (5) Basal cover of all species
was estimated relatively accurately by both point placements and all point densities.
LITERATURE CITED ABERDEEN, J. E. C. 1958. The effect
of quadrat size, plant size, and plant distribution on frequency estimates in plant ecology. Aust. J. Bot. 7:47-58.
BAUER, H. L. 1943. The statistical analysis of chaparral and other plant communities by means of transect samples. Ecology 24: 45-61. BROWN, D. 1954. Methods of survey-
ing and measuring vegetation. Comm. Bur. Past. and Field Crops. Bull. 42. Hurley, Berks, England. 233 p.
CANFIELD, R. H. 1942. Sampling ranges by the line intercept method-plant cover, composition, density, and degree of forage use. Southwestern Forest and Range Exp. Sta. Res. Rep. 4. 26 p. COCKAYNE, L. 1926. Tussock grass-
land investigations in New Zea- land. p. 349-361 IN: Tansley, A. C. and T. F. Chipp (editors). Aims and methods in the study of vegetation. Crown Agents for the Colonies. Lond’on. 383 p.
GREIG-SMITH, P. 1964. Quantitative plant ecology. Butterworths, Inc. Washington, D. C. 2nd Ed. 256 p. HEADY, H. F. 1961. Techniques in teaching range management tech- niques. Proc. Ann. Meet. Amer. Sot. Range Manage. 14:68 (ab-
stract) .
HEADY, H. F., R. P. GIBBENS, AND R. W. POWELL. 1959. A compari- son of the charting, line intercept, and line point methods of sam- pling shrub types of vegetation. J. Range Manage. 12: 180-188. HOELL, P. G. 1943. The accuracy of
sampling methods in ecology. Ann. Math. Stat. 14: 289-300.
HYDER, D. N., C. E. CONRAD, P. T. TUELLER, L. D. CALVIN, C. E. POULTON AND F. A. SNEVA. 1963. Frequency sampling in sagebrush- bunchgrass vegetation. Ecology 44: 740-746.
KERSHAW, K. A. 1964. Quantitative and dynamic ecol’ogy. Amer. Else- vier Publ. Co., Inc. 183 p. LEVY, E. G. 1927. The grasslands of
New Zealand. New Zeal. J. Agr. 34: 145-164.
MCINTYRE, G. A. 1953. Estimations of plant density using line tran- sects. J. Ecol. 41:319-330.
SCHULTZ, A. M., R. P. GIBBENS, AND L. DEBANO. 1961. Artificial popu- lations for teaching and testing range techniques. J. Range Man- age. 14: 236-242.
SNEDECOR, G. W. 1956. Statistical methods. 5th Ed. Iowa State Coll. Press, Ames, 534 p.
STEIN, C. 1945. A two-sample test for a linear hypothesis whose power is independent of the vari- ance. Ann. Math. Stat. 16: 243-258. VAN DYNE, G. M. 1960. A method for random location of sample units in range investigations. J. Range Manage. 13: 152-153. VAN DYNE, G. M., AND H. A. KIT-
TAMS. 1960. Nutrient production of foothill range-a progress re- port of 1958 and 1959 studies. Anim. Ind., Range Manage. and Wool Lab. Rpt. 26. Mont. Agr. Exp. Sta., Bozeman, Montana. 74 p. WARREN-WILSON, J. 1950. Analysis
of spatial distribution ‘of foliage by two-dimensional point quad- rats. New Phytol. 58:92-101. WHITMAN, W. C. AND E. I. SIGGERS-