Evaluation of Mixed-mode Integral Invariant for Polymer
Material
Trough
The
Couple
Experimental-Numerical
Process
M. Mamadou1 , O. Pop1, F. Dubois1,a and J. Absi2
1
GEMH – GCD Laboratory, Limoges University, Civil Engineering, 19300 Egletons France
2
GEMH Laboratory, Limoges University, 87000 Limoges France
Abstract. Usually the element of real structures is subject of the mixed mode loadings. This fact can be explained by the elements geometry and the loading orientations. In this case the propagation of the eventual cracks is characterised by the mixed mode kinematics. In order to characterize the fracture process in mixed mode it’s necessary to separate the fracture process in order to evaluate the influence of each mode. Our study is limited to plane configurations. The mixed mode is considered as an association of opening and shear modes. The mixed mode fracture is evaluated trough the experimental tests using the SEN specimen for different mixed mode ratios. The fracture process separation is operated by the invariant integral Mθ. Moreover, our study regroups an experimental and a numerical approaches.
2 Invariant integral. M
θ
θ
θ
θ
integral
The real structures are subject to complex loadings and the fracture process, which is characterised by mixed mode kinematics. In this case, in order to characterise the influence of the fracture mode on the crack propagation kinematics it is necessary to separate each fracture modes. In our study, the analyse is to plane configurations and the body is loaded in opening and in shear mode.
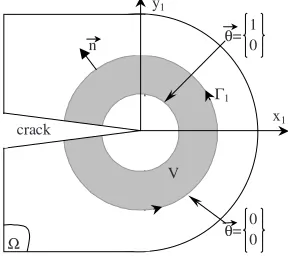
According to a finite element approach, the mixed mode fracture separation is usually obtained by using an invariant integral Mθ [1, 2]. Mθ integral involves the use of virtual displacement fields (νi) and virtual stress tensors (σij(ν)) in accordance with the virtual work principle [3, 4]. For plane
configurations, the Mθ form is recalled in the next equation in which Ω designates the surface domain (Figure 1):
(
( ) ( ))
, , ,
1
d 2
u v
i j i k j
ij ij k
Mθ σ v σ u θ
Ω
= ⋅
∫
⋅ − ⋅ ⋅ Ω(1)
a
e-mail : [email protected]
© Owned by the authors, published by EDP Sciences, 2010 DOI:10.1051/epjconf/20100631007
The virtual work principle requests a coupling between virtual fields and real mechanical fields defined, in terms of displacements and stresses, by ui and (σij(u)), respectively. A virtual integration
crown is materialized by a continuously and derivable vector field θ (Figure 1). Boundary conditions are noted in Figure 1.
θ= 0 0
θ= 1
0
Γ1
V n
Ω
x1
y1
crack
Fig. 1. Integral domain for Mθ
In the crack tip vicinity, the Mθ can be defined according to a physical interpretation. Mechanical fields are locally defined by a specific singular form for stresses according to stress intensity factors. For plane configurations, uK1 and uK2 designate SIF for open and shear modes, respectively.
Displacements are obtained by employing reduced elastic compliance C1 and C2. In this context, the
total energy release rate is written as follow:
(
1)
2(
2)
21 2
8 8
uK uK
G=C ⋅ +C ⋅
(2)
The formulation (2) can be adapted for the Mθ-integral as follow:
1 1 2 2
1 2
8 8
uK vK uK vK
Mθ =C ⋅ ⋅ +C ⋅ ⋅
(3)
ν K1 and
ν
K2 designate two arbitrary virtual stress intensity factors in accordance with σij(
ν)
. Specific choices for νK1 and
ν
K2 allows the isolation of open and shear modes as follow:
(
1 2)
1
1
1; 0
8
v v
uK M K K
C
θ = =
= ⋅
(4)
and:
(
1 2)
2
2
0; 1
8
v v
uK M K K
C
θ = =
= ⋅
(5)
(
1)
21 1
8
uK
G =C ⋅
and
(
2)
22 2
8
uK
G =C ⋅
(6)
3 Material and methods
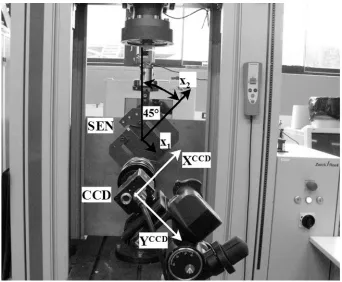
Displacements fields are measured starting to the experimental tests. They are realised using the SEN (Single Edge Notch) specimens made in PVC. The geometrical dimensions of specimen are: 140x210x10mm3 and the notch length is 50 mm. The experimental setup is illustrated in Figure 2.
Fig. 2. Loading system and acquisition devices.
A Zwick testing machine was used under displacement control (0,25 mm/min). The experimental machine is an electromechanical press with mobile cross-bare. As shown the loading in mixed mode is realised by the arcan fixtures [5, 6]. The specimen behaviour and the fracture parameters are recorded using several techniques and methods. During the test a LVDT sensor and a load cell record the specimen behaviour. In parallel the displacement of the loading points is acquired by mark tracking method. A CCD camera records the displacement field evolution on the specimen surface and the image analysis is realised by digital image correlation (DIC).
The principle consists on the comparison of two images, the reference image, corresponding of unloaded state of specimen, and the image recorded for the different deformed levels. In order to realise the digital image measurements the specimen surface is painted in black and white, in order to obtain a speckle pattern (see Figure 3).
direction. The component of displacement vector in opening and in shear modes are measured using the mark tracking method [7]. In this case, the black mark is stickled on the loading point (see Figures 2 and 3).
Arcanfixtures SEN specimen
specimen pattern F(u)
Arcanfixtures SEN specimen
specimen pattern F(u)
Black mark Loading point
Fig. 3. SEN specimen with Arcan Fixtures.
4 Results and discussion
The experimental tests are performed for two mixity ratios 30 and 45°. In this paper the experimental and numerical approaches are detailed only for 45°, knowing that the results obtained for 30° following the same reasoning.
As indicated above the energetically analysis of the specimen state is realised by finite element method. The mechanical fields and the integral invariants are calculated using the experimental displacement fields associated to a finite element mesh. The experimental analysis is based on the displacement fields measured on the specimen surface and the displacement of the loading points.
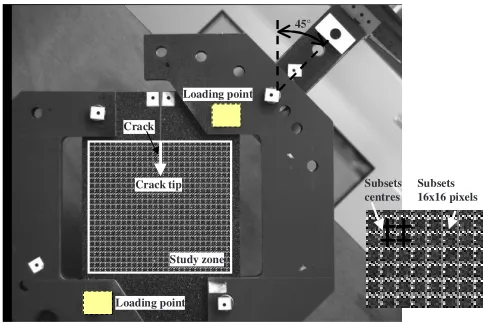
The study zone defined around the crack tip and the loading points are showed in Figure 4. The subsets of 16 by 16 pixels are used to subdivide the study zone in order to calculate the displacement fields by Correla software developed by Photomechanical and Rheology team of LMS Poitiers [8].
Study zone Loading point
Crack tip
Crack
Loading point Study zone
Loading point
Crack tip
Crack
Loading point
45°
Subsets 16x16 pixels Subsets
centres
The load-displacement evolution recorded by the electromechanical press during the test and the displacement of the loading points are plotted in Figure 5.
0 0,5 1 1,5 2 2,5 3 3,5 4
0 100 200 300 400 500 600 700 800 900 1000 electromechanical press
marks tracking method
0 500 1000 1500 2000 2500 3000 3500 4000 4500
0 0,5 1 1,5 2 2,5 3 3,5 4
ele ctromechanical press
Ti me (s) Displace me nt (mm)
D is p la c e m e n t (m m ) L o a d (N ) 0 0,5 1 1,5 2 2,5 3 3,5 4
0 100 200 300 400 500 600 700 800 900 1000 electromechanical press
marks tracking method
0 500 1000 1500 2000 2500 3000 3500 4000 4500
0 0,5 1 1,5 2 2,5 3 3,5 4
ele ctromechanical press
Ti me (s) Displace me nt (mm)
D is p la c e m e n t (m m ) L o a d (N )
Fig. 5. Experimental results
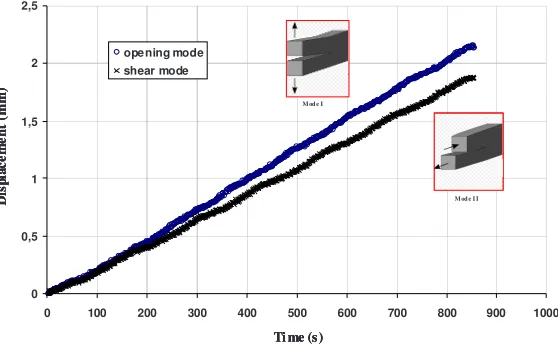
Note that the specimen behaviour remains elastic and the crack is stationary. The displacement of the loading point in opening and in shear modes is plotted in Figure 6.
0 0,5 1 1,5 2 2,5
0 100 200 300 400 500 600 700 800 900 1000
opening mode shear mode
Ti me (s )
D is p la c e m e n t (m m )
M od e I
M od e I I
0 0,5 1 1,5 2 2,5
0 100 200 300 400 500 600 700 800 900 1000
opening mode shear mode
Ti me (s )
D is p la c e m e n t (m m ) 0 0,5 1 1,5 2 2,5
0 100 200 300 400 500 600 700 800 900 1000
opening mode shear mode
Ti me (s )
D is p la c e m e n t (m m )
M od e I
M od e I I
Fig. 6. Displacement in opening and in shear modes vs. time
The plot shows that the amplitude of the displacement in opening mode (i.e. mode I) is most important in comparison with the shear mode (i.e. mode II).
The images acquisition being synchronised with the displacement of the cross-bare, of the electromechanical press, displacement fields can be associated to different loading steps.
In order to evaluate the integral invariants, it‘s necessary to calculate the components of the stress tensor and the displacement gradients. As the calculus is performed by finite element method it’s necessary to discretize the specimen geometry, before to proceed to the mechanical field evaluation. Now, using the centres co-ordinates of the subsets a finite elements mesh is generated using Castem software. The finite element mesh is created using four-node rectangular elements and the nodes are identified to subset centres (see Figure 4). The finite elements mesh is represented in Figure 7.
x y
Crack tip
X
Crack line
x y
Crack tip
X
Crack line
Fig. 7. Finite elements mesh
The finite element mesh and the displacements fields associated to different steps of loading are integrated in Castem code. The deformed meshes corresponding of two loading step are illustrated in Figure 8.
Fig. 8. Deformed meshes coresponding at F = 2381 and 4001 N
The finite element mesh and the deformed analysis put in evidence the absence of the crack lips and the noise of the displacement fields in the vicinity of the crack. Note, that the material discontinuity of the specimen is rather a notch with 2 mm of thickness.
The displacement carthographies associated at F = 4001N are illustrated in Figure 9.
Ux (mm) Uy (mm)
Using the analytical expressions of integral invariant, presented in the first part of paper, the energy release rate is separated. In this case the part of energy in opening mode and in shear mode is calculated for each mixed mode. The energy release is calculated for the crown number 4 definite around to the crack tip, as is illustrated in Figure 10.
Domain of integration Domain of integration
Fig. 10. Domain of integration (theta field vector) and the virtual fields The energy release rate in opening and in shear mode is plotted in Figure 11.
Energy release rate (N/ mm)
L
o
a
d
(
N
)
0 2 4 6 8 10 12
0 500 1000 1500 2000 2500 3000 3500 4000 4500 G1
G2
Energy release rate (N/ mm)
L
o
a
d
(
N
)
0 2 4 6 8 10 12
0 500 1000 1500 2000 2500 3000 3500 4000 4500 G1
G2
Fig. 11. Energy release rate vs. load
This approach allows the analyse of each mode the contribution in the fracture process. By analysing the two evolutions, we can remark that the opening mode dominated, and the amplitude of opening mode is most important.
4 Conclusion
In the present work, the mixed mode separation using the integral invariant Mθ was performed. The Mθ integral approach is based on conservative law and a combination of real and virtual displacement fields. Actually, this integral is only performed in a finite element approach. It allows the mixed mode separation for complex loading configurations.
The full-field displacements on the side surface of specimen are measured using digital image correlation. Then, starting to the experimental displacement fields a numerical model is reproduced by finite elements method and the energy release rate for each mode is calculate using the Mθ
integral. In this case, the experimental fields of displacements and strains replace numerical fields.
References
1. F. H. K. Chen, R. T. Shield: Conservation laws in elasticity of the J-integral type, Journal of Applied Mechanics and Physics, 28 (1), 1-22, (1977).
2. J. F. Yau, S. S. Wang, H. T. Corten: A mixed mode crack analysis of isotropic solids using conservation laws of elasticity, ASME J. Appl. Mech., 47, 335-341, (1980).
3. R. Moutou Pitti, F. Dubois, C. Petit, N. Sauvat: Fracture of wood under mixed mode loading: numerical approach by the Mθν-integral, 9th World Conference of Timber Engineering (WCTE), Portland OR, USA, August 6-10, (2006).
4. P. Destuynder, M. Djaoua, S. Lescure : Quelques remarques sur la mécanique de la rupture élastique, Journal de Mécanique Théorique et Appliquée, 2, (1) : 113-135, (1983).
5. H. A. Richard. A new compact shear specimen. International Journal of Fracture, 17(5), 105-107, (1981)
6. S.-C. Yen, J.N. Craddock, K.T. Teh : Evaluation of a modified arcan fixture for the in-plane shear test of materials, Experimental Techniques, 12(12), 22-25, (2008).
7. Y. Barranger, P. Doumalin, J-C Dupre, A Germaneau, S. Hedan and Valery Valle: Evaluation of three-dimensional and two-dimensional full displacement fields of a single edge notch fracture mechanics specimen, in light of experimental data using X-ray tomography, Engeneering Fracture Mechanics, 76, 2371-2383, (2009).