EXPLORATORY ANALYSES OF FORAGING HABITAT
SELECTION OF THE RED-FOOTED FALCON
(
FALCO VESPERTINUS
)
PALATITZ, P.1, FEHÉRVÁRI, P.1,2, SOLT, SZ.1, KOTYMÁN, L.3, NEIDERT, D.4and HARNOS, A.2 1MME/BirdLife Hungary, H-1121 Budapest, Költő u. 21, Hungary
E-mail: [email protected]
2Department of Biomathematics and Informatics, Faculty of Veterinarian Sciences
Szent István University, H-1071 Budapest István u. 2, Hungary
3Hungarian Academy of Sciences, Plant Protection Institute, Department of Zoology
H-1022 Budapest, Herman Ottó u. 15, Hungary
4Körös–Maros National Park, H-5040 Szarvas, Anna liget, Hungary
The foraging habitat selection of Red-footed Falcons (Falco vespertinus) was investigated in a characteristic Hungarian habitat between 2006–2008. Potentially available habitat types were assessed within a 10 km2study site with remote sensing technologies. Altogether 18 adult
birds were equipped with tail-mount VHF radio-tags and individually followed until visual contact to record location and foraging behaviour. Foraging areas were assessed with 100% Minimum Convex Polygons (MCP), global Manly’s selectivity measures were used to detect population level habitat preference, and the eigenanalysis of selection ratios was carried out to partition the variability in individual habitat preference. We found large individual variability in the extent of foraging areas. Females had significantly smaller foraging areas compared to males, while males at the largest colony had significantly larger foraging areas compared to males of the smaller colonies. Global Manley’s selectivity measures showed that birds signifi-cantly avoided intertilled crops, water surface, woods and artificial surfaces. The eigenanalysis of selection ratios partitioned individual habitat selection rates into two distinct groups; the first using grasslands and alfalfa while the second group of birds preferring grasslands and cereals. Positive habitat preference towards arable habitat types, indicate that species specific conser-vation efforts of this declining raptor should also focus on agricultural land use practices. Key words: Red-footed Falcon, radio-telemetry, foraging habitat selection, design III eigen-analysis, Manley’s selectivity
INTRODUCTION
Understanding the environment utilization of organisms over space and time
is one of the main focus of modern ecology. Many animals – even the most mobile
species – restrict their movement to specific home ranges (B
URT1943, J
ETZet al.
2004) especially in the reproduction period. The extent, the habitat composition and
the utilization of this space may provide intriguing support to better understand
distribution and abundance of organisms (G
AUTESTAD& M
YSTERUD2005),
in-fection spread (K
ENKREet al.
2007), predator–prey dynamics (L
EWIS& M
URRAY1993), or habitat selection (R
HODESet al.
2005). The latter proved to be eminently
important in case of species with high nature conservation value, as these results
help evaluate effective habitat management practices (S
ERGIOet al.
2003, F
RAN-CO& S
UTHERLAND2004, M
ARTINEZet al.
2007, A
RROYOet al.
2009).
Recent developments in animal tracking methods (e.g. M
ATOSEVIC2006),
GIS and statistical tools (G
UISAN& Z
IMMERMANN2000) are allowing to expand
space use studies to a wide variety of species and facilitate well funded inferences
on obtained results. The most common method used to assess how animals use
space is deploying transmitters on the individuals, enabling researchers to sample
individual movement patterns. The drawbacks of transmitter based tracking
meth-ods in avian species are that they are time-consuming, are often logistically
diffi-cult to carry out (e.g. P
ERROWet al.
2006), or are still very expensive (e.g. F
RANCOet al.
2004). Moreover, the simple localizations of tracked individuals without the
collection of additional variables (e.g. behavioural observations) are difficult to
in-terpret. All of these disadvantages narrow to a common pitfall; a characteristic trait
of these studies is that they often have low sample sizes, making population level
inferences difficult.
The Red-footed Falcon (
Falco vespertinus
) is the sole facultative colonial
rap-tor species of the Carpathian Basin, predominantly occupying rookeries for nesting
(P
URGER& T
EPAVCEVIC1999, P
URGER2001). This small falcon is in the focus of
both national and international conservation efforts (strictly protected in Hungary,
“near-threatened” in IUCN Red List, ANNEX I of EC Birds directive 79/409/EEC).
Red-footed Falcons breed in steppe, pseudo-steppe, wooded steppe and extensive
agricultural type habitats of Eurasia (D
ELH
OYOet al.
1992). The most frequent
prey items of the species are invertebrates, mainly Orthoptera, Odonata, and
Coleo-ptera, vertebrate prey items are mainly amphibians and small mammals (K
EVE&
S
ZIJJ1957, C
RAMP& S
IMMONS1977, H
ARASZTHYet al.
1994, P
URGER1998). A
severe population decline was observed during the past 60 years (B
AGYURA&
P
ALATITZ2004) coupled with a simultaneous contraction of breeding range within
Hungary (F
EHÉRVÁRIet al.
2009). A similar trend was recorded in adjacent Serbia
(P
URGER2008). Habitat loss is one of the primary causes driving the decrease of
avian diversity and species abundance (K
REBSet al.
1999, M
YERSet al.
2000, B
USTA-MANTE1997, L
OPEZ-L
OPEZet al.
2007, C
ARRETEet al.
2002, D
OLMAN& S
UTHER-LAND1995). The recently completed European Species Action Plan for the
Red-footed Falcon highlights that habitat loss and degradation is presumably a key
ele-ment in the overall decline of this species, however there is a lack of basic
knowl-edge obstructing the proper conservation management (P
ALATITZet al.
2009).
To be in accordance with conservation needs the current paper is the first in
series of studies conducted to reveal habitat selection and hunting efficiency of
Red-footed Falcons.
The species is relatively easy to trap, observe and due to the colonial breeding
they occur in high densities allowing to design and test innovative methods of
space use study on moderate sample sizes. Our current objective with this study is
to serve with basic information for conservation planning of the species, and to
demonstrate that with optimally chosen tracking methodology and statistical tools,
it is possible to reveal the variability of foraging area size and of resource selection
present even when analysing a moderate sample size.
MATERIALS AND METHODS
Study site and habitat mapping
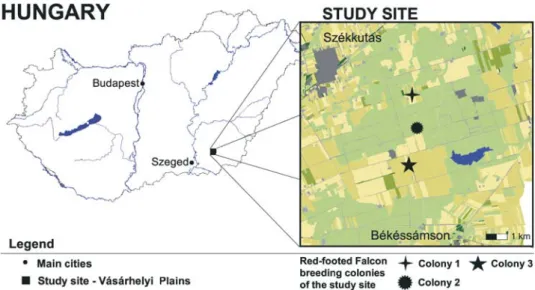
Field work was carried out between 2006–2008 at the Vásárhelyi-plains (46°28’16”N, 20°36’ 17”E), protected area of the Körös–Maros National Park Directorate (Fig. 1). This area of ca. 6000 ha together with its surroundings is one of the largest continuous grassland patches in southeastern Hun-gary and it holds one of the most characteristic alkali lakes of the region. Depending on the circum-stances of the given year, altogether 60–120 pairs of Red-footed Falcons breed in 3 artificial nest-box colonies (C1, C2, C3 see Fig. 1), in addition to 5–15 solitary pairs. The three colonies showed large inter-annual variation in the number of breeding pairs (C1: 15–19 pairs, C2: 5–21 pairs C3: 9–48 pairs), however, C3 had the largest number of breeding pairs on average. A 10 × 10 km study area, centered around the oldest colony (C2), was designated prior to all field activity. Each year, a precise habitat map of the study area was prepared with the aid of remote sensing techniques. An Iconos-2 image was used to identify the habitat type of all habitat patches within the sample plot in 2006, while hyper-spectral aerial photographs were utilized to achieve the same at the end of 2007 and 2008. Hab-itat patches were defined either as the area of homogenous plant coverage (i.e. agricultural parcel) in the case of arable fields, or as the smallest area surrounded by line-type habitat attributes (e.g. dirt roads, canals) in the case of grasslands. We assigned an individual ID number and rendered habitat type attributes based on the reflected wavelength values of each pixel of the multispectral remote sensing images (for details see KRISTÓFet al.2007). The habitat type categories were: grasslands, ce-reals, alfalfa, intertilled crops (e.g. maize and sunflower), artificial surface (e.g. roads, farm build-ings), reedbeds, water surface and woods. The applied methodology did not allow the separation of fallow lands from grasslands, thus grasslands incorporate fallow type habitat patches in our study. Considerable inter-annual variation was observed in the relative extent of annual arable crops while the extent of natural habitats types remained constant.
Radio-telemetry
Altogether 10, 13 and 17 adult Red-footed Falcons breeding in the study site were trapped in 2006, 2007 and 2008, respectively. We used artificial and live decoys (eagle-owl;Bubo buboand goshawk;Accipiter gentilis) placed in front of mist nets (BUB1991) to catch adult falcons at the
breeding sites. Birds were colour-ringed and fitted with tail mount VHF radio transmitters (Biotrack TW-4, 3.5 gramms, www.biotrack.co.uk). The handling processes took ca. 15 minutes, and after re-lease, the falcons were observed for the rest of the day to identify their nest and evaluate the possible effects of the tagging procedure. None of the marked birds showed signs of abnormal behaviour, usu-ally as after a short preening period they returned to hunting or nest attendance.
In the first study year all birds were trapped at Colony 2 (Fig. 1 & Table 1), while in the follow-ing years birds of all three colonies and solitary breeders were tracked resultfollow-ing in stratified sample of the population. In 2006, only 2 of the radio-tagged birds fledged their nestlings. The relatively low number of successfully breeding birds is presumably not the consequence of tagging procedure as a high nest failure rate was observed in the whole population in 2006 (FEHÉRVÁRIet al.2008). Birds with failed breeding attempts left the study site to unknown locations. In 2007 and 2008 a large num-ber of tagged individuals prematurely moulted their central retrixes, thus loosing the radio-tag. The early moult of the tail feathers affected large number of birds, thus cannot be attributed to the applied methodology. We presume that if breeding and foraging conditions are exceptionally good (charac-teristic of 2007 and 2008) Red-footed Falcons initiate a suspended full moult in the breeding phase. As the retrix moult pattern of falcons starts with changing the two central tail feathers (FORSMAN 1999), 3 and 8 tagged individuals lost their radio-tags in 2007 and 2008 respectively. Thus, the data obtained from a total of 18 tracked Red-footed Falcons was used in the current study (Table 1).
Birds were individually tracked during the late nesting-period (corresponding to the second half of the nestling stage). A pilot study conducted in 2006 revealed that using triangulations (i.e. as-sessing the location from fixed positions with simultaneous azimuth readings) is ineffective to asses the position of tracked birds (unpubl. data). Red-footed Falcons have fast traveling speeds resulting in large error polygons moreover, one could only receive signals of the transmitter from a couple of hundred meters when the bird was perched on the ground, making azimuth reading problematic from fixed positions. Therefore, we chose to individually follow the tagged birds.
Two tracking groups – equipped with telescopes and radio tracking equipment (Televilt RX-900 and Yagi antenna) – were assigned to each tracked individual. The first group (observers) remained at
the nest and recorded the prey delivered, the time the birds left or returned to the nest and informed the second group (followers) on the direction of departure. The observers kept a safety distance of approx. 200 meters to avoid disturbance and to enable unbiased observations of behaviour.
The followers tracked the birds foraging trajectory (the route of the individual from the nest to the foraging area and back) with a four wheel drive vehicle, using the radio-signals to assist visual lo-calization (TELLAet al.1998). Observers continuously informed the followers on the direction of the tracked individual. When visual contact was lost, the two groups triangulated the bird’s signal to en-able the following group to relocate and continue visual observations.
The within day frequency of prey item delivery to nestlings shows a bimodal distribution with two peaks; the first being in the early morning hours, while the second in the late afternoon (H OR-VÁTH1964). To control for this phenomenon, and to avoid bias caused by following easy-to-track in-dividuals we designated two, 4 hour long standard telemetry sessions (time zone: UTC+2); a) morning sessions (4 a.m.–8 a.m.) and b) evening sessions (5 p.m.–9 p.m.). Each tagged individual was tracked for a minimum of 6 (3 morning and 3 evening) sessions. To avoid temporal correlation between ses-sions we applied a stratified sampling design; for each session the tracked individual was randomly chosen and if possible only one tracking session was carried out on an individual on a given day.
The followers – once visual contact was established – recorded the type of hunting, the effort (number of hoverings, number of strikes, time spent hunting), the success (prey type) and the location at habitat patch level (ID of the habitat patch) of the tracked falcons.
Red-footed Falcons have three distinct hunting types; perch-hunting, hover-hunting, and ae-rial hunting (prey caught mid-air from near ground altitudes up to cloud base). It is straightforward to link foraging activity to habitat patches in case of the first two hunting types, however in case of aerial hunting this is not possible as prey caught mid-air are presumably originating from large distance and not from habitat patches directly below the bird’s location.
We defined a HE as the foraging visit where perch- or hover-hunting was observed at an indi-vidual habitat patch, regardless of foraging success. Only one HE was considered if a habitat patch was revisited within the same foraging trajectory to avoid temporal autocorrelation of the data. We hypothesized that the frequency of HEs on a given habitat type allows for a rough estimation of the resource utilization of individuals.
As the current study aims to provide an exploratory analysis on Red-footed Falcon resource selection, only the frequency of HEs in different habitat types were analysed. Further efforts will be made to build more complex resource selection and hunting efficiency models.
Statistical analyses
In contrast with locations obtained with other tracking methods, our data is inherently biased as localization points occuring further from the nest-site are less likely detected. Although a wide va-riety of home-range estimating methods have been used ranging fromα-hulls (BURGMAN & FOX
2003) to parametric (e.g. MATTHIOPOULOS2003) and non-parametric kernel estimators (GETZet al. 2007) none of these can handle samples that are presumed to implicitly underestimate true home-range extent. Minimum convex polygons (MCP) or convex hulls are known to have adverse properties in home-range estimates as they tend to overestimate true home ranges if a) true home ranges are concave or b) if the location error is large (BURGMAN& FOX2003). In case of the current study, there are no barriers or inaccessible areas within our study site that may cause concave home ranges, and as only location data of visual observations are included, there is no location error. There-fore, we used 100% MCPs to construct individual home-ranges as these presumably are less likely to underestimate, the true extent of potential foraging areas. Since the location of birds was recorded on habitat patch level, we used the corners of the outermost visited habitat patches to construct the
MCPs. General linear models (CRAWLEY2007) were used to analyse inter-colonial and between-sex differences of mean MCP sizes. The dependent variable (MCP sizes) was log-transformed for better model fitting. As there were no females tracked at colony C3 we excluded males from this colony to avoid bias when comparing estimated foraging area size of sexes.
The constructed MCPs where later used to calculate the habitat composition (i.e. the relative size of each previously identified habitat type) of each individual’s potential foraging habitat. We ob-served HEs outside the pre-defined study site in case of two birds (C3m1 and C3m6 see Table 1), thus the constructed MCPs protruded the habitat map. These protruding segments compose less then 5% of the individual MCPs, hence we presume that the missing data has no serious effect on the robust-ness of the analyses conducted.
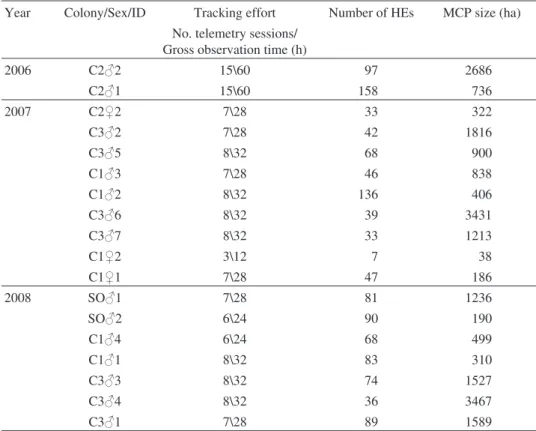
Table 1.Summary of tracked adult Red-footed Falcons. The first coloumn indicates the year of sampling. The first two characters of the next coloumn (Colony/Sex/ID) refer to the breeding site; SO stands for solitary breeders, C1, C2 and C3 represent the three colonies of the study site, the third character indicates the sex while the last character shows an individual within ID group. Tracking effort summarizes the total of independent sampling events (4 hour long telemetry sessions) and the gross observation time in hours. Number of HEs (hunting events) shows the total number of inde-pendent localizations with active foraging. MCP (Minimum Convex Polygons) size shows the 100% (i.e. all localizations included) MCPs in hectares. Only successfully breeding individuals with
at least three telemetry sessions were included.
Year Colony/Sex/ID Tracking effort Number of HEs MCP size (ha) No. telemetry sessions/
Gross observation time (h)
2006 C2m2 15\60 97 2686 C2m1 15\60 158 736 2007 C2f2 7\28 33 322 C3m2 7\28 42 1816 C3m5 8\32 68 900 C1m3 7\28 46 838 C1m2 8\32 136 406 C3m6 8\32 39 3431 C3m7 8\32 33 1213 C1f2 3\12 7 38 C1f1 7\28 47 186 2008 SOm1 7\28 81 1236 SOm2 6\24 90 190 C1m4 6\24 68 499 C1m1 8\32 83 310 C3m3 8\32 74 1527 C3m4 8\32 36 3467 C3m1 7\28 89 1589
We used the Manly selectivity measure to explore global habitat type selection ratios of Red-footed Falcons (MANLYet al.2002). In general, this method compares the available resources to resource usage of populations or individuals. In our case habitat types within individual MCPs (de-sign III type analyses) comprise resource units while HE frequency is the variable describing re-source selection. Deviation from random of the global habitat use of all birds was tested with the White and Garrot’sχ2test (WHITE& GARROT1990, MANLYet al.2002). We also calculated the pop-ulation level selectivity ratios (i.e. the average of individual selection ratios) and their confidence in-tervals (CI) for each habitat type concerned. A habitat type can be regarded as positively selected if the lower CI value of the mean ratio is above, and avoided in case the upper CI value is below one.
Although selectivity measures give a useful overview on the global resource selection of stud-ied individuals, they lack the power of revealing the source of variability. We used a relatively new statistical approach proposed by CALENGEand DUFOUR(2006) to reveal the variability of habitat se-lection; the eigenanalysis of selection ratios. This tool is considered as an extension of the eigen-analysis (e.g. correspondence or canonical correspondence eigen-analysis). In general the eigeneigen-analysis of selection ratios combines the White and Garrot’sχ2statistics the analysis of selection ratios and a cor-respondence analysis. The origin of the coloumn space defined by the factorial axes can be consid-ered as the point where a hypothetical animal is using all habitat types randomly or in other words where the White and Garrot’sχ2statistic is not significant. Individual habitat selection is then visual-ized within the factorial space describing the available habitats. The amount of overall discrimination is measured by the eigenvalues of the corresponding factorial axes.
We used the R 2.9.0 statistical software (R DEVELOPMENTCORETEAM2009) and the package adehabitat (CALENGE2006) for specific resource selection analyses.
RESULTS
Altogether 1227 independent HEs of 18 birds were analysed. We found large
individual variability in home range sizes of radio-tracked Red-footed Falcons
(Table 1) with a median MCP size of 838 ha (range 38–3467 ha). Males of colony
C3 had significantly larger MCPs compared to the males from colonies C2, C3 and
solitary males combined (Table 2, Model 1). Females had significantly smaller
foraging areas compared to males (Table 2, Model 2).
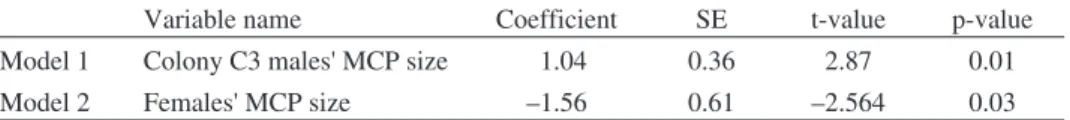
Table 2.Model parameter estimates of general linear models comparing inter-colonial foraging area size of males breeding in different colonies (Model 1) and inter-sexual differences (Model 2). In Model 1 we analysed the foraging area extent (estimated with individual MCP size) of male Red-footed Falcons as a function of which Colony they breed in. Male individuals breeding at the largest C3 colony had significantly larger foraging areas, compared to males in colonies C2 and C1. In Model 2 we analysed the inter-sexual differences in foraging area extent. We only included males from colonies C2 and C1 to avoid confounding effects of colony size (there were no tracked females from colony C3). Females had significantly smaller foraging areas compared to males. In case of both
models foraging area size was estimated with log-transformed individual MCP sizes (ha).
Variable name Coefficient SE t-value p-value
Model 1 Colony C3 males' MCP size 1.04 0.36 2.87 0.01
Model 2 Females' MCP size –1.56 0.61 –2.564 0.03
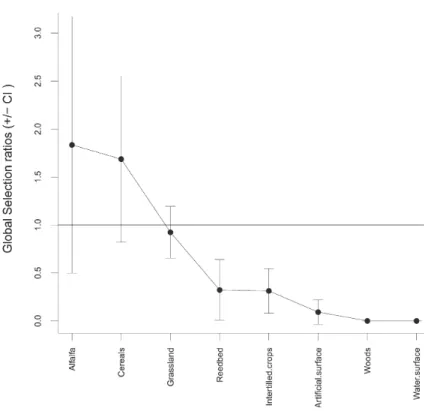
Overall foraging habitat selection deviated significantly from random (χ
2=
438.2226, df = 43, p < 0.0001). Red-footed Falcons hunted more on grasslands than
in the sum of all other habitat types (Pearson’s Chi-squared test:
χ
2= 307.1, df = 17,
p < 0.0001) when considering only the total number of observed HEs. However,
none of the global Manly selection ratios of the habitat types proved to be
signifi-cantly positive, only intertilled crops, water surface, reedbeds, woods and artificial
surfaces were significantly avoided (Fig. 2).
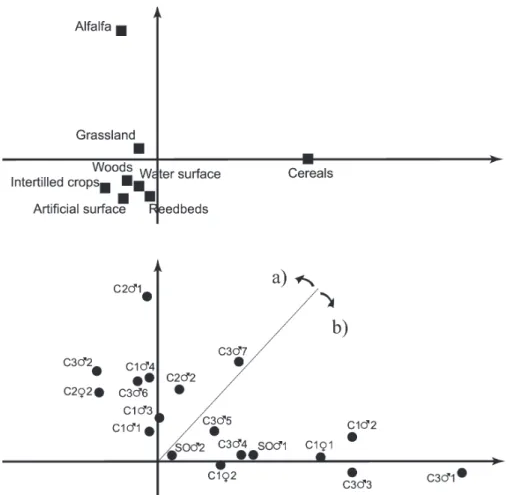
The performed eigenanalysis of selection ratios revealed a high individual
variability of habitat selectivity (Fig. 3). We used the first two factorial axes to
per-form the analysis explaining altogether 91% of the observed variability. The
dual-ity diagram shows that basically two distinct strategies can be identified; the first
group of birds favoured grasslands and alfalfa fields while the second group of
birds preferred grasslands and cereals. This dual pattern was reflected in the large
CI of global Manly’s selection ratios of these two habitat types. Only one
individ-ual (C3
m
7) showed preference towards both alfalfa and cereals, however alfalfa
Fig. 2.Global Manly Selection ratios ± Confidence intervals (CI) of the habitat types analysed. The black dots (•) represent the mean selectivity rate of each habitat type considered. A habitat type can be considered as avoided if the global selection ratio is located in the 0–1 interval, while it can be
preference was more pronounced, thus it was assigned to the later group. The
indi-viduals in the two groups cannot be linked to neither colonies, nor years, nor do
these groups separate the sexes.
DISCUSSION
The results of this study showed that the foraging area of radio-tagged
Red-footed Falcons differs between colonies and sexes (Table 1 & 2), and that these
birds have remarkably high overall variability in habitat selection ratios (Fig. 2).
Fig. 3.Duality diagram of the eigenanalysis of selection ratios of radio-tracked Red-footed Falcons. The top figure shows the habitat loadings (n) on two factorial axes, while the lower figure shows the habitat preference of individuals (•) in the same factorial space (see also Table 1). The birds can be assigned to two major groups; a) high alfalfa preference and b) high cereal preference individuals
Median foraging area size is relatively small when considering all tracked
in-dividuals, but due to the wide range of this parameter we suggest to use a much
larger 3–4 km radius circle when considering potential foraging area of a given
Red-Footed falcon colony. This area is likely to cover the bulk of every individuals
foraging area, thus can be used for both planning further habitat use related studies
and conservation measures.
The most simple explanation of the fact that males breeding in the largest
col-ony (C3) had larger foraging areas may be that the optimal foraging areas were
lo-cated farther away from this colony. However, intra-specific food competition
(e.g. F
URNESS& B
IRKHEAD1984, G
RIFFIN& T
HOMAS2000, A
INLEYet al.
2004)
would result in a similar pattern. Individual fitness may increase with colony size
(S
ERRANOet al.
2005, S
ERRANOet al.
2006), hence our results could also indicate
that higher quality males breeding in the large colony can utilize foraging patches
from larger distances.
The significant difference in MCP size amongst sex groups probably reflects the
different role played in parental care, since we found no evidence for sex-specific
foraging habitat preference. In small falcons, females are predominantly
responsi-ble for offspring protection, while males deliver the majority of prey items (W
IKLUND1990, T
OLONEN& K
ORPIMÄKI1994, P
URGER2001, S
ERGIO& B
OGLIANI2001).
Our habitat selectivity analyses indicate that Red-footed Falcons in general
avoid foraging on intertilled crops, woods, artificial surfaces, reedbeds and water
surface. Intertilled crops in the study area are typically maize and sunflower. These
two crops are only harvested in autumn, hence the vegetation structure and height
at the time the study was conducted obstructs access to prey (Y
OSEF& G
RUBBJ
R1993, S
HEFFIELDet al.
2001). The avoidance of artificial surfaces like pavements
and farm areas is not suprising as these habitats have low prey abundance and are
often disturbed. However, the avoidance of reedbeds and water surfaces is of
inter-est, as some of the invertebrate prey item taxa (Odonata and Dytiscidae) of this
species (e.g. H
ARASZTHYet al.
1994) are linked to wetlands. We presume that
these prey items are predominantly taken while aerial hunting, therefore the
forag-ing location is not linked to the habitat patch. The reproduction of Spade-foot toads
– the second most frequent vertebrate prey item – is also linked to wet areas, thus
water related habitat types may have an important albeit indirect overall effect on
foraging habitat selection.
Our results show that the studied individuals had no significantly positive
global preference for any of the avaialble habitat types (Fig. 2). The wide
confi-dence intervals of the estimates yield high individual variablity, although
Red-footed Falcons used grassland type habitat patches most often for foraging. The
later is in compliance with general expectations and previous large spatial scale
breeding site selection analyses (F
EHÉRVÁRIet al.
2009). On the other hand,
grass-land selection was not overall significant as the majority of available habitat types
were meadows or pastures.
Partitioning individual habitat preference showed that tracked birds can be
clustered into two distinct groups by positive habitat selection (Fig. 3).
Intrigu-ingly, Red-footed Falcons in the late nesting period had positive habitat preference
towards arable habitat types, but not natural habitats.
The first group predominantly utilised grasslands and mowed alfalfa fields,
while the second group could be defined as birds with high cereal preference.
Ce-reals in this case are actually harvested cereal fields, as at the time of the analyses
most fields were already harvested. Thus, the primary difference between alfalfa
and cereals is probably surface structure and prey item composition. Harvested
ce-real fields have no or very indistinct vegatation structure, therefore prey
detect-ability is high even when birds perch on the ground. From a surface structure point
of view alfalfa fields resemble mown grasslands, presumably with lower prey
detectability, but higher prey densities. We found no obvious pattern (sex, year,
breeding site) for the birds clustered into “cereals” or “alfalfa” preference groups.
Assumably, these results indicate highly individual foraging strategies and further
investigation is necessary to fully understand the proximal causes of variability.
The Hungarian National Conservation Plan of Red-footed Falcons (B
AGYU-RA& P
ALATITZ2004) was prepared based on the expert opinion of local
conserva-tionists working with the species in field. Intriguingly, all experts agreed that the
habitat management has to concentrate on grasslands. Our findings are not
contra-dicting previous assumptions since the tracked individuals predominantly hunted
in grassland type habitats, but rather demonstrate that certain arable habitat types
may have a considerable effect on the species’ foraging habitat selection.
In conclusion, we demonstrated that with optimally chosen tracking
method-ology and statistical tools, it is possible to reveal the variability of foraging area
ex-tent and of habitat selection even when analysing a moderate sample size. The
pre-sented results fill in an important knowledge gap on space use patterns of a little
known European raptor species of high nature conservation concern.
*
Ackowledgements– We thank REUVENYOSEFfor reviewing and commenting earlier versions of this manuscript. We also thank two anonymous reviewers for their insightful suggestions of this manuscript. We are grateful for the whole staff of the Körös–Maros National Park Directorate for all assistance provided and for the precious help of all the volunteers working in field, without them only fracture of the obtained data would be available. The project was financed by the EU’s LIFE Nature fund (LIFE05 NAT/H/000122).
REFERENCES
AINLEY, D. G., RIBIC, C. A., BALARD, G., HEATH, S., GAFFNEY, I., KARL, B. J., BARTON, K. J., WILSON, P. R. & WEBB, S. (2004) Geographic structure of Adélie penguin populations: over-lap in colony-specific foraging areas.Ecological Monographs74: 159–178.
ARROYO, B., AMAR, A., LECKIE, F., BUCHANAN, G. M., WILSON, J. D. & REDPATH, S. (2009) Hunting habitat selection by hen harriers on moorland: Implications for conservation manage-ment.Biological Conservation142: 586–596.
BAGYURA, J. & PALATITZ, P. (2004)Species conservation plan, Red-footed falcon (Falco vesper-tinus). Hungarian Ministry of Environment and Water, Budapest. Pp. 17–18.
BUB, H. (1991)Bird trapping and bird banding: a hand book for trapping methods all over the world.Cornell University Press, New York, 328 pp.
BURGMAN, M. A. & FOX, J. C. (2003) Bias in species range estimates from minimum convex poly-gons: implications for conservation and options for improved planning.Animal Conservation
6(1): 19–28.
BURT, W. H. (1943) Territoriality and home range concepts as applied to mammals.Journal of Mam-malogy24: 346–352.
BUSTAMANTE, J. (1997) Predictive models for lesser kestrel Falco naumanni distribution, abundance and extinction in southern Spain.Biological Conservation80(2): 153–160.
CALENGE, C. (2006) The package “adehabitat” for the R software: a tool for the analysis of space and habitat use by animals.Ecological Modeling197(3–4): 516–519.
CALENGE, C. & DUFOUR, A. B. (2006) Eigenanalysis of selection ratios from animal radio-tracking data.Ecology87(9): 2349–2355.
CARRETE, M., SÁNCHEZ-ZAPATA, J. A., MARTÍNEZ, J. E., SÁNCHEZ, M. & CALVO, J. F. (2002) Fac-tors influencing the decline of a Bonelli’s eagle Hieraaetus fasciatus population in southeastern Spain: demography, habitat or competition?Biodiversity and Conservation11(6): 975–985. CRAMP, S. & SIMMONS, K. E. L. (1977)Handbook of the birds of Europe, the Middle East, and
North Africa: the birds of the western Palearctic. Vol. 2. Oxford University Press, Oxford, UK. 195 pp.
CRAWLEY, M. J. (2007)The R book. John Wiley & Sons Ltd., The Atrium, Southern Gate, Chiches-ter, West Sussex, England. 933 pp.
DELHOYO, J., ELLIOTT, A., SARGATAL, J. & INTERNATIONAL, B. (1992)Handbook of the birds of the World.Lynx Edicions Barcelona. 265 pp.
DOLMAN, P. M. & SUTHERLAND, W. J. (1995) The response of bird populations to habitat loss.Ibis
137: 38–46.
FEHÉRVÁRI, P., NEIDERT, D., SOLT, S., KOTYMÁN, L., SZÖVÉNYI, G., SOLTÉSZ, Z. & PALATITZ, P. (2008) Kék vércse élőhelypreferencia vizsgálat – egy tesztév eredményei.HELIACA, MME Ragadozómadár-védelmi Szakosztály évkönyve, pp. 51–59.
FEHÉRVÁRI, P., HARNOS, A., NEIDERT, D., SOLT, S. & PALATITZ, P. (2009) Modeling habitat selec-tion of the Red-footed falcon (Falco vespertinus): A possible explanaselec-tion of recent changes in breeding range within Hungary.Applied Ecology and Environment7(1): 59–69.
FORSMAN, D. (1999)The raptors of Europe and the Middle East: a handbook of field identification, T. & AD Poyser, London, UK. 456–469 pp.
FRANCO, A. M. A., CATRY, I., SUTHERLAND, W. J. & PALMEIRIM, J. M. (2004) Do different habitat preference survey methods produce the same conservation recommendations for lesser kes-trels?Animal Conservation7: 291–300.
FRANCO, A. M. A. & SUTHERLAND, W. J. (2004) Modeling the foraging habitat selection of lesser kestrels: conservation implications of European Agricultural Policies.Biological Conserva-tion120(1): 63–74.
FURNESS, R. W. & BIRKHEAD, T. R. (1984) Seabird colony distributions suggest competition for food supplies during the breeding season.Nature311: 655–656.
GAUTESTAD, A. O. & MYSTERUD, I. (2005) Intrinsic scaling complexity in animal dispersion and abundance.American Naturalist165: 44–55.
GETZ, W. M., FORTMANN-ROE, S., CROSS, P., C., LYONS, A. J., RYAN, S. J. & WILMERS, C. C. (2007) LoCoH: Nonparameteric kernel methods for constructing home ranges and utilization distributions.PLoS ONE2(2): e207. doi:10.1371/journal.pone.0000207
HARASZTHY, L., BAGYURA, J. & RÉKÁSI, J. (1994) Food of the Red-footed Falcon (Falco vesper-tinus) in the breeding period.Aquila101: 93–110.
HORVÁTH, L. (1964) A kék vércse (Falco vespertinus L.) és a kis őrgébics (Lanius minor Gm.) élet-történetének összehasonlító vizsgálata II. A fiókák kikelésétől az őszi vonulásig.Vertebrata Hungarica6(1–2): 13–39.
JETZ, W., CARBONE, C., FULFORD, J. & BROWN, J. H. (2004) The scaling of animal space use. Sci-ence306: 266–268.
KENKRE, V. M., GIUGGIOLI, L., ABRAMSON, G. & CAMELO-NETO, G. (2007) Theory of hantavirus infection spread incorporating localized adult and itinerant juvenile mice.The European Phys-ical Journal55: 461–470.
KEVE, A. & SZIJJ, J. (1957) Distribution, biologie et alimentation du Facon kobez Falco vespertinus L. en Hongrie.Alauda25(1): 1–23.
KREBS, J. R., WILSON, J. D., BRADBURY, R. B. & SIRIWARDENA, G. M. (1999) The second silent spring?Nature400: 611–612.
KRISTÓF, D., NEIDERT, D., NAGY, Z. & PINTER, K. (2007) Integrating MODIS surface reflectance products into the processing of medium and high-resolution satellite images: Difficulties and solutions through two Hungarian case studies. In:International Workshop on the Analysis of Multi-temporal Remote Sensing Images, 2007. MultiTemp 2007.pp. 1–6.
LEWIS, M. A. & MURRAY, J. D. (1993) Modeling territoriality and wolf deer interactions.Nature
366: 738–740.
LOPEZ-LOPEZ, P., GARCIA-RIPOLLES, C., SOUTULLO, A., CADAHIA, L. & URIOS, V. (2007) Iden-tifying potentially suitable nesting habitat for golden eagles applied to ‘important bird areas’ design.Animal Conservation10(2): 208–218.
MANLY, B. F. J., MCDONALD, T. L. & THOMAS, D. L. (2002)Resource selection by animals: statisti-cal design and analysis for field studies2nd. ed. Kluwer Academic Publishing, Boston, 221 pp. MARTÍNEZ, J. E., PAGÁN, I., PALAZÓN, J. A. & CALVO, J. F. (2007) Habitat use of booted eagles (Hieraaetus pennatus) in a Special Protection Area: implications for conservation.Biodiversity and Conservation16: 3481–3488.
MATOSEVIC, M. Z., SALCIC, S. & BERBER, A. (2006) Comparison of accuracy using a GPS and a low-cost DGPS.IEEE Transactions on Instrumentation and Measurement55: 1677–1683. MATTHIOPOULOS, J. (2003) Model-supervised kernel smoothing for the estimation of spatial usage.
Oikos102: 367–377. doi: 10.1034/j.1600-0706.2003.12528.x
MYERS, N., MITTERMEIER, R., MITTERMEIER, C.,DAFONSECA, G. & KENT, J. (2000) Biodiversity hotspots for conservation priorities.Nature403: 853–858.
PALATITZ, P., FEHÉRVÁRI, P., SOLT, S. & BAROV, B. (2009)European Species Action Plan for the Red-footed Falcon Falco vespertinus Linnaeus, 1766. http://ec.europa.eu/environment/na-ture/conservation/wildbirds/action_plans/docs/falco_vespertinus.pdf. 49 pp.
PERROW, M. R., SKEATE, E. R., LINES, P., BROWN, D. & TOMLINSON, M. L. (2006) Radio telemetry as a tool for impact assessment of wind farms: the case of Little Terns Sterna albifrons at Scroby Sands, Norfolk, UK.Ibis148: 57–75.
PURGER, J. J. (1998) Diet of Red-footed Falcon Falco vespertinus nestlings from hatching to fledg-ing.Ornis Fennica75(4): 185–191.
PURGER, J. J. (2001) Defence behaviour of Red-footed Falcons Falco vespertinus in the breeding pe-riod and the effects of disturbance on breeding success.Ornis Fennica78(1): 13–22. PURGER, J. J. (2008) Numbers and distribution of Red-footed Falcons (Falco vespertinus) breeding
in Voivodina (northern Serbia): a comparison between 1990–1991 and 2000–2001.Belgian Journal of Ornithology138(1): 3–7.
PURGER, J. J. & TEPAVCEVIC, A. (1999) Pattern analysis of red-footed falcon (Falco vespertinus) nests in the rook (Corvus frugilegus) colony near Torda (Voivodina, Yugoslavia) using fuzzy correspondences and entropy.Ecological Modeling117(1): 91–97.
R DEVELOPMENTCORETEAM(2009)R: A language and environment for statistical computing.R Foundation for Statistical Computing, Vienna, Austria. http://www.r-project.org/.
RHODES, J. R., MCALPINE, C. A., LUNNEY, D. & POSSINGHAM, H. P. (2005) A spatially explicit habitat selection model incorporating home range behavior.Ecology86: 1199–1205. SERGIO, F. & BOGLIANI, G. (2001) Nest defense as parental care in the northern hobby (Falco
subbuteo).The Auk118(4): 1047–1052.
SERGIO, F., PEDRINI, P. & MARCHESI, L. (2003) Adaptive selection of foraging and nesting habitat by black kites (Milvus migrans) and its implications for conservation: a multi-scale approach. Biological Conservation112: 351–362.
SERRANO, D., ORO, D., URSÚA, E. & TELLA, J. L. (2005) Colony size selection determines adult sur-vival and dispersal preferences: Allee effects in a colonial bird.The American Naturalist166: 22–31.
SERRANO, D. & TELLA, J. L. (2006) The role of despotism and heritability in determining settlement patterns in the colonial lesser kestrel.The American Naturalist169: 53–67.
SHEFFIELD, L. M., CRAIT, J. R., EDGE, W. D. & WANG, G. (2001) Response of American kestrels and gray-tailed voles to vegetation height and supplemental perches.Canadian Journal of Zo-ology79(3): 380–385.
TELLA, J. L., FORERO, M. G., HIRALDO, F. & DONAZAR, J. A. (1998) Conflicts between lesser kes-trel conservation and European agricultural policies as identified by habitat use analyses. Con-servation Biology12(3): 593–604.
TOLONEN, P. & KORPIMÄKI, E. (1994) Determinants of parental effort: a behavioural study in the Eurasian kestrel, Falco tinnunculus.Behavioral Ecology and Sociobiology35(5): 355–362. WHITE, G. W. & GARROT, R. A. (1990)Analysis of wildlife radiotracking data.Academic Press, San
Diego, California. 383 pp.
WIKLUND, C. G. (1990) Offspring protection by Merlin Falco columbarius females; the importance of brood size and expected offspring survival for defense of young.Behavioral Ecology and Sociobiology26(3): 217–223.
YOSEF, R. & GRUBBJR, T. C. (1993) Effect of vegetation height on hunting behavior and diet of log-gerhead shrikes.Condor95(1): 127–131.