Meteorol. Appl. 11, 265–275 (2004)
DOI:10.1017/S1350482704001343Pollutant transport schemes integrated in a
numerical weather prediction model: model
description and verification results
J´er ˆome Chenevez, Alexander Baklanov & Jens Havskov Sørensen
Danish Meteorological Institute (DMI), Meteorological Research Division, Lyngbyvej 100,
DK–2100 Copenhagen Ø, Denmark
Emails: [email protected], [email protected], [email protected]
Regional air pollution models are usually off-line coupled with numerical weather prediction models.
The present study, however, focuses on on-line coupled modelling, for which the air pollution model is
an integral part of the meteorological model. To this purpose, simulations of the first European Tracer
Experiment (ETEX), which supplies the best suited verification data for dispersion modelling of a
passive tracer, have been performed using versions of the Danish Meteorological Institute High
Resolution Limited-Area Model (DMI-HIRLAM). Simulation results have been compared with
observed values as well as with results from other models.
The operational version of DMI-HIRLAM using well-known basic advection schemes has been tested,
showing the need for improvements for air pollution purposes. The fourth-order Bott algorithm for
advection has thus been implemented in the semi-Lagrangian version of DMI-HIRLAM. Due to its
practically perfect mass conservation properties and its low computational cost, this method turns out to
be efficient for simulations of transport of pollutants in the atmosphere. This represents a first effort
towards a fully integrated air pollution model, e.g. for forecasting purposes.
1. Introduction
Eulerian atmospheric long-range dispersion models which are used to predict air pollution episodes may be coupled either off-line or on-line with numerical weather prediction (NWP) models. The latter case is also called integrated modelling. Most atmospheric pollution models are not coupled on-line with NWP models. However, on-line coupling of NWP and air pollution/chemistry transport models (CTM) probably has much potential, and it is likely that in the foreseeable future this will be a basic method for atmospheric environmental prediction as well as for weather and climate change forecasting. This applies especially to aerosol–climate interactions, NWP of special events, and modelling of urban climates.
Historically, air pollution forecasting and NWP were developed separately. This was reasonable in the previous decades when computers were less efficient and resolution of NWP models was poor for meso-scale air pollution forecasting. This situation has since changed owing to significant progress in atmospheric chemistry transport modelling and in modern NWP or meteorological models that approach meso- and city-scale resolution and use land-use databases with
a fine resolution. As a result, the conventional concepts of meso- and urban-scale air pollution forecasting need revision along the lines of integration of NWP and CTM. Accordingly, a number of national meteorological services work in the direction of chemical weather forecasting. Some European projects (e.g. FUMAPEX, COST Action 728) carry out research in integrated modelling. Within FUMAPEX, the Urban Air Quality Information and Forecasting Systems will include integration of NWP models with urban air pollution and population exposure models (Baklanov et al. 2002).
Local-scale transition processes (e.g. re-circulations and feedbacks) are important due to interaction with synoptic scale processes (e.g. fronts) with strong effects on atmospheric chemistry and pollution transport. Modern CTMs and aerosol deposition models demand more than available high-resolution meteorological data as input (Herrmann et al. 2000), such as moisture distribution, cloud characteristics (e.g. cloud water, top and base of a cloud), intensity and type of precipitation, radiation variables, etc. Existing meteorological pre-processors, based on off-line models (where access to meteorological fields is limited by model outputs and data exchange) cannot effectively provide large
amounts of information in the forecasting mode. In on-line coupled models, all meteorological fields of the NWP model are available for CTM at each time step, which makes the system more advanced and effective for forecasting. Furthermore, on regional scales the interaction of meteorology (e.g. cloud formation) and air chemistry and pollution transport (e.g. cloud nuclei, precipitation, thunderstorms) become significant. In this case, off-line coupling does not allow the study of the feedbacks of atmospheric pollutants on meteorological processes. On-line coupling would allow the implementation of ‘integrated’ physical and chemical parameterisation schemes.
With the perspective to develop such an integrated mesoscale air pollution forecast system, a version of the High Resolution Limited-Area Model (HIRLAM), which is a NWP model jointly developed by a number of institutes, and in operation at the Danish Meteorological Institute (DMI), has been implemented with advection/diffusion of passive tracers. The resulting model is called DMI-HIRLAM-TRACER (in the following shortened as TRACER).
A first step towards a fully integrated air pollution model consists of simulating the transport of passive tracers using a well-suited advection scheme involving reasonable computing costs. Indeed, the treatment of transport is of great importance for air pollution models, in which the advection scheme has to comply with positivity, monotonicity, mass conservation and low diffusion properties.
The Bott advection scheme (Bott 1989a, 1989b), which is well documented and broadly accepted in the air-pollution community, exhibits mass conservation properties and is computationally efficient, as verified by a number of standard computing tests showing very good results in comparison with many other common advection schemes (Costa 1997; Rivin & Voronina 1997; Sokol 1999). Using the Swedish version of the HIRLAM model, Ekman & K¨allen (1998) developed a method combining the numerical diffusion advantages of the Bott scheme with the fast computing properties of the semi-Lagrangian framework. They did not, however, verify their model against experi-mental data. In the present paper, the method of Ekman & K¨allen is for the first time confronted with measurement data. Furthermore, the method is compared with already available advection schemes in DMI-HIRLAM, and is applied to other numerical experiments.
A very suitable and realistic way of verifying the advection of a field of passive tracers versus a measure-ment data set is supplied by the first European Tracer Experiment (ETEX-1) performed in 1994. Since the ETEX campaign involved a passive tracer, we do not consider chemistry and deposition processes of air pollutants in the present paper.
The model formulation is briefly described in the next section. Details about the conditions of the numerical simulations of the ETEX release are given in section 3. Section 4 presents results of a simulation performed with the default version of DMI-HIRLAM in which the advection scheme is a Eulerian central difference algo-rithm. The same simulation with the semi-Lagrangian version of DMI-HIRLAM is presented in section 5, while the improvements obtained by using the Bott advection scheme are presented in section 6. The final section is devoted to discussion and concluding remarks.
2. Model formulation
The DMI-HIRLAM high-resolution meteorological forecast system (Sass et al. 2002) is used as a base for the implementation and improvement of the atmospheric pollutant transport modelling. The DMI-HIRLAM numerical weather prediction system is based on an extended version of the HIgh Resolution Limit Area Model (HIRLAM), version 4.7 (K¨allen 1996; Und´en et al. 2002). This model has been run operationally by DMI for the European and Arctic regions since 1990. The operational system consists of four nested models called DMI-HIRLAM-G, -N, -E, and -D. These models differ first of all by the horizontal resolutions and integration domains (D version: 0.05◦, N and E versions: 0.15◦ and G version: 0.45◦). The vertical coordinate is the terrain-influenced hybrid coordinate (Simmons & Burridge 1981) currently involving 31 levels, which are located at heights of 33, 106, 188, 308, etc. metres above ground for a standard atmosphere. The data assimilation is intermittent, and it is based on the 3-DVAR scheme (Gustavsson et al. 2001). The NWP forecasting system is run on a NEC-SX6 supercomputer system in connection with a number of scalar computers.
The forecast model applies numerical approximations to the governing equations of the atmosphere. They are derived from momentum, energy and mass conser-vation. The ideal gas law, relating density to pressure and temperature, is applied in the atmosphere. The influence of the variable amount of water vapour and cloud substance (cloud water/ice) is taken into account in the ideal gas law for a dry atmosphere by replacing temperature by virtual temperature. In the model the hydrostatic approximation is used in combination with spherical rotated horizontal coordinates, and a hybrid vertical coordinate defined such that model levels become sigma surfaces (s= p/ps) and pressure
surfaces at the bottom and top of the atmosphere, respectively.
At the current stage we consider only passive pollutants in the air pollutant transport model. Therefore there is no feedback from the pollutants to the meteorological equations, and thus the advection-diffusion equation driving the dynamic evolution of the concentrationC
of a scalar field may be formulated as follows,
∂C
∂t = −∇(vC)+ ∇(K· ∇C)+Q+S, (1) wherevrepresents the advecting velocity vector field,K is a three-dimensional eddy diffusivity vector, andQand
Srepresent source and sink terms, respectively. For the simulation of the transport of a passive tracer as in the case of ETEX, no sink is involved, and correspondingly
S = 0. This equation is used in the same coordinate system as the other equations of the main model and is integrated in the DMI-HIRLAM system following the HIRLAM numerical algorithms and computer code structure (K¨allen 1996; Und´en et al. 2002).
The horizontal diffusion processes are estimated by an implicit linear fourth-order scheme (K¨allen 1996), and the vertical diffusion is computed by a local turbulent kinetic energy scheme known as the CBR method (Cuxart et al. 2000).
From the source term of Eq. (1), and using theleapfrog
time integration method, the value of the concentration at time t+t in the grid box inside which the emission is performed can be obtained by
Ct+t =2t·Q(t)+Ct−t, (2) which involves the emission parameter,Q, depending on the volume of the grid box of emission. Hence, during the emission phase, the value of the concentration at the point of emission is forced by Eq. (2).
The numerical algorithms and schemes used for the tracer advection will be discussed in the following chapters 4, 5 and 6.
3. Simulations of the ETEX release
The ETEX campaign consisted of a constant-rate release starting on 23 October 1994, 16:00 UTC, in Brittany (France) and lasting for 11 hours and 50 minutes. The release location was (2.0083◦W, 48.0583◦N) at 8 m above ground. The total amount of material released was 340 kg of Perfluoro-Methyl-Cyclo-Hexane (PMCH) corresponding to an emission rate of 7.95 g/sec. The released material was detected over three days by a network of 168 measurement stations set up mainly at WMO synoptic stations in Europe from which it is possible to derive the plume evolution (Graziani et al. 1998).
The present numerical simulations start four hours before the beginning of the ETEX release by using initial boundary files generated by the European Centre for Medium-Range Weather Forecasts (ECMWF) from October 23 1994, 12:00 UTC. The simulations, which cover a period of three days, were carried out by updating the lateral boundaries every six hours (using
six-hour forecasts and new analyses every twelve hours). The numerical simulations were performed with TRACER over a model region covering Europe using a horizontal grid with 92×86 points yielding a horizontal resolution of 0.4◦ (about 42 km×44 km), and using a 31-level vertical resolution in a hybrid coordinate system (Sass et al. 2002).
The quality of the performance of these simulations is given by (1) the geographical distribution of the tracer concentration on the surface (more precisely at the lowest model level, about 30 m above the ground in the present version of TRACER) at different forecast times after the start of the release; (2) time series of time-averaged concentrations at specific geographic locations corresponding to the ETEX measurements sites; and (3) the evolution of the total mass in the model relative to the mass emitted at the release location. For (1) and (2) direct comparisons can be made with the measured data (Graziani et al. 1998) as well as with results of other models (cf. e.g. Sørensen 1998; Sørensen et al. 1998; D’Amours 1998; and Robertson et al. 1999), while (3) allows an evaluation of the mass conservation property of the scheme used.
Since the conditions of the controlled release (the geographic location, the release period and the constant rate of the release) are very accurately known, the main difficulty is to model such a point-source release inside a Eulerian grid point model. In the present study, a uniform distribution of the tracer is assumed within the volume of the grid box inside which the release is made.
4. Transport with the default advection
scheme of DMI-HIRLAM
Initially, simulations of the ETEX release have been performed using the default DMI-HIRLAM formulation of Eq. (1) for the transport of a scalar. In this formulation, advection is described by the Eulerian central finite-difference scheme in which negative values of positive-definite quantities are set to zero in order to avoid unrealistic negative concentrations (K¨allen 1996). The consequences of this resetting procedure will be discussed later.
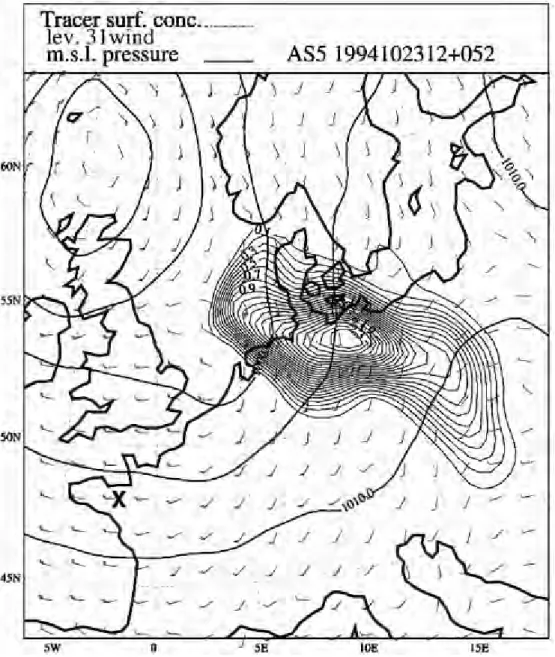
The modelled surface concentration at 48 hours after the start of the release is shown in Figure 1. The general shape and position of the plume resembles rather closely the observations made during the experiment (Graziani et al. 1998), though the horizontal diffusion seems to be too large.
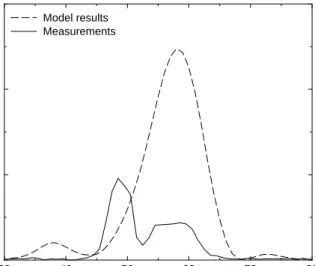
In Figure 2, measured (Sørensen et al. 1998) and modelled one-hour average surface concentrations at a sampling site located at the Risø National Laboratory in Denmark are compared. The time of the peak is fairly well predicted, but its value is more than twice the observed value, and the shape of the curve is too
Figure 1. Modelled surface concentration at 48 hours after the beginning of the release (52 hours after the start of the simulation) by using the Eulerian central difference advection scheme. The release point is marked by an X.
wide owing to diffusion and low grid resolution. The reason for this large value can be found in the inability of the model to conserve mass. This is shown in Figure 3, which presents the evolution of the mass of the passive tracer relative to the total mass released. The curve obtained with the present model shows an increase in the amount of the passive tracer of more than 1.5 times the total mass emitted, indicating that mass is not conserved during the simulation. Even after the emission phase is completed, the mass continues to increase linearly.
5. Advection with the semi-Lagrangian version
of DMI-HIRLAM
In the Lagrangian (SL) and two time-level semi-implicit framework (McDonald 1994), the emission
equation becomes
Ct+t=t·Q(t)+Ct. (3)
In the semi-Lagrangian advection scheme air parcels are tracked along trajectories back from predicted arrival grid points to departure points at each time step. Knowing the origin of the air parcel, its corresponding concentration value is found by interpolation from the concentration field at the previous time step. As for the Eulerian central finite-difference scheme, unrealistic negative values of positive-definite quantities are set to zero, and the CBR scheme has been applied to the vertical diffusion of the passive tracer. In the present simulation, however, horizontal turbulent diffusion is not used for the passive tracer field (the horizontal part of the second term in the RHS of Eq. (1) is not included) in order to avoid undesirable effects from the horizontal diffusion scheme. One of the major advantages of the
30 40 50 60 70 80 Time after start of release (hours)
0 1 2 3 concentration (ng/m3) Model results Measurements
Figure 2. Time variation of one-hour average surface
concentration at Risø (Denmark) obtained by using the Eulerian central difference advection scheme. The modelled concentration is interpolated from concentrations at model grid points. The background concentration has been subtracted from the measured values.
0 10 20 30 40 50 60 70 80
Time after start of simulation (hours) 0 50 100 150 200 250 300
Mass / total input mass (%)
Euler–CD SL SL–Bott
Figure 3. Time evolution of the total amount of tracer gas mass
in the model during ETEX simulations with three different advection schemes (Euler–CD: Eulerian central difference scheme; SL: semi-Lagrangian scheme; SL–Bott: Bott scheme implemented in the semi-Lagrangian time integration scheme).
semi-Lagrangian scheme is that the Courant-Friedrichs-Levy (CFL) criterion does not apply and thus longer time steps may be used.
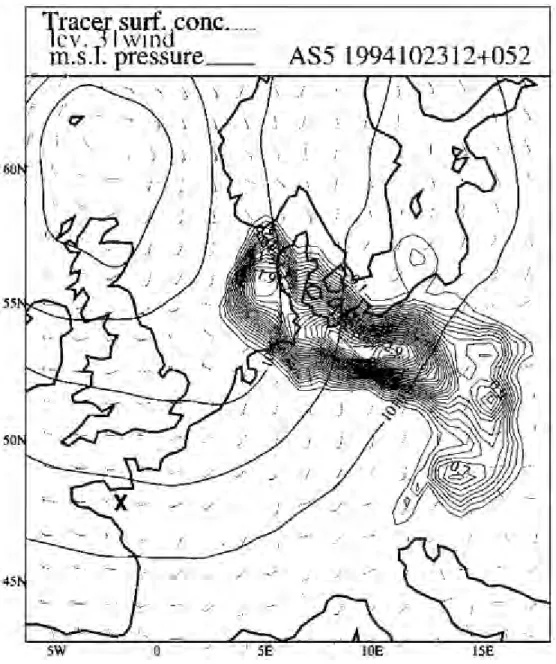
Figure 4 shows the surface concentration field at 48 hours after the beginning of the release. The plume is narrower than in Figure 1, which may be explained by the absence of horizontal diffusion. Apart from that, the results given by the semi-Lagrangian model resemble those obtained by the previous simulation, as can be seen from Figures 3 and 5 as regards mass conser-vation and time evolution of the concentration at Risø, respectively.
Semi-Lagrangian (SL) schemes are usually well suited to simulation of meteorological fields, but the existing SL schemes are not good enough for simulation of tracers, where the positive definition is very important.
6. Improvement of the advection
with the Bott scheme
6.1. Method
With the aim of improving the mass conservation of the model, a separate numerical scheme for the advection has been implemented in TRACER replacing the default advection scheme for the passive tracer field. The scheme described by Bott (1989a, 1989b) is a Eulerian advection scheme having flux conservation and positive definiteness properties. In the present work, the Bott scheme has been applied to the advection of the tracer in combination with the semi-Lagrangian dynamics of HIRLAM (Ekman & K¨allen 1998). This approach has the advantage of lengthening the integration time steps, and, accordingly, of reducing the computing time. The constant grid flux form of the Bott scheme is extended to the three dimensions by using the time-splitting method in which the one-dimension procedure is repeated circularly in each direction. The scheme uses fourth-order polynomials in the x and
y directions, and a second-order polynomial in the
z direction so as to save computing time due to the variable vertical grid spacing. In order to comply with the CFL criterion, the scheme is run three times inside one dynamic time step, and the CFL number is checked for each direction at each internal time step. As in the previous simulation, the horizontal diffusion scheme is not applied to the passive tracer field.
Though the Bott scheme requires a larger number of calculations, its combination with the semi-Lagrangian model yields a relatively low computational cost. This procedure needs 41% less computing time than the default DMI-HIRLAM formulation used in section 3, and only 8% more time than the pure semi-Lagrangian scheme.
6.2. Results
We do not consider here the standard tests for the Bott scheme, because these were previously carried out by several authors (Bott 1992; Rivin & Voronina 1997; Ekman & K¨allen 1998; Sokol 1999) showing promising results. Therefore the use of the Bott scheme for advection in TRACER has been evaluated by simulations of the ETEX release as in the two previous sections. One first result is the variation of the mass shown in Figure 3. In contrast to the previous simulations, the mass of the passive tracer remains approximately constant after the end of the emission phase. The behaviour of the mass of tracer during
Figure 4. Same as Figure 1, here obtained with the semi-Lagrangian scheme.
30 40 50 60 70 80 Time after start of release (hours)
0 1 2 3 concentration (ng/m3) Model results Measurements
Figure 5. Same as Figure 2, here obtained with the
semi-Lagrangian scheme.
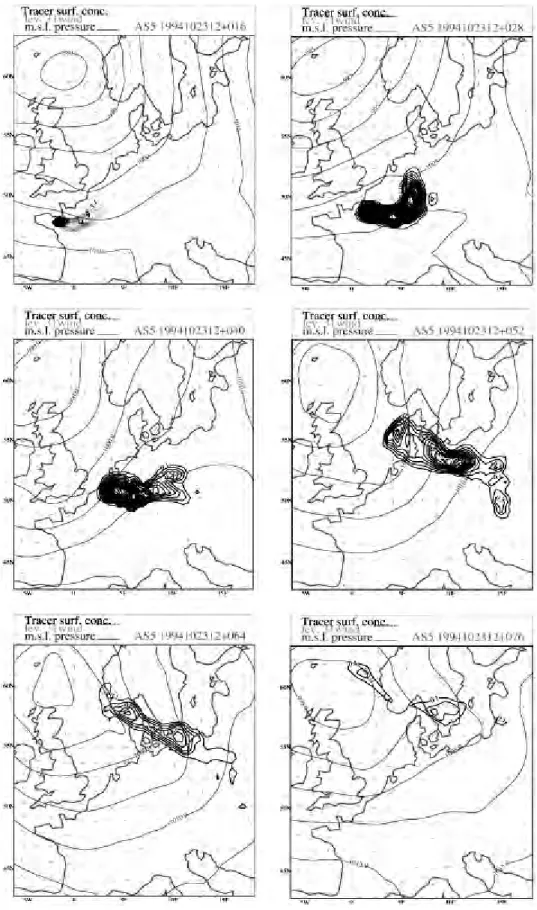
transport in the model confirms the major improvement obtained by using the Bott scheme as regards the mass conservation requirement. The corresponding surface concentration and velocity fields at every 12 hours are displayed in Figure 6. The time evolution of the modelled plume shows quite good agreement with the observed ETEX plume (cf. Graziani et al. 1998). As for Figures 2 and 5, the modelled surface concentration obtained at Risø by advecting the passive tracer with the Bott scheme is compared with measured data in Figure 7. The maximum concentration is much closer to the measured value than previously, but the arrival of the plume is a bit late. The reason may be found in the meteorological data used in this study (see discussion).
Figure 8 compares model results and three-hour average measurements at six other ETEX stations situated in
Figure 6. Time evolution (12, 24, 36, 48, 60, and 72 h after the release beginning) of the modelled surface concentration field obtained using the Bott advection scheme. The release point can be seen in the first plot.
France, Holland, Belgium, Germany, Denmark and the Czech Republic.
Table 1 presents a statistical analysis following the methodology used in the ETEX model evaluations
(Graziani et al. 1998). In this table global values of a number of parameters are given in order to compare the statistical performances of the three numerical simulations performed as described above. These statistical parameters include the normalised
30 40 50 60 70 80 Time after start of release (hours)
0 1 2 3 concentration (ng/m3) Model results Measurements
Figure 7. Same as Figure 2, here obtained using the Bott
advection scheme.
Table 1.Comparative statistical analysis of the model results
obtained with the three advection schemes used in this study: Eulerian central difference (CD), semi-Lagrangian (SL) and Bott combined with SL. The verification results are based on the tracer gas observations according to Graziani et al. (1998) and Mosca et al. (1998) using the definitions and terminology defined therein. The statistical parameters are ‘global’ in the sense that every measurement station and observation time is included. The parameters include the normalised mean square error (NMSE), bias, correlation, figure of merit in time (FMT), fractional bias and standard deviation, number of points within a factor of two (FA2) and five (FA5) from the experimental data, and the factor of exceedance (FOEX) (see Mosca et al. 1998 for definitions). Mean values and biases are expressed in units of ng/m3.
Statistical indices SL-Bott Euler-CD SL
NMSE: 94.4 15.6 66.4
Bias: 0.160 0.458 0.719
Pearson’s correlation: 0.643 0.679 0.669
FMT: 19.1% 24.4% 20.0%
Fractional bias: 0.493 0.968 1.191
Fractional stand. dev.: 1.858 1.595 1.909
FA2: 11.0% 15.1% 14.4%
FA5: 24.1% 35.4% 32.6%
FOEX: 0.69% 27.8% 29.2%
mean square error (NMSE), the bias, the Pearson correlation, the figure of merit in time (FMT), the fractional bias and standard deviation, the fractions of calculated values within a factor two (FA2) and five (FA5) of the measured values, and the fraction of predictions exceeding the corresponding observations (FOEX) ranging from −50% to +50%.
The interpretation of the statistical parameters is not trivial (Mosca et al. 1998). Despite the better numerical performances of the Bott scheme, the corresponding simulation does not have the first rank for statistical indices such as NMSE, correlation and FMT. This
may be due to small errors in the arrival time of the more localised plume, as shown in Figure 8. The default DMI-HIRLAM formulation (Eulerian central-difference scheme with horizontal diffusion) produces a broader plume, which, though producing too high concentration values, yields better statistical performance as regards NMSE, correlation and FMT. Both model plumes are transported (slightly) too slowly, which is attributed to a bias in the model wind. Thereby the less diffuse plume obtains a worse score (attributed to phase errors) in comparison with the unrealistically widespread plume.
7. Discussion and conclusions
Qualitatively, the Eulerian central-difference scheme, which is the default advection scheme of DMI-HIRLAM, and the semi-Lagrangian scheme have shown fairly good results compared with surface con-centration measurements and results from other models. However, these formulations do not respect the mass conservation criterion, which can be seen from the con-tinuous increase of the mass in the model after the end of the release. The reason for this increase is that unrealistic negative values may appear for quantities with sharp gradients, and in order to preserve positive-definite quantities, negative values due to non-monotonicity have here been set to zero. Such behaviour, even if it may not be consequential for simulations of the meteorolo-gical fields, is unacceptable for air pollution modelling, where mass conservation is of high importance, and the gradients are very large close to source locations. On the contrary, the Bott scheme presents mass conser-vation properties, which have been confirmed here by an almost perfect time evolution of the mass during advec-tion of a passive tracer in the model. The corresponding simulation also indicates that the Bott scheme exhibits low numerical diffusion. However, for the present sim-ulations the numerical diffusion seems to be at the same level as the physical horizontal diffusion, which thus justifies avoiding the use of horizontal turbulence here. As regards the shape and position of the plume, the surface concentration calculated by using the Bott scheme is in better agreement with the observations than for the simulation with the default DMI-HIRLAM formulation. However, despite the major improvement of the model regarding mass conservation, comparisons with measured data still show some discrepancies. For example, the model fails to reproduce the double-peak structure observed at Risø. This can be due to the relatively coarse resolution used here, i.e. meteorolo-gical fields of 0.4◦resolution, which is not sufficient to represent the mesoscale anticyclonic eddy causing the double peak, as shown by Sørensen et al. (1998). It has previously been shown that vertical turbulent diffusion has important effects and that results are
0 10 20 30 40 50 60 70 Time after start of release (hours)
0 1 2 3 concentration (ng/m3) Surface concentration at F15 Measurements Modelled results 0 10 20 30 40 50 60 70
Time after start of release (hours) 0 1 2 3 concentration (ng/m3) Surface concentration at NL01 Measurements Modelled results 0 10 20 30 40 50 60 70
Time after start of release (hours) 0 1 2 3 concentration (ng/m3) Surface concentration at B05 Measurements Modelled results 0 10 20 30 40 50 60 70
Time after start of release (hours) 0 1 2 3 concentration (ng/m3) Surface concentration at D05 Measurements Modelled results 0 10 20 30 40 50 60 70
Time after start of release (hours) 0 1 2 3 concentration (ng/m3) Surface concentration at DK02 Measurements Modelled results 0 10 20 30 40 50 60 70
Time after start of release (hours) 0 1 2 3 concentration (ng/m3) Surface concentration at CR03 Measurements Modelled results
Figure 8.Comparisons of 3-h average measurements and model results at six ETEX stations in France, Holland, Belgium,
Germany, Denmark, and the Czech Republic, respectively, from upper left to lower right (cf. Graziani et al. 1998 for the exact locations of the ETEX stations).
quite sensitive to this (Chenevez 2000). The vertical diffusion scheme (Cuxart et al. 1999) used here does not affect the mass conservation properties of the Bott scheme, and it is also used for cloud water in the DMI-HIRLAM model. Since horizontal diffusion processes
may play an important role in transport simulations (Desiato et al. 1998), we have additionally tried to use a fourth-order horizontal turbulent diffusion scheme (McDonald 1994) together with the Bott scheme. This diffusion scheme, however, does not conserve mass and
it corrupts the mass conservation property of the Bott scheme. It is thus preferable at this stage to avoid adding horizontal diffusion in simulations using the Bott scheme with such space resolution, unless the diffusion scheme is formulated in a way that compensates for the small numerical diffusion inherent in the Bott scheme. For long-range transport simulations using a coarse grid resolution, the horizontal turbulent diffusion term does not, in general, require careful attention and can sometimes be omitted due to sufficient numerical diffusion. However, for more accurate numerical advection schemes using higher resolution of horizontal grids, an elaborate algorithm for the horizontal turbulent diffusion is required.
The non-conservation of mass for the otherwise quite promising and economical semi-Lagrangian scheme requires further improvements. This is because of effects on other fields as well, e.g. temperature, water content and humidity. The solution to this problem can be a correction of the negative values of the scalar, for example using filtering or interpolation techniques, taking into account the conservation property (e.g. Pudykiewicz et al. 1997).
Machenhauer & Olk (1997) have developed another advanced method, the cell-integrated semi-Lagrangian (CISL) approach, which involves exact conservation of integral invariants. More recently, Walcek (2000) has derived a competitive advection scheme, which combines mass conservation with less numerical diffu-sion and computational time than the Bott scheme. The principal outcomes of the present work are: (1) The development of an on-line coupled
(integ-rated) model of NWP and atmospheric pollution and its application to passive pollutant transport under the conditions of the ETEX experiment, and verified against the ETEX measurements.
(2) A demonstration that the Bott scheme imple-mented in the semi-Lagrangian scheme consumes only 1.08 times more computational time than the semi-Lagrangian scheme itself, and that it is 1.6 times faster than the Eulerian central-difference scheme.
The present paper has shown that the TRACER model including an accurate mass conserving advection scheme can be used for transport simulations. Further improvements of this integrated model will include deposition and chemical transformation or radioactive decay processes which can be employed in air pollution forecasting. In the same way as the transport of a passive tracer needs a mass conserving advection scheme, the complete modelling of the transport of an interacting pollutant, for example, will need the supplementary use of accurate deposition and chemical transformation schemes in order to minimise the numerical errors.
Acknowledgements
The authors are grateful to Annica Ekman, Department of Meteorology, Stockholm University (MISU), who has supplied the code for the Bott scheme. Thanks are also due to our colleague Jess U. Jørgensen for helpful advice.
References
Baklanov, A., Rasmussen, A., Fay, B., Berge, E. & Finardi, S. (2002) Potential and shortcomings of numerical weather prediction models in providing meteorological data for
urban air pollution forecasting.Water, Air and Soil Pollution
Focus2(5–6): 43–60.
Bott, A. (1989a) A positive definite advection scheme obtained
by non-linear renormalization of the advective fluxes.Mon.
Wea. Rev.117: 1006–1015.
Bott, A. (1989b) Reply.Mon. Wea. Rev.117: 2633–2636.
Bott, A. (1992) Monotone flux limitation in the
area-preserving flux-form advection algorithm.Mon. Wea. Rev.
120: 2592–2602.
Chenevez, J. (2000) Advection experiments with
DMI-HIRLAM-TRACER.DMI Scientific Report00-05; http://
www.dmi.dk/f+u/publikation/vidrap/2000/Sr00-05.pdf. Costa, A. A. (1997) Bott’s area-preserving flux-form advection
algorithm: extension to higher orders and additional tests.
Mon. Wea. Rev.125(8): 1983–1989.
Cuxart, J., Bougeault, P. & Redelsperger, J.-L. (2000) A turbulence scheme allowing for mesoscale and large
eddy simulations.Q. J. R. Meteorol. Soc.126: 1–30.
D’Amours, R. (1998) Modelling the ETEX plume dispersion
with the Canadian emergency response model. Atmos.
Environ.32: 4335–4341.
Desiato, F., Anfossi, D., Trini Castelli, S., Ferrero, E. & Tinarelli, G. (1998) The role of wind field, mixing height and horizontal diffusivity investigated through two Lagrangian
particle models.Atmos. Environ.32: 4157–4165.
Ekman, A. & K¨allen, E. (1998) Mass conservation tests with the HIRLAM semi-Lagrangian time integration scheme.
HIRLAM Technical ReportNo. 39.
Graziani, G., Klug, W. & Mosca, S. (1998) Real-Time Long-Range Dispersion Model Evaluation of the ETEX First Release, EUR 17754 EN. Available from the Office for Official Pub. of the European Communities, Luxembourg. ISBN 92-828-3657-6.
Gustavsson, N., Berre, L., H ¨ornquist, S., Huang, X.-Y., Lindskog, M., Navascues, B., Mogensen, K. S. & Thorsteinsson, S. (2001) Three-dimensional variational data-assimilation for a limited area model. Part I: General
formulation and the background error constraint. Tellus
53A: 425–446.
Herrmann, H., Ervens, B., Jakobi, H-W., Wolke, R., Nowacki, P. & Zellner, R. (2000) CAPRAM.3: A chemical aqueous phase radical mechanism for tropospheric chemistry.
J. Atmos. Chem.36(3): 231–284.
K¨allen, E. (1996) HIRLAM documentation manual, System 2.5. Available from SMHI, Norrk ¨oping, Sweden.
Machenhauer, B. & Olk, M. (1997) The implementation of the semi-implicit scheme in cell-integrated semi-Lagrangian models. In: Numerical Methods in Atmospheric and
Ocea-nic Modelling—The Andre J. Robert Memorial Volume,
pp. 103–126, ottawa, Canada, CMOS/NRC Research Press. McDonald A. (1994) The HIRLAM two time level, three dimensional semi-Lagrangian, semi-implicit, limited area,
grid point model of the primitive equations. HIRLAM Technical ReportNo. 17, SMHI, Norrk ¨oping, Sweden. Mosca, S., Graziani, G., Klug, W., Bellasio, R. & Bianconi,
R. (1998) A statistical methodology for the evaluation of long-range dispersion models: an application to the ETEX
exercise.Atmos. Environ.32: 4307–4324.
Pudykiewicz, J. A., Kallaur, A. & Smolarkiewicz, P. K. (1997)
Semi-Lagrangian modelling of tropospheric ozone.Tellus
49B: 231–248.
Rivin, G. & Voronina, P. V. (1997) Aerosol transfer in the
atmosphere: selection of a finite diference scheme.Atmos.
Oceanic Opt.10(6): 386–392.
Robertson, L., Langner, J. & Engardt, M. (1999) An
Eulerian limited-area atmospheric transport model.J. Appl.
Meteorol.38: 190–210.
Sass, B. H., Nielsen, N. W., Jørgensen, J. U., Amstrup, B., Kmit, M. & Kristian Sten Mogensen, K. S. (2002) The
operational HIRLAM system – 2002 version.DMI
Tech-nical report 02-05. http://www.dmi.dk/f+u/publikation/ tekrap/2002/Tr02-05.pdf.
Simmons, A. J. & Burridge, D. M. (1981) An energy and
angular momentum conserving vertical finite-difference
scheme and hybrid vertical coordinates.Mon. Wea. Rev.
109: 758–766
Sokol, Z. (1999), Comparison of several numerical schemes
applied to advection equations,Quarterly Journal of the
Royal Meteorological Society,125(553 part A): 213–224. Sørensen, J. H. (1998) Sensitivity of the DERMA long-range
dispersion model to meteorological input and diffusion
parameters.Atmos. Environ.32: 4195–4206.
Sørensen, J. H., Rasmussen, A., Ellermann, T. & Lyck, E. (1998) Mesoscale influence on long-range transport –
evidence from ETEX modelling and observations.Atmos.
Environ.32: 4207–4217.
Und´en, P., Rontu, L., J¨arvinen, H., Lynch, P., Calvo, J., Cats, G., Cuhart, J., Eerola, K. et al. (2002)
HIRLAM-5 Scientific Documentation. December 2002,HIRLAM-5
Project Report, SMHI, Norrk ¨oping, Sweden.
Walcek, C. J. (2000) Minor flux adjustment near mixing ratio extremes for simplified yet highly accurate monotonic
calculation of tracer advection.J. Geophys. Res.105: 9335–