Robust structural damage
detection by using statistical
hybrid algorithms
By
Jhonatan Camacho Navarro
ADVERTIMENT La consulta d’aquesta tesi queda condicionada a l’acceptació de les següents condicions d'ús: La difusió d’aquesta tesi per mitjà del r e p o s i t o r i i n s t i t u c i o n a l UPCommons (http://upcommons.upc.edu/tesis) i el repositori cooperatiu TDX ( h t t p : / / w w w . t d x . c a t / ) ha estat autoritzada pels titulars dels drets de propietat intel·lectual únicament per a usos privats emmarcats en activitats d’investigació i docència. No s’autoritza la seva reproducció amb finalitats de lucre ni la seva difusió i posada a disposició des d’un lloc aliè al servei UPCommons o TDX. No s’autoritza la presentació del seu contingut en una finestra o marc aliè a UPCommons (framing). Aquesta reserva de drets afecta tant al resum de presentació de la tesi com als seus continguts. En la utilització o cita de parts de la tesi és obligat indicar el nom de la persona autora.
ADVERTENCIA La consulta de esta tesis queda condicionada a la aceptación de las siguientes condiciones de uso: La difusión de esta tesis por medio del repositorio institucional UPCommons (http://upcommons.upc.edu/tesis) y el repositorio cooperativo TDR (http://www.tdx.cat/?locale- attribute=es) ha sido autorizada por los titulares de los derechos de propiedad intelectual únicamente para usos privados enmarcados en actividades de investigación y docencia. No se autoriza su reproducción con finalidades de lucro ni su difusión y puesta a disposición desde un sitio ajeno al servicio UPCommons No se autoriza la presentación de su contenido en una ventana o marco ajeno a UPCommons (framing). Esta reserva de derechos afecta tanto al resumen de presentación de la tesis como a sus contenidos. En la utilización o cita de partes de la tesis es obligado indicar el nombre de la persona autora.
WARNING On having consulted this thesis you’re accepting the following use conditions: Spreading this thesis by the i n s t i t u t i o n a l r e p o s i t o r y UPCommons (http://upcommons.upc.edu/tesis) and the cooperative repository TDX (http://www.tdx.cat/?locale- attribute=en) has been authorized by the titular of the intellectual property rights only for private uses placed in investigation and teaching activities. Reproduction with lucrative aims is not authorized neither its spreading nor availability from a site foreign to the UPCommons service. Introducing its content in a window or frame foreign to the UPCommons service is not authorized (framing). These rights affect to the presentation summary of the thesis as well as to its contents. In the using or citation of parts of the thesis it’s obliged to indicate the name of the author.
ROBUST STRUCTURAL DAMAGE DETECTION BY USING STATISTICAL
HYBRID ALGORITHMS
This dissertation is submitted for the degree of
Doctor in Civil Engineering
By
Jhonatan Camacho Navarro
Supervised by
Dr. Magda Liliana Ruiz Ordóñez
Dr. Rodolfo Villamizar Mejía
Escuela de Caminos (ETSECCPB)
Universitat Politècnica de Catalunya
Barcelona, Spain
March 2019
II
I would like to dedicate this thesis to my wife, for they love, endless support and
III
Declaration
I hereby declare that except where specific reference is made to the work of others, the contents of this dissertation are original and have not been submitted in whole or in part for consideration for any other degree or qualification in this, or any other university. This dissertation is my own work and contains nothing, which is the outcome of work done in collaboration with others, except as specified in the text and Acknowledgements.
Jhonatan Camacho Navarro
March 2019
IV
Acknowledgements
I would like to acknowledge to my supervisors Professors Magda Ruiz and Rodolfo Villamizar without whom this work would not have been possible. I would like to thank them for encouraging my research and for allowing me to grow as a research scientist. I will appreciate all they have done for me forever. I owe my deepest gratitude to Control, Dynamics and Applications (CoDAlab) and its all members, especially to professor Luis Mujica for all valuable comments, suggestions and feedbacks to complete this thesis. Also, I would like to show my greatest appreciation to reviewers of my thesis for their brilliant comments, suggestions and feedbacks.
Special thanks to the Colombian government through its department Colciencias and the Spanish Ministry of Economy and Competitiveness for the partial fund that allowed me to complete this thesis as a collaborative work between the "Universidad Industrial de Santander –UIS- (Colombia)" and "Universitat Politécnica de Catalunya -UPC- (Spain)".
Finally, I would like to thank to researchers from the department of aerospace materials and processes in the Universidad Politécnica de Madrid, Spain, and to the Department of sensors in the Ikerlan Research Center, Spain, for their collaboration in some experimentation.
V
ABSTRACT
This thesis presents the results of applying a statistical hybrid approach for structural health monitoring using piezo actuating signals. Where, by combining statistical processing based on Principal Component Analysis (PCA), cross-correlation functions and pattern recognition methods it was possible to detect, classify and locate damages under varying environmental conditions and possible sensor faults. The proposed methodology consists of first transmiting/sensing guided waves along the monitored structure surface by using piezoelectric (PZT) devices. Then, cross-correlated piezoelectric signals are statistically represented by means of a PCA model. Later, damages are identified through error indexes computed from a statistical baseline model. Finally, clustering methods and scattered plots are used to verify the performance of the proposed algorithm. Improved or new techniques are presented in this thesis which were focused to achieve more reliable diagnosis with high robustness and good performance. Specifically, differential genetic algorithms are used for automatically tuning parameters in a PCA-SOM damage detection/classification approach. Additionally, Ensemble Learning is explored as approach for obtaining more efficient diagnosis with high separable boundaries between undamaged and damage conditions taking advantages of learner algorithms built from Non-Linear PCA and a Multiactuacting active scheme of piezodiagnostics. Also, a modified version of the Reconstruction Algorithm for Probabilistic Inspection of Damage – RAPID is implemented to solve location tasks in SHM. The proposed methodology was experimentally evaluated on different structures such a a carbon-steel pipe loop, a laminate plate, aircraft wings and a scale tower wind, among others; where different damage scenarios were studied, including leaks scenarios, mass adding and cuts. The effectiveness of the proposed methodology to detect, locate and classify damages under varying environmental and operational conditions is demonstrated. Likewise, the feasibility for continuous monitoring is validated by embedding the code of the proposed algorithm whose capacity to detect structural damages was demonstrated. As a result, the combination of piezodiagnostics approach, cross-correlation analysis, principal component analysis, clustering techniques and Ensemble Learning become as promising solution in the field of structural health monitoring and specifically to achieve a robust solution for damage detection and location.
VI TABLE OF CONTENTS
1. Introduction ... 1
1.1. Research Framework and motivation ... 1
1.2. Objectives ... 1
1.2.1. Main Objective ... 1
1.2.2. Specific Objectives ... 2
1.3. Outline of the main contributions of this thesis ... 2
1.4. Organization of the thesis ... 3
2. Theoretical research overview ... 5
2.1. Structural Health Monitoring principles and concepts ... 5
2.2. Piezo-diagnostics approach for damage assessment ... 6
2.3. Damage detection by using principal component analysis ... 7
2.3.1. Data Organization ... 7
2.3.2. Data normalization ... 7
2.3.3. Optimal basis representation ... 8
2.3.4. Baseline modeling ... 9
2.3.5. Condition monitoring ... 9
2.3.6. The non-linear approach ... 11
3. Data preprocessing based on Cross-correlation functions. ... 13
3.1. Cross-correlation analysis for PZT signals ... 13
3.2. Condition monitoring approach ... 15
3.3. Proof of concept: Experimental setup ... 15
3.3.1. Pipe section... 15
3.3.2. Aircraft wing structure ... 16
3.3.3. Turbine blade structure ... 17
3.4. Results and Discussion ... 18
3.4.1. Data cleansing and filtering ... 18
3.4.2. Data anomaly detection ... 19
3.4.3. Structural damage detection ... 21
4. A Data-driven Approach Based on Clustering Techniques for Damage Classification ... 28
4.1. Structural Damage Classification Methodology ... 28
VII
4.3. Proof of concept ... 30
4.3.1. Damage Classification in Aircraft Wings ... 30
4.3.2. Pipe Leaks Classification ... 32
5. Parameters automatic tuning of structural damage detection algorithms ... 36
5.1. Automatic parameter tuning of a SOM damage assessment approach ... 37
5.2. Validation on a turbine blade structure ... 38
5.3. Validation on a pipeline structure ... 43
6. Environmental conditions treatment through augmented baseline models... 47
6.1. Environmental influence for structural damage identification. ... 47
6.2. Methodology for structural damage identification under environmental influence. 48 6.3. Experiment design ... 49
6.3.1. Humidity and Temperature Conditioning ... 49
6.3.2. Pipe loop description ... 50
6.4. Experimental results ... 51
7. Implementation of a Piezodiagnostics approach for damage detection based on PCA in a Linux-based embedded platform ... 55
7.1. Architecture of the proposed piezo-diagnostics system ... 55
7.2. Hardware design ... 56
7.2.1. Signal conditioning and acquisition system ... 57
7.2.2. Embedded platform ... 57
7.3. Algorithm programming ... 58
7.4. Structural damage continuous monitoring ... 59
7.4.1. Experiment description ... 59
7.4.2. Results and performance for damage assessment ... 61
7.5. Results and validation of embedded platform for damage assessment ... 62
7.5.1. Piezo-diagnoster Hardware performance ... 63
7.5.2. Reversible damage assessment in a pipe section ... 64
7.5.3. Leak detection in a pipe loop ... 66
8. Structural damage identification through an innovative hybrid ensemble approach ... 69
8.1. Ensemble learning as approach for SHM ... 69
8.2. Learning algorithm based on multi-actuating method ... 71
8.3. Damage Location by using adapted RAPID algorithm ... 72
VIII
8.4.2. Robust damage detection ... 76
8.4.3. Damage location ... 78
9. Study of damage index performance for sensor fault detection in a damage detection approach based on piezo-diagnostics ... 81
9.1. Methods and procedure ... 81
9.2. Experimental set-up and structure conditioning ... 82
9.2.1. PZT fault scenarios ... 83
9.2.2. Structural damage scenarios ... 84
9.3. Results and discussion ... 84
10. Conclusions and future work ... 87
10.1. Concluding remarks ... 87
10.1.1. Preprocessing based on cross-correlation ... 87
10.1.2. Clustering approach for damage classification ... 88
10.1.3. Automatic tuning of structural damage detection algorithms- ... 88
10.1.4. Environmental conditions treatment through augmented baseline models. ... 88
10.1.5. Implementation of PCA damage detection for continuous monitoring in an embedded platform ... 88
10.1.6. Analysis of PZT fault sensor scenarios in the PCA-based damage detection approach ... 89
10.1.7. Ensemble learning as approach for damage detection and location... 89
10.2. Suggestions for future work ... 89
REFERENCES ... 90
Appendix A. List of Publications ... 93
A1. Journals ... 93
A.2. Conferences ... 93
A.3. Collaborative work ... 95
1
Chapter 1
1.
Introduction
1.1.
Research Framework and motivation
"Structural Health Monitoring (SHM) is the integration of several systems or devices: sensory, data acquisition, data processing and archiving, communication, damage detection and modelling, in order to acquire knowledge about the integrity and load worthiness of in-service structures on either a temporary or continuous basis" [1]. In general terms, according to Farrar and Worden [2], SHM can be defined as the process of implementing a damage identification strategy for engineering structures, where damage refers to changes of the material and/or geometric properties of a structural system, that adversely affect the system's performance. Some of benefits by implementing a damage identification strategy through a SHM system are: avoidance of premature breakdowns, reduction of maintenance costs, continuous remote diagnosis and economic benefits in terms of an operational life extension. Many SHM approaches have been reported in literature [3], where a trade-off between efficiency and accuracy in the diagnosis is one of the main problems to be solved. It is desirable that SHM systems satisfy characteristics regarding to reliability, accuracy, robustness, and high sensitivity to the presence of damages [4], [5]. Thus, one of the main concerns in the field of SHM is the implementation of systems with the capability to continuously evaluate the health of a structure. Such systems should have the ability to manage uncertainty caused by operational and environmental conditions [6], facilitating the failure identification through algorithms with high performance levels (degree of damage diagnosis: detection, location, quantification and prognosis [2]) in order to reduce maintenance costs when continuous action is considered. The above requirements demand efficient hardware and software resource consumption since the high amount of data recorded when continuous SHM systems is achieved.
An adequate SHM system should meet the following characteristics:
Efficiency for identifying structural damages, taking into account that access to structure can be limited, and implementation and operation costs should be low.
Robustness to environmental changes, noisy data and sensor faults.
Capability to identify different damage types.
Offer facilities for practical implementation.
Thus, this thesis is devoted to present a robust approach for structural condition monitoring with the next features: Detection of multiple structural damages with implementation feasibilities, such as: automatic parameter tuning, easy results interpretation for diagnosis and low hardware requirements.
1.2.
Objectives
1.2.1.
Main Objective
The main objective of this thesis is to propose a robust structural damage detection algorithm based on statistical tools such as nonlinear PCA combined with ensemble classification, in order
2
to detect multiple damages in structures under varying environmental conditions and possible sensor faults.
1.2.2.
Specific Objectives
To achieve the main objective, the following specific objectives have been developed:
To study different approaches based on Principal Component Analysis, neural Networks and Genetic Algorithms, proposed to solve the damage detection problem in structures under environmental conditions.
To study different approaches of Nonlinear Principal Component Analysis and adapt it to the damage detection problem in order to evaluate its performance.
To evaluate evolutionary optimization techniques as tool for parameter tuning and sensitivity analysis in damage detection algorithms.
To evaluate ensemble learning approaches as solution to the multiple damage detection problem.
To conduct experiments on laboratory specimens and sections of complex structures, such as aircraft wing skin, scale wind generator, among others in order to test its sensitivity and specificity.
To recreate damages such as mass adding and leakages in a laboratory scale pipeline.
To code the proposed and previous algorithms developed by CoDAlab group on a final integrated system of easy implementation, where any determined piezoelectric can be chosen as actuator and the other ones as sensors.
To test the embedded system in structures such as lab scale pipelines, operating in continuous use.
1.3.
Outline of the main contributions of this thesis
This thesis was focused to contribute on the online identification of structural multi-damages problem by using algorithms with capability of processing experimental data obtained from real-scale structures under varying environmental conditions as well as monitoring state of sensors. In order to achieve this goal, a damage detection algorithm based on piezo-diagnostics approach and Principal Component Analysis (PCA) is implemented in a Linux-Based ARM hardware platform. The methodology proposed to detect structural damages consists of first obtaining a structural baseline model by applying PCA (linear and no linear) on a set of experiments from a pristine structure and then evaluating the current condition (Damaged or Undamaged) of the structure by comparing new measurements respect to the baseline model. In this sense, square prediction error index is used to detect deviations from undamaged condition. The methodology includes the use of SOM1 neural networks for visualization and damage classification purposes.
As a result, a robust methodology was obtained (low sensitivity to noisy measurements, sensor faults and several operational conditions) to address SHM tasks, with following novel features:
Computational resources related to memory and processor consumption were efficiently used as possible by means of a low cost implementation of Principal Component Analysis (PCA) through Proper Orthogonal Decomposition (POD) algorithm. Thus, the feasibility of continuous monitoring taking advantage of piezo diagnostics principle is
3
no longer major seatback due to the use of an embedded version of PCA damage detection algorithm.
Identification of atypical and noisy data, as well as management of data cleansing stages are facilitated by the implementation of a pre-processing stage based on cross-correlation analysis.
An augmented PCA baseline model, including environmental influences on the data variability, is used as alternative to deal environmental conditions regarding to temperature and humidity variations.
An automatic tuning of parameters is proposed by using a Differential Evolutionary Algorithm (DEA).
False alarms and missing report of the damage detection algorithm are minimized by improving the differentiation between damage and undamaged conditions through an ensemble learning scheme, where diagnosis from several subsystems are mixed to obtain a more distinguishable boundary defined by damage indexes.
Damage location is achieved by implementing an ensemble learning approach by combining the squared prediction error from sensor pairs with an adapted version of RAPID2 algorithm, demonstrating the capability to manage features diversity.
Robustness of damage detection was validated for two sensor fault conditions: debonding and wiring losses. It was demonstrated that sensor failure condition corresponds to atypical performance in the diagnosis response and high indices out or bellow of common values can be associated to failures in the connection system.
Alternative novel indices for damage detection were proposed by using errors between measured and reconstructed signals, which are combined in an ensemble framework in order to obtain a robust index with capabilities to detect structural damages in a more distinguishable way.
The feasibility of the system was verified by conducting laboratory experiments in several structures: a pipeline section, a pipe loop structure, two aircraft wings, a laminar structure of composite material and a scaled wind generator model. Thus, the suitability of the proposed methodology was shown in a great variety of structures.
Several damages scenarios were used to validate the performance of the proposed methodology, in order to detect reversible and non-reversible damages. Thus, the proposed algorithms have the capability of detecting and classifying damages such as mass adding, cuts and leak conditions.
According to above statements, in this thesis a hybrid formulation is proposed by combining ensemble learning, nonlinear statistical feature extraction and evolutionary based optimization, as an alternative method to classify multiple damage scenarios under environmental/operative structural varying conditions, with possible sensor fault monitoring and minimal false/missing diagnostics.
1.4.
Organization of the thesis
The present thesis is organized in ten chapters, starting with this introduction where the objectives, general results and research framework and the organization are described. The second chapter includes a theoretical background that covers a brief definition of the methods used in the proposed algorithms. The review covers selected aspects of Structural Health Monitoring (SHM) based on statistical methods (Principal Component Analysis - PCA) for
4
structural damage detection using baseline models obtained from piezoelectric measurements. Afterwards, the third chapter presents the use of cross-correlation signals to facilitate data cleansing, noise filtering and damage grouping. Thus, the advantages of including a preprocessing stage based on a cross-correlation technique for improving the overall performance of structural damage detection algorithms are detailed. The fourth chapter is devoted to present the proposed methodology for damage classification by means of unsupervised learning algorithms. For this purpose, clustering techniques are implemented in order to group different states of a structure, which allows building a damage classifier. In the five chapter, an approach for automatically tuning parameters of structural assessment algorithms is discussed. The automatic tuning is obtained by using differential evolutive algorithms due to its flexibility, which facilitates the adaptation of general data-driven methodologies for structural damage detection. In chapter six, a solution for the treatment of environmental conditions related to humidity and temperature changes is explained. In this chapter, a short review of the influences and methods for environmental conditions treatment are depicted, and it is also detailed how it can be managed through augmented baseline models. Chapter 7 contains design, test and specifications for a standalone inspection prototype developed on an embedded hardware platform. The following elements are shown: instrumentation equipment, computational core capability, programming procedure and practical considerations for the implementation of embedded approach of PCA-SHM algorithms. Chapter 8 analyzes the results of using Ensemble Learning as approach for SHM tasks: robust damage detection and damage location. Robust damage detection is achieved by combining several proposed damage indices taking into account errors between measured and reconstructed signals, which minimizes false alarms and missing reports. In order to determine the position of the damage in the structure, contributions of each transducer in the sensor network to each damage index are calculated and then merged by means of an adapted version of RAPID algorithm. Chapter 9 discusses the performance and sensitivity of PCA based damage detection for two sensor fault conditions: sensor debonding and wiring losses. Each chapter details the case studies and laboratory efforts on different structures that have performed in this survey. Finally, the last chapter presents the main conclusions of this thesis and some comments about the methodologies proposed and the obtained validation results. Moreover, this final chapter contains some proposal for future research and main pursued objectives to conclude this thesis.
5
Chapter 2
2.
Theoretical research overview
This thesis is focused on developing a hybrid multi damage identification approach by combining different techniques, damage features and classifiers in order to improve the overall damage identification performance. The developments are based on previous work explored by CoDAlab and CEMOS research groups at the UPC and UIS universities. In this chapter the fundamental concepts of previous algorithms are presented, which serve as technical support for the results in this thesis.
2.1.
Structural Health Monitoring principles and concepts
Structural Health Monitoring (SHM) can be defined as a strategy for detection, location and quantification of damages on several structures from mechanical, aeronautical to civil ones. In the last years, a special interest is noted for the condition monitoring of structures such as wings, bridges, oil pipes, towers and sea platforms among others, which are widely used in tasks related to mechanical, civil and aeronautical applications. As a result, new techniques have been developed in the field of SHM, in order to detect structural damages due to aging, overloads, fatigue or external disturbances. Thus, when damage is early detected, proper actions can be conducted to repair or reinforce structural elements that minimize accidents risk, economical losses, catastrophic events, and avoid possible human deaths. According to Ooijevaar [7], structural damage diagnosis algorithms include the elements summarized in figure 2.1.
Figure 2.1: Components of a SHM process for damage diagnosis according to Ooijevaar [7]
In figure 2.1, the sensor system obtains the signal signature describing the current state of the monitored structure. Then, data collected by the sensor network is characterized through features in order to get a sensible representation to damage conditions. These features are exploited by classification, regression or clustering algorithms with capability to identify abnormal conditions (i.e. possible damage). Thus, by implementing the scheme depicted in figure 2.1 the basic SHM levels can be achieved: Diagnosis constituted by damage detection (Level 1), location (Level 2) and quantification (Level 3), and prognostics by estimating the damage evolution (Level 4), where, feature extraction is the area with most attention in the literature [5]. Since SHM process requires features with high sensitivity, to distinguish between the undamaged and damage conditions, they should be robust to noisy measurements. Thus, feature extraction can be complemented by using data cleansing and pre-processing techniques in order to improve diagnosis response of whole system and consequently to minimize effects due to variable operational and environmental conditions as well as sensor drifts.
6
2.2.
Piezo-diagnostics approach for damage assessment
The high sensitivity of the guided-wave ultrasonic technique has been an advantage for structural health monitoring applications [8]. Guided waves have been extensively studied for damage detection and characterization in a wide range of industrial applications, including transportation and civil engineering [9]. In this sense, it has been demonstrated that guided waves can be easily generated by using Lead Zirconate Titanate piezoelectric devices (PZT).
Thus, several
researches have shown the feasibility of using PZT measurements for condition
monitoring
[10]
,
[11]
, and
[12]
.
Piezoelectric instrumentation is a cheap but effective technology for generating guided waves, which comprises PZTs, fine-tuning filters, high wide-band amplifiers and acquisition systems. According to figure 2.2, piezo-diagnostics principle is exploited through a piezoelectric active scheme to acquire the structural signature of current state condition. Thus, damage identification is based on the phenomenon of elastic waves propagation, where several piezo devices are attached along the surface of the structure to trace the elastic wave travelling. In this sense, a pitch-catch mode is configured to examine scattering, reflection, and mode conversion caused by discontinuities (figure 2.2).
Figure 2.2: Piezoelectric active configuration
According to figure 2.2, one of the piezoelectric devices is excited with a periodic high frequency burst type signal inducing a guide wave and the remaining piezo-devices are used as sensors to measure guided wave response at different locations of the structure. The most important parameters to be considered for generating guided waves are related to frequency and type of electric field excitation, coupling material for the bonding layer and recommendations for electrical connection of piezoelectric elements. Thus, the following experimentation conditions should be considered:
i. A burst type signal is applied to obtain a PZT`s actuator response near its resonance frequency (around 100 Khz). Since, this type of signal has finite duration and contains frequency components around a central band, a maximum amplitude can be guaranteed during the process.
ii. Adhesive Cyanoacrylate is used as coupling layer, which has a better performance than other materials due to repeatability of its waveform pattern and transmitted energy [13]. Also, the adhesive property makes it suitable for continuous monitoring tasks unlike other materials used for ultrasonic tests.
iii. General soldering procedure was done using APC instructions [14]. Due to some tests executed, it is recommended to use shielded and twisted pair wires to cancel external noise and it is highly recommended to build a circuit that works as interface between piezo-devices and electronic components
7
2.3.
Damage detection by using principal component analysis
The objective of PCA is to reduce the dimensionality of a data set by preserving the data variation as much as possible. In this sense, a large number of interrelated variables in a new reduced space of coordinates with minimal redundancy can be represented. This reduced representation serves to obtain a baseline model respect to a reference state or to reduce data features. Thus, PCA is a powerful statistical tool for data fusion and supervised learning [15].
In this work, PCA is used to represent piezoelectric signals in the reduced space, regarding the dynamical response of the structure in nominal state (no damage), which allows comparing respect to unknown states (possible damage).
2.3.1.
Data Organization
Piezoelectric measurement signals of each PZT sensor belonging to several repetitions of the undamaged structural state are organized in an unfolded data matrix (X) (figure 2.3).
Undamage
Exp 2
Exp N
PZT Sensor 1 PZT Sensor 2 PZT Sensor N
X=
Exp 1
Figure 2.3: Undamaged baseline Matrix 2.3.2.
Data normalization
The undamaged baseline matrix is normalized in order to avoid scaling and bias issues, and to reduce the influence of different sources of variability. In this work, normalization is computed by means of Group Scaling (GS) method, where each data-point from the undamaged baseline matrix (X) is scaled by considering changes between sensors and the nature of data by estimating standard deviation for each block of piezo measurements [16]. Thus, a normalized data matrix X̅
is obtained by standardizing X using the mean of each time sample for every experiment and the standard deviation of each sensor sample vector, where each 𝑥̅𝑖𝑗𝑘 element is determined by eq.
(2.1). Specifically, normalization is computed by using the standard deviation of data from each of the total J PZT sensors, and the mean values of each column of data matrix X with dimensions (M x JK) ( K is the number of time samples recorded in the i-th experiment repetition and M are the total of experiments.
𝜇̂𝑗𝑘 = ∑ 𝑥𝑀𝑖 𝑖𝑗𝑘 𝑀 ; 𝜎̂𝑗= ∑ ∑ 𝑥𝑀𝑖 𝐾𝑘 𝑖𝑗𝑘 𝑀∙𝐾 ; 𝑥̅𝑖𝑗𝑘 = 𝑥𝑖𝑗𝑘−𝜇̂𝑗𝑘 𝜎̂𝑗 (Eq. 2.1)
8
where 𝜎̂𝑗 is the standard deviation per PZT sensor and 𝜇̂𝑖𝑗 is the mean value per column of
undamaged baseline matrix X.
2.3.3.
Optimal basis representation
A set of 𝑟 basis vectors (P) that satisfies the extreme value problem stablished by eq. (2.2) in order to minimize the fitness function 𝜀2 [17] is used to find an optimal representation of
undamaged baseline matrix.
min 𝑃𝑖
𝜀2(𝑟) = E{‖X̅ − X̅(𝑟)‖2}
𝑠. 𝑡. 𝑃𝑖𝑇𝑃𝑗= δ𝑖,𝑗 𝑖, 𝑗 = 1,2, … , 𝑟 (Eq. 2.2)
The basis vector 𝑃 can be estimated by computing the singular value decomposition of the covariance matrix 𝐶𝑥 established by eq. (2.3), which can be solved by using NIPALS, POD or
QR procedures [18]
𝐶𝑥𝑃 = 𝑃𝜆, 𝑤ℎ𝑒𝑟𝑒 CX̅= 1 M−1X̅
TX̅ (Eq. 2.3)
where, 𝑀 is the number of trial records used to estimate the covariance matrix, and 𝜆 the respective eigenvalues. Singular value decomposition (SVD) procedures consume high computing resources and requires especial treatment when processing big data matrices. The classical algorithm to obtain the PCA matrix transformation consists of three main steps:
i. Estimate the covariance matrix of the normalized data-matrix
𝑋̅
:𝐶
𝑥̅=
1𝑛−1
(𝑋̅)(𝑋̅)
𝑇
(Eq. 2.4)
ii. Calculate the Eigenvectors-Eigenvalues of the covariance matrix.
iii. Select the first eigenvectors as the principal components. The transformation matrix P contains column vectors of the selected eigenvectors, while the model variance is described by the respective eigenvalues.
For obtaining the Eigenvectors-Eigenvalues of the step ii.) it is necessary to compute the singular value decomposition, where an Eigenvector is a nonzero vector that satisfies the eq. (2.5):
𝐴𝑣⃗ = 𝜆𝑣⃗ (Eq. 2.5)
Where, A is a square matrix, λ is a scalar, and 𝒗⃗⃗⃗ is the eigenvector. The eigenvalues and eigenvectors can be find by solving a matrix as a linear equations system. The covariance matrix is M x M size, thus it is necessary to determine M eigenvectors and M eigenvalues. However, because n ≪ M (n = JK) only n-1 eigenvalues are nonzero, the transformation matrix P consists of n-1 statistically significant principal components. The QR algorithm [19] is commonly used to obtain the singular value decomposition of a data-matrix expressed in eq. (2.5).
Since only n-1 eigenvalues are nonzero, alternative methods can be used to estimate the singular value decomposition of a data-matrix such a Proper Orthogonal Decomposition (POD) method. By applying POD, the normalized undamaged baseline matrix can be decomposed by eq. (2.6):
9
Where, U and V are called the left-singular vectors and right-singular vectors of 𝑋̅, respectively and Σ is a diagonal matrix with the nonzero singular values. If the left-singular vectors of 𝑋̅ are eigenvectors of 𝑋̅ 𝑋̅𝑇and the right-singular vectors of 𝑋̅ are eigenvectors of 𝑋̅𝑇𝑋̅, it is possible to
establish that:
𝑋̅𝑋̅𝑇 = (𝑈Σ𝑉𝑇)(𝑈Σ𝑉𝑇)𝑇 = 𝑈Σ𝑉𝑇𝑉Σ𝑇U𝑇 = 𝑈Σ2𝑈𝑇 (Eq. 2.7) 𝑋̅𝑇𝑋̅ = (𝑈Σ𝑉𝑇)𝑇(𝑈Σ𝑉𝑇) = 𝑉Σ𝑇U𝑇𝑈Σ𝑉𝑇 = 𝑉Σ2𝑉𝑇
According to classical procedure, the transformation matrix P corresponds to the singular value decomposition of 𝑋̅ 𝑋̅𝑇, thus it can be inferred from eq. (2.7) that U=P. By using eq. (2.6), the
transformation matrix can be computed as:
P ≡ 𝑋̅Σ−1𝑉 (Eq. 2.8)
In addition, it is noted that the non-zero singular values of 𝑋̅ are equal the square roots of the non-zero eigenvalues of both 𝑋̅𝑋̅𝑇 and 𝑋̅𝑇𝑋̅. In this sense, it is enough to find the singular value decomposition of 𝑋̅𝑇𝑋̅, with dimensions 𝑛 𝑥 𝑛 instead of 𝑋̅𝑋̅𝑇 with dimensions 𝑀 𝑥 𝑀. These relations reduce the computational cost required to compute the transformation matrix of the statistical model.
2.3.4.
Baseline modeling
A baseline model is obtained according to PCA procedure in eq. (2.9). The baseline model is a reduced representation of piezoelectric signals of the pristine structure, arranged in the undamaged baseline matrix (X), after the normalization procedure (X̅).
X̅ = 𝑇𝑃𝑇 + 𝐸 = 𝑚𝑜𝑑𝑒𝑙 + 𝑛𝑜𝑖𝑠𝑒 (Eq. 2.9)
where, the basis vectors P form the linear transformation matrix that relates the data matrix X̅ in the new coordinates and they are known as the principal components. T is the projected matrix to the reduced space and the noise E-matrix describe the residual variance neglected by the statistical model (eq 2.9.). The variances of this new coordinates reduced-space are the singular values (𝜆).
2.3.5.
Condition monitoring
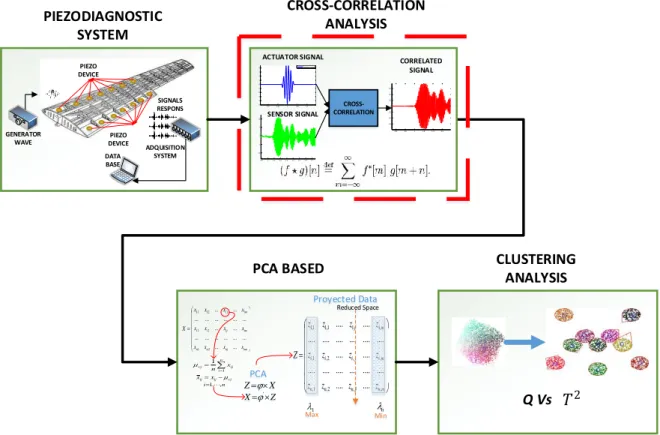
The integration of PCA for structural condition monitoring in the piezo-diagnostics approach is depicted in figure 2.4, where two main phases can be identified: Modeling and Monitoring. The modeling phase is the baseline model building by applying PCA to the undamaged baseline matrix, while monitoring phase refers to the projection of current piezoelectric measurements to the baseline model. Since current measurements stands for unknown structural states, a statistical index is computed to distinguish possible abnormal conditions, where abrupt changes of this index can be associated to a structural damage.
10 Figure 2.4: Damage condition monitoring approach
The methodology depicted in figure 2.4 has been previously validated on different structures: an aircraft turbine blade, an aircraft wing and an aircraft fuselage. However, a novelty of methodology to be presented in this thesis with respect to previous works, is the inclusion of cross correlation analysis as a tool for improving separation boundaries for damage conditions. Thus, cross-correlation between actuation and sensing piezo-signals is computed previous to the principal component analysis. The cross-correlation function between two signals 𝑋(𝑡) and 𝑌(𝑡)
is defined as: 𝑅𝑋𝑌(𝑡, 𝑡 + 𝜏) = lim 𝑁→∞ 1 𝑁∑ 𝑋𝑘(𝑡)𝑌𝑘(𝑡 + 𝜏) 𝑁 𝑘=1 (Eq. 2.10)
Where 𝑁 is the number of signal samples and 𝜏 is the lag time interval used to compute the cross-correlation function.
On the other hand, Q-index has shown to be successful in fault diagnosis systems, where distinguishable differences between baseline and current state are found, which is attributed to damage. Also, it is suitable for visualization purposes on 2D plots of different structural damage conditions and it can be easily adapted as input for supervised and unsupervised algorithms in order to obtain complementary results regarding to damage classification and quantification tasks
[20], [21]. The Q-statistic, defined by eq. (2.11), is a lack of fit measurement between the current experiment and the baseline records. The Q-values chart is obtained by computing the squared prediction error resulting from the reconstruction with the PCA model.
𝑄 = ∑ (𝑒𝑗) 2
𝑗 (Eq. 2.11)
where, 𝑒𝑗 is the residual error for each 𝑗 − 𝑡ℎ principal component used to reconstruct the trial
experiment. In general terms, error-based indexes like Q-index has been shown good results for damage detection compared to others such a hotelling T-squared. The Hoteling 𝑇2 statistic,
defined by eq. (2.12), indicates how far each trial is from the center (T = 0) of the reduced space of coordinates. Cross-correlation U n da m ag ed ca se M a tr ix Experiment PZT1 PZT2 PZTn C ur ren t M ea su rem en ts N Experiments PZT1 PZT2 PZTn Cross-correlation Pre-Processing Pre-Processing PCA TRAINING PCA PROJECTION
2 Monitoring Stage: STRUCTURAL DAMAGE DIANOSIS 1 Modeling stage: BASELINE MODEL BUILDING
SCORES INDEXES T² y Q SCORES INDEXES T² y Q Deviation corresponds to damage INTERPRETATION
11 𝑇2 = ∑ 𝑡𝑠𝑖𝑗2
𝜆𝑗 𝑟
𝑗=1 = 𝑇′𝜆−1𝑇 (Eq. 2.12)
The diagnostics is achieved by using visualization tools, which facilitate the interpretation of statistical indexes values. It is accomplished by means of scatter plots (𝑇2vs Q) or a clustering
technique. The scatter plot is an easy manner of representing the information obtained from the statistical damage indexes, however some type of damages and possible boundaries can be masked. For this reason, clustering is used as a complementary method to the graphical interpretation for classification purposes
2.3.6.
The non-linear approach
Kernel analysis
The basic idea of kernel PCA is to use a nonlinear kernel function k instead of the standard dot product [22]. Implicitly, it is performed PCA in a possibly high dimensional space F which is nonlinearly related to input space. In figure 2.5 it is portrayed the effects of using kernel functions as feature extraction method.
Figure 2.5: Kernel PCA [22]
The advantage of implementing kernel functions is their capability for turning nonlinearities into possible linearities, without knowing a priori the transformation function. Three kernels are commonly reported as successful for pattern recognition problems: polynomial, sigmoidal and radial base function (RBF). This work focuses on the RBF kernel, particularly, the Gaussian kernel (see eq. (2.13)), since this kernel is the most common in pattern recognition tasks with lower errors.
𝑘(𝑥, 𝑦) = e−‖𝑥−𝑦‖22𝜎2 (Eq. 2.13)
Where, x and y corresponds to experiments which contain the features in the input space, and sigma (𝜎) is the standard deviation estimated by using the measurement samples. As a novel measurement, it is used the reconstruction error in feature space [23] calculated by using eq. (2.14):
𝑝(𝑧) = 𝑝𝑠(𝑧) − ∑𝑞 𝑓𝑙(𝑧)2
𝑙=1 (Eq. 2.14)
Where, 𝑝𝑠(𝑧) is the squared distance from the mapping space to the center of the new higher-dimensional feature space and 𝑓𝑙(𝑧) is the projection of centered data onto the 𝑞 eigenvectors evaluated using the kernel function.
12
Auto-associative Neural Networks
Nonlinear PCA can be achieved by using a neural network with an auto-associative architecture, also known as auto-encoder, replicator network, and bottleneck or sandglass type network [24]. Such auto-associative neural network is a multi-layer perceptron that performs an identity mapping, meaning that the output of the network is required to be identical to the input (see figure 2.6). However, the middle of the network is a layer that works as a bottleneck, where a data dimension reduction is enforced. This bottleneck-layer provides the desired component value (scores).
Figure 2.6: Auto-associative neural network (Autoencoder)3.
Suspected damage data from those of the intact data can be determined based on the residual error
[25]𝑒𝑟 according to eq. (2.15):
𝑒𝑟= 𝑋 − 𝑋̂ (Eq. 2.15)
Where X is both the input and the output of AANN and 𝑋̂ = 𝐺(𝑧) is the response of the network to the de-mapping function G, which is intended to minimize the residual error. Thus, the AANN is trained to reconstruct the signature response of piezoelectric waves propagating along the structure.
13
Chapter 3.
3.
Data preprocessing based on Cross-correlation functions.
This chapter discusses the advantage of using cross-correlation analysis in a data-driven approach in order to obtain successful diagnosis of events in Structural Health Monitoring (SHM). In this sense, the identification of atypical and noisy data, as well as the management of data cleansing stages can be facilitated through the implementation of a pre-processing stage based on cross-correlation signals. Additionally, the obtained results evidence an improving on damage detection and classification when the cross-correlation is included. The influence of cross-correlation analysis used in the pre-processing stage is evaluated for damage detection and classification, by means of statistical plots and self-organizing maps. Three laboratory specimens were used as test structures in order to validate the preprocessing methodology i) a carbon steel pipe section with leak and mass damage types, ii) an aircraft wing specimen and iii) a turbine blade structure, where damages are specified by mass adding. As the main concluding remark, the suitability of cross-correlation features to achieve a more robust damage assessment algorithm is verified in order to be used in SHM tasks.
3.1.
Cross-correlation analysis for PZT signals
Several applications for structural damage assessment have demonstrated the effectiveness of using cross-correlation signals [26]. For example, in [27] damage identification methods based on natural excitation Technique (NeXT) employs cross-correlation signals for modal analysis, which has been useful for damage identification in civil structures. Another proposal [28]
includes the estimation of the time of flight of wave packages by means of cross correlation signals to locate defects within a large area of a thin-plate specimen. The cross-correlation function between two signals 𝑋(𝑡) and 𝑌(𝑡) is defined as in eq. (3.1).
𝑅𝑋𝑌(𝑡, 𝑡 + 𝜏) = lim 𝑁→∞ 1 𝑁∑ 𝑋𝑘(𝑡)𝑌𝑘(𝑡 + 𝜏) 𝑁 𝑘=1 (Eq. 3.1)
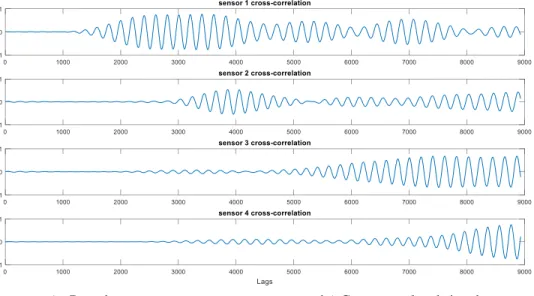
Where 𝑁 is the number of signal samples and 𝜏 is the lag time interval used to compute the cross-correlation signal. An example of cross-cross-correlation signals belonging to four different PZT are illustrated in figure 3.1.
14 a.) Raw data b.) Cross-correlated signals
Figure 3.1: Results of preprocessing stage of guided wave structural response
The signals presented in figure 3.1 belongs to PZT measurements for increasing positions (i.e. location of PZT-4 is further than PZT -3, and PZT-3 is further than PZT-2, and so on). The profile of the computed cross-correlated signals allows to infer that information about time of flight is preserved from time raw measurements. If the smoothed tone-burst signal generated by piezoelectric actuator device is stated in the form of eq. (3.2), it can be deduced that implicit arrival time is present in the PZT sensor response and can be mathematically represented by eq. (3.3) [29].
𝑆𝑇(𝑡) = 𝑆0(𝑡)𝐶𝑜𝑠(2𝜋𝑓𝑐𝑡) (Eq. 3.2)
where 𝑆0(𝑡) is a short-duration smoothing window applied to the carrier signal of frequency 𝑓𝑐
between 0 and 𝑡𝑝. The total signal received at point P by a PZT sensor can be expressed by eq.
(3.3).
𝑆𝑃(𝑡) = ∑𝑀−1𝑚=0𝐴𝑟,𝑚𝑆𝑇(𝑡 − 𝑡𝑑,𝑚) (Eq. 3.3)
where 𝐴𝑟,𝑚 represents the decreasing of the wave amplitude due to the omni-directional 2-D
radiation, and 𝑡𝐷,𝑚 is the arrival time delay due to the travel distance between the reference PZT
(m = 0, i.e. actuator) and the point P with no dissipation (i.e. wave energy conservation is assumed). It is assumed a distance d between two consecutive PZT’s of the array, which is much smaller than the distance r to a generic far-distance point, P (d << r).
Additional advantages of using cross-correlation signals relies on frequency interpretation, which can also be analyzed as a convolution filter. In terms of cross power spectral density, the cross-correlation function between two signals 𝑋(𝑡) and 𝑌(𝑡) is defined as in eq (3.4).
𝑅𝑋𝑌(𝑡, 𝑡 + 𝜏)
=
1 𝑁∑𝑆
𝑋𝑌(𝑘)
𝑁 𝑘=1𝑒
𝑗2𝜋𝑛𝑘 𝑁(
Eq. 3.4)According to eq. (3.4), the cross-correlation function is an average sum of N cross-spectral densities 𝑆𝑋𝑌(𝑘), which allows filtering high frequency disturbances caused by outliers. Thus, a
15
smoothed version of the dynamical structure response is obtained, with cleansed data and outliers removed or minimized.
3.2.
Condition monitoring approach
The concept of non-intrusive structural damage detection used in this approach is shown in figure 3.2. It consists of three main stages: 1. Piezo-electric instrumentation; 2. Statistical processing; and 3. Supervised classification.
P Z T P Z T D 1 D 2 D 3 D 4 PZT 1 PZT 2 PIEZODIAGNOSTICS SYSTEM
Structure Piezo Electric Network Time Piezo-Dynamic Response U N D D PZT 1 PZT 2 X T Z Z T XT PROCESSING AND MODELING DAMAGE CLASSIFICATION Scores PCA Feature extraction CLASSIFIED DATA Correlation ON/OFF SOM traning SOM 𝑇2 Q
Figure 3.2: Damage assessment methodology
3.3.
Proof of concept: Experimental setup
The proposed methodology was experimentally validated into three structures: a carbon steel pipe section, an aircraft wing specimen and a turbine blade section. The three lab specimens are instrumented with piezoelectric devices in order to induce guided waves along the surface structure. The carbon steel pipe section facilitates simulating leak and mass adding damage types, while in the other two specimen non-reversible damage types as adding masses can be recreated.
3.3.1.
Pipe section
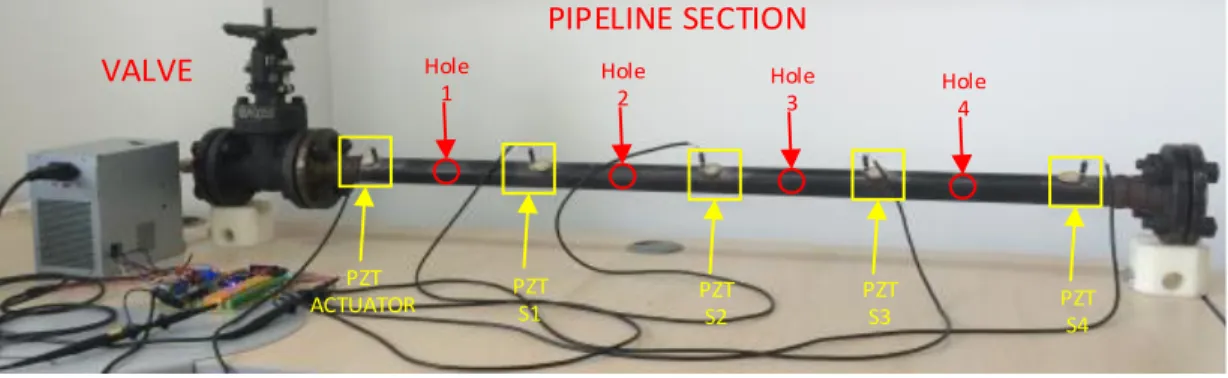
This test structure is a carbon-steel pipe section with material properties similar to those used in the local industry. Its dimensions are 1m length, 2.54 cm diameter and 3mm thickness with 4” bridles welded at the ends. In one of the extremes, a blind bridle is connected while in the other extreme, an air source is coupled. It is instrumented with piezoelectric devices distributed along the structure to capture guided wave response. Two types of damages can be simulated: leak condition and mass adding.
Damage conditioning
The pipe section is depicted in figure 3.3. Leaks are induced through elements denominated as Hole, where four ¼-inch holes are drilled along the pipe section wall by means of adjustable screws to control where the leak is produced A valve is used to set at 80 psi the air pressure from a compressor. Bolts and other elements used to recreate leak damages are included in the nominal state of the structure and consequently in the statistical baseline model.
16 Figure 3.3: Leak damage type configuration.
In addition to leak conditions, experimental data from mass adding scenarios were used to validate the effectiveness of the methodology. Figure 3.4 shows the configuration of this type of damage.
Figure 3.4: Mass adding experiment mockup.
According to photo in figure 3.4 a special shaped accessory is added to the surface of the pipe section to recreate mass adding damage type. In this sense, damages cases are the mass accessory attached to the structure at different locations. The mass occupies 5 cm of the pipe length, which is considered as a source of uncertainty involved in the escenarios configuration.
3.3.2.
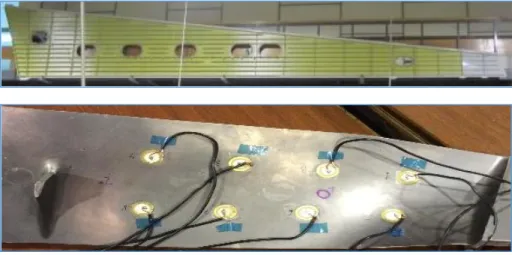
Aircraft wing structure
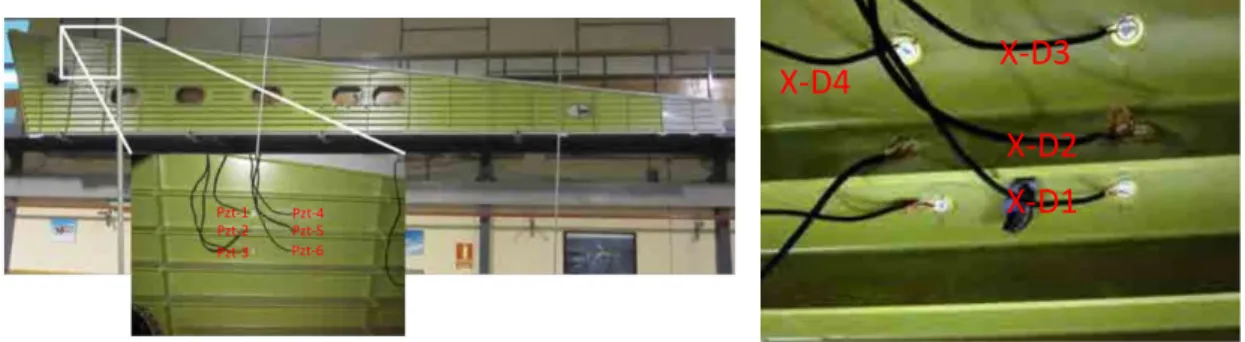
An aircraft wing specimen hosted in the “Universidad Politécnica de Madrid” (UPM – Spain) was also used to validate the proposed damage assessment methodology. This structure is an aircraft wing panel, which is divided by stringers and ribs as is illustrated in figure 3.5a. Two sections of it were instrumented with 6 PZTs (two at the upper section, two in the lower section and two at the rib). Four reversible adding-mass damage type were induced in both structures by adding a clay element at different positions according to figure 3.5b.
Hole 4 Hole 3 Hole 2 Hole 1 PZT ACTUATOR PZTS1 PZT S2 PZT S3 PZT S4 VALVE PIPELINE SECTION
Mass
PZT
Amplifier
PicoScope
17
a). skin panel b.) Mass adding damage description. Figure 3.5: Aircraft wing test structure
3.3.3.
Turbine blade structure
The third specimen used to validate the proposed methodology is an aircraft turbine blade, which has an irregular form and includes stringers in both faces (figure 3.6). 10 PZTs were attached to its surface, but only 7 of them, located at intermediate positions between the stringers and labeled in figure 3.6 as PZT1, PZT2, …, PZT6, were used. The remaining PZT devices are assumed to be part of the structure and taken into account at the baseline model. Four mass-adding damage types were simulated in the turbine blade by attaching coins of different denomination and labeled in figure 3.6 as D1, …, D4.
Figure 3.6: Mass adding damage description for turbine blade structure.
According to figure 3.6, the damage configuration considers scenarios including different positions, severities and potential barriers for guided wave. For example, damage two (D2) is the addition of two masses at different positions of the surface structure.
Pzt-1 Pzt-2 Pzt-3 Pzt-5 Pzt-4 Pzt-6
X-D1
X-D2
X-D3
X-D4
stringers
PZT-1 PZT-2 PZT-3 PZT-4 PZT-5 PZT-6 PZT-7 D1 D3 D2 D4X
ONE MASS TWO MASSES ONE MASS ONE MASS18
3.4.
Results and Discussion
The experimental results herein obtained were evaluated taken into account information consistency and effectiveness of structural damage identification. Thus, firstly a spectrum analysis is performed to evaluate data cleansing and filtering properties of the cross-correlation analysis, where a preliminary test is aimed for data anomaly detection. Then, different damage scenarios are evaluated according to the methodology explained previously, where the main goal of this work is to demonstrate the contribution of cross-correlation functions as pre-processing stage, for a better boundary between damage cases. In the next sections, these experimental results are presented and discussed.
3.4.1.
Data cleansing and filtering
This item describes some results intended to demonstrate the applicability of pre-processing stage based on cross-correlation in order to minimize the adverse influence of noisy data. For this purpose, experimental data from pipe section in figure 3.3 are analyzed. In this experiment, 4 PZTs are used to sense the guide wave produced by one PZT located at the extreme of the pipe section and excited by an 80 KHz burst signal each one (1) second. 100 repetitions of the experiment were conducted and recorded for the undamaged state by using a sample time Ts=56 ns. Thus, the potential advantages of using cross-correlation for data cleansing and filtering are explored by analyzing measurements from undamaged state.
Data Filtering
First, a spectrum analysis is achieved in order to verify that information in the frequency domain is preserved. Figure 3.7 is an example of the recorded signals for each PZT and their respective cross-correlated signals respect to the actuation signal.
a.) Raw data from PZT sensors b.) Cross-correlation signals Figure 3.7: Experiment acquired signals
According to figure 3.7, it can be observed that cross-correlation reduces the offset signal, besides it is a smoothed representation of dynamical behavior. The above result can be confirmed by estimating the power spectrum, which is illustrated in figure 3.8 for all 100 acquired signals.
0.9 1 1.1 1.2 1.3 1.4 1.5 1.6 1.7 1.8 -10 -5 0 5 10 Input Signal S1 S2 S3 S4 0.8 0.9 1 1.1 1.2 1.3 1.4 1.5 1.6 1.7 x 10⁴ -0.6 -0.4 -0.2 0 0.2 0.4 0.6 Corelation S1 Corelation S2 Corelation S3 Corelation S4
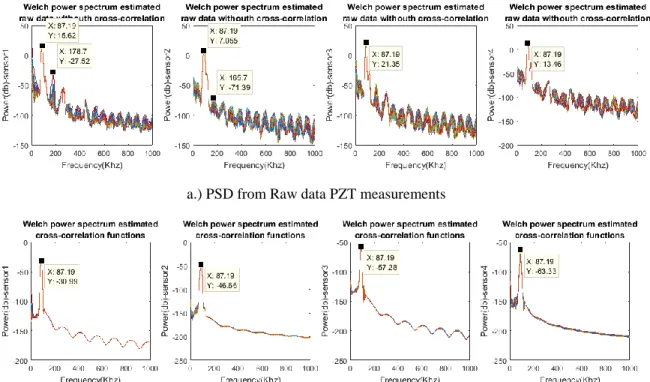
19 a.) PSD from Raw data PZT measurements
b.) Cross-PSD from correlation signals. Figure 3.8: Power spectrum
In figure 3.8 is observed that high frequency noise is reduced by the attenuation of the high order harmonics. Thus, the power density of secondary side lobules in the power spectrum is reduced. As a result, the consistency of frequency information is preserved by means of an average spectrum with the same central frequency. Also, the common offset values are excluded from signal representation. In this sense, cross-correlation function is an effective filtering technique to be applied to piezoelectric measurements.
3.4.2.
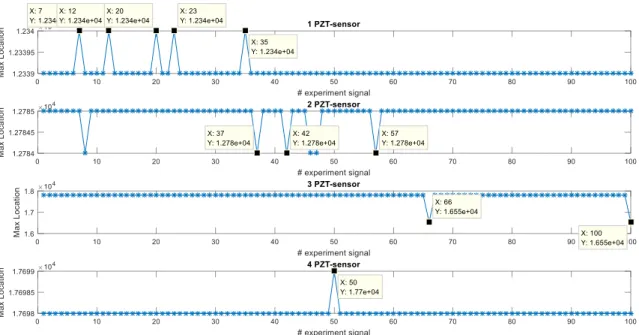
Data anomaly detection
Cross-correlation analysis is also useful as data anomaly detection tool. For this purpose, information about occurrence of maximum values of cross-correlation signal can be used. Thus, the locations where occur maximum cross-correlation are found and plotted in order to find possible atypical data. Figure 3.9 shows the index location for maximum values of cross-correlation piezo-measurements, where each value is associated with only one of the 100 experiments.
20 Figure 3.9: Indexes of cross-correlation maximum values.
According to figure 3.9 the maximum cross-correlation values are located in the same lag position. Thus, possible abnormal or atypical data measurements could be associated to deviations of max positions. In figure 3.10 can be identified some possible atypical data belonging to five measurement signals (i.e. 7, 12, 20, 23, and 35 indexes) from PZT sensor 1. In this way, the atypical data according to information extracted from cross-correlation are depicted in figure 3.10 and could be associated to offset values and trends. However, according to upper subplot, the cross-correlation filters these atypical signals which results in a well-defined pattern for all of the 100 experiment repetitions. Thus, the structural dynamical response due to guided waves are characterized by the mode conversion and low amplitude changes as is remarked in figure 3.11, where variations of concatenated cross-correlation signals are highlighted.
21 Figure 3.11: concatenated cross-correlation signals.
3.4.3.
Structural damage detection
In this section is intended to illustrate how pre-processing technique based on cross-correlation signals improve the results of structural damage and classification algorithms. For this purpose, several experiments were conducted to show its suitability by considering different damage scenarios over the three previously described structures.
Pipe section experiment
As a first scenario, mass-adding damage type is considered according to experiment set up in figure 3.4. Thus, two piezoelectric devices (sensor-actuator) were attached near to the structure bridles in the pipe section. 70 damage classes were recreated in the test specimen by consecutive displacements of the mass along the structure. Each damage scenario, (denominated D1, D2
⋯D70), belongs to a mass located at 1cm, 2cm, and so on, respect to the PZT actuator. Experiments related to pristine structure cases are labelled as ‘UND’ (70%) and ‘orig’ (30%). A number of 100 experiments per condition (Damaged/Undamaged) were conducted. A guided wave is induced by applying a 5 cycles, 80 kHz burst type pulse on the PZT located at one end of the pipe section. The resulting T2 Vs Q scatter plot is depicted in figure 3.12, for both cases: with and without cross-correlation analysis.
22 a.) without cross-correlation
b.) By including cross-correlation Figure 3.12: Damage indexes.
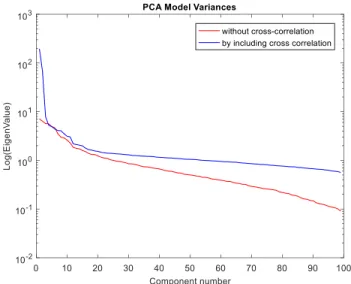
According to figure 3.12, by including cross correlation some damage clusters can be distinguished unlike processing raw PZT measurements. Also, a clear boundary for the undamaged condition is obtained, which facilitates damage detection process. A comparison between PCA model variances are depicted in figure 3.13.
0 5 10 15 20 25 0 5 10 15 20 25 30 35 Hotelling's T2-statistic Q -S ta ti st ic Orig D1 D2 D3 D4 D5 D6 D7 D8 D9 D10 D11 D12 D13 D14 D15 D16 D17 D18 D19 D20 D21 D22 D23 D24 D25 D26 D27 D28 D29 D30 D31 D32 D33 D34 D35 D36 D37 D38 D39 D40 D41 D42 D43 D44 D45 D46 D47 D48 D49 D50 D51 D52 D53 D54 D55 D56 D57 D58 D59 D60 D61 D62 D63 D64 D65 D66 D67 D68 D69 D70 0 50 100 150 200 250 300 350 400 0 5 10 15 20 25 Hotelling's T2-statistic Q -S ta ti st ic Orig D1 D2 D3 D4 D5 D6 D7 D8 D9 D10 D11 D12 D13 D14 D15 D16 D17 D18 D19 D20 D21 D22 D23 D24 D25 D26 D27 D28 D29 D30 D31 D32 D33 D34 D35 D36 D37 D38 D39 D40 D41 D42 D43 D44 D45 D46 D47 D48 D49 D50 D51 D52 D53 D54 D55 D56 D57 D58 D59 D60 D61 D62 D63 D64 D65 D66 D67 D68 D69 D70 Damage Grouping D54 D44 D1 D56 D51 D52 Orig
23 Figure 3.13: PCA model variances for mass adding scenarios in pipe section.
According to results in figure 3.13, a smoothed distribution of variance model for each principal component is obtained for the case of cross-correlation signals. Thus, unlike the results obtained from processing raw PZT measurements, it does not exist the abrupt change respect to the first principal component. In this sense, the variance distribution due to cross-correlation analysis entails on a better clustering of damage case data.
The second example is a leak damage detection using the experimental configuration of figure 3.3, where five PZTs were attached along the structure. The PZT at one of the ends is used as actuator and the remaining ones as sensors. The proposed damage configuration includes different leak sizes specified in table 3.1. For each type of damage, 100 experiment repetitions were conducted, where undamaged experiments are tagged with label ‘UN’.
Table 3.1: Leak Damage specification Label Leaks (Red = open) Label Leaks (Red = open)
D1 H1,H2,H3,H4 D5 H1,H2,H3,H4
D2 H1,H2,H3,H4 D6 H1,H2,H3, H4
D3 H1,H2,H3,H4
D7 H1,H2,H3,H4
D4 H1,H2,H3,H4 *H denotes hole
Figure 3.14 presents the resulting Q and T2 statistical indices, where a well-defined separation between different leaks combinations can be appreciated for the case of cross-correlated signals.
24 a.) without cross-correlation b.) By including cross-correlation
Figure 3.14: Damage indexes for leak detection.
In order to emphasize the advantage of using cross-correlated signals, a Self-Organizing Map was trained by using as feature inputs the T-squared and Q-statistics indexes (same data from figure 3.14), whose clusters are depicted in figure 3.15.
a.) without cross-correlation analysis b.) By including cross-correlation processing Figure 3.15: SOM network for leak damages.
According to figure 3.15, boundaries clearly defined by empty clusters and BMU distance matrix (U-matrix) can be observed when the cross-correlation as preprocessing stage is applied. Thus, a major differentiation between different damage types is obtained. In addition, the cases distribution avoids damages combination in one similar cluster, which allows a better classification
Skin panel structure
Experimental results for the skin panel test structure are depicted in figure 3.16, by using statistical indices values and cluster centers for each damage scenario. It can be observed that
0 200 400 600 800 1000 1200 1400 1600 1800 0 1 2 3 4 5 6 7 8 9x 10 4 Hotelling's T2-statistic Q -S ta ti s ti c Orig D1 D2 D3 D4 D5 D6 D7 Orig D1 D2 D3 D4 D5 D6 D7 0 20 40 60 80 100 120 140 160 0 5 10 15 20 25 Hotelling's T2-statistic Q -S ta ti s ti c Orig D1 D2 D3 D4 D5 D6 D7 Orig D1 D2 D3 D4 D5 D6 D7
25
major dispersion appears without than with correlation analysis. Additionally, correlation analysis shows its efficacy to filter atypical data-cases.
a.) without cross-correlation b.) By including cross-correlation Figure 3.16: Statistical indexes for skin panel experiment.
The respective SOM network is depicted in figure 3.17.
a.) without cross-correlation analysis b.) By including cross-correlation processing Figure 3.17: SOM network for skin panel structure damages.
According to figure 3.17, undamaged cases are separated in a better way when cross-correlation signals are used to obtain the SOM network. Also, the U-matrix shows a major distance values between damage cases. Table 3.2 summarizes the SOM quality indexes for skin panel structure data.
SOM 24-May-2017
U-matrix 3 4 4 4 2 UN 4 4 4 4 2 UN 4 4 4 4 4 2 2 UN 2 2 2 3 3 1 3 3 3 3 3 1 1 1 1 3 3 3 3 1 1 1 1 3 3 3 1 1 1 1 1 3 3 1 1 1 1 3 3 UN UN 1 1 1 1 1 0.0041 1 2 0.0041 Labels 3 4 4 4 2 UN 4 4 4 4 2 UN 4 4 4 4 4 2 2 UN 2 2 2 3 3 1 3 3 3 3 3 1 1 1 1 3 3 3 3 1 1 1 1 3 3 3 1 1 1 1 1 3 3 1 1 1 1 3 3 UN UN 1 1 1 1 1 SOM 24-May-2017 U-matrix 3 4 4 4 2 UN 4 4 4 4 2 UN 4 4 4 4 4 2 2 UN 2 2 2 3 3 1 3 3 3 3 3 1 1 1 1 3 3 3 3 1 1 1 1 3 3 3 1 1 1 1 1 3 3 1 1 1 1 3 3 UN UN 1 1 1 1 1 0.0041 1 2 0.0041 Labels 3 4 4 4 2 UN 4 4 4 4 2 UN 4 4 4 4 4 2 2 UN 2 2 2 3 3 1 3 3 3 3 3 1 1 1 1 3 3 3 3 1 1 1 1 3 3 3 1 1 1 1 1 3 3 1 1 1 1 3 3 UN UN 1 1 1 1 1SOM 24-May-2017
U-matrix 3 3 3 3 UN UN 3 3 3 3 3 3 1 2 3 3 1 2 2 3 3 1 1 1 2 1 1 1 2 1 1 2 4 4 1 1 4 4 1 4 4 4 4 3 1 1 1 0.000174 1.06 2.12 0.000174 Labels 3 3 3 3 UN UN 3 3 3 3 3 3 1 2 3 3 1 2 2 3 3 1 1 1 2 1 1 1 2 1 1 2 4 4 1 1 4 4 1 4 4 4 4 3 1 1 1 SOM 24-May-2017 U-matrix 3 3 3 3 UN UN 3 3 3 3 3 3 1 2 3 3 1 2 2 3 3 1 1 1 2 1 1 1 2 1 1 2 4 4 1 1 4 4 1 4 4 4 4 3 1 1 1 0.000174 1.06 2.12 0.000174 Labels 3 3 3 3 UN UN 3 3 3 3 3 3 1 2 3 3 1 2 2 3 3 1 1 1 2 1 1 1 2 1 1 2 4 4 1 1 4 4 1 4 4 4 4 3 1 1 126 Table 3.2: SOM quality indexes for skin panel structure data
Index Uncorrelated Signals Cross-correlated signals
Quantization error 0.0186 0.0025 Topographical error 0.0686 0.2381 Distortion measure 0.7840 0.2734 Training Error 0.5714 0 Empty Clusters 42 63 Validation Error 2.6667 1.3333
Turbine blade structure
Experimental results on turbine blade test structure are depicted in figure 3.18, by using similar parameters of the above experiment. Here can be highlighted a clear separation between different types of damage when cross-correlation analysis is included and a better performance by including cross-correlation analysis is confirmed.
a.) without cross-correlation b.) By including cross-correlation Figure 3.18: Results for turbine blade experiment.