Selecting significant genes by randomization test for cancer classification
using gene expression data
Zhiyi Mao, Wensheng Cai, Xueguang Shao
⇑State Key Laboratory of Medicinal Chemical Biology, and Research Center for Analytical Sciences, College of Chemistry, Nankai University, Tianjin 300071, China
a r t i c l e
i n f o
Article history: Received 3 July 2012 Accepted 28 March 2013 Available online 6 April 2013 Keywords:
Gene expression data Randomization test
Partial least squares discriminant analysis Gene selection
Cancer classification
a b s t r a c t
Gene selection is an important task in bioinformatics studies, because the accuracy of cancer classifica-tion generally depends upon the genes that have biological relevance to the classifying problems. In this work, randomization test (RT) is used as a gene selection method for dealing with gene expression data. In the method, a statistic derived from the statistics of the regression coefficients in a series of partial least squares discriminant analysis (PLSDA) models is used to evaluate the significance of the genes. Informative genes are selected for classifying the four gene expression datasets of prostate cancer, lung cancer, leukemia and non-small cell lung cancer (NSCLC) and the rationality of the results is validated by multiple linear regression (MLR) modeling and principal component analysis (PCA). With the selected genes, satisfactory results can be obtained.
Ó2013 Elsevier Inc. All rights reserved.
1. Introduction
Cancer classification based on microarray has become a popular research topic in bioinformatics, which can be used to detect sub-types of cancers and produce therapies. A great many of studies have appeared for cancer classification[1–3]. These methods in-clude principal component analysis (PCA)[4,5],k-nearest neighbor (k-NN)[6], hierarchical clustering analysis (HCA)[7], support vec-tor machine (SVM)[8], Bayesian method[9], partial least squares discriminant analysis (PLSDA)[10], ensemble methods[11], etc. Among these methods, PLSDA has been the most commonly used one for cancer classification due to its simplicity[12–14]. More-over, as a dimension reduction technique, PLS has been used in gene expression data analysis even in the case where the number of genes exceeds the number of samples.
Except for a few classification methods using full genes[15], classification is generally performed based on selecting significant genes for constructing accurate prediction models. Furthermore, gene selection may provide insights into understanding the under-lying mechanism of a specific biological phenomenon. Also, such information can be useful for designing less expensive experiments by targeting only a handful of genes[16]. However, how to effec-tively select significant biomarker genes from thousands or even ten thousands of genes is a difficult problem. A comprehensive re-view of feature selection methods has been described by Saeys et al.[17]. Depending on how the genes interact with the construc-tion of the classificaconstruc-tion model, feature selecconstruc-tion techniques can be
characterized into three classes: filter, wrapper and embedded methods. Filter methods[18]assess the relevance of features by looking only at the intrinsic properties of the data, and thus they are computationally simple and fast. Wrapper methods[19] em-ploy a selection strategy in the space of all possible feature subsets, guided by the predictive performance of a classification model. Advantage of these methods includes the interaction between gene subset search and model selection. However, they may have a higher risk of over-fitting than filter methods and may be compu-tationally intensive. Embedded methods [20] make use of the internal parameters in a classification model to perform feature selection, and, therefore, the computational cost is reduced but the advantage of the interaction between the gene selection and classification model is preserved. Based on the three classes of fea-ture selection techniques, various gene selection algorithms have been proposed and successfully used in selecting informative genes for cancer classification [21–25]. In our previous works, Monte Carlo based uninformative variable elimination (MC-UVE) [26], randomization test (RT) [27], PLS with the influential vari-ables (IVs)[28]and latent projective graph (LPG)[29]have been proposed for selecting informative variables in near-infrared spec-tral analysis. Among these methods, RT has been proved to be an efficient approach to extract useful information from the spectra. The method builds a regular model and a series of random models, and then evaluates the importance of the variables based on the significance test of coefficients in regular and random models. The variables with high significance can be selected as the informa-tive ones.
In this study, RT coupled with PLSDA was employed to seek the significant genes for cancer classification. A set of PLSDA models 1532-0464/$ - see front matterÓ2013 Elsevier Inc. All rights reserved.
http://dx.doi.org/10.1016/j.jbi.2013.03.009
⇑Corresponding author. Fax: +86 22 23502458. E-mail address:[email protected](X. Shao).
Contents lists available atSciVerse ScienceDirect
Journal of Biomedical Informatics
j o u r n a l h o m e p a g e : w w w . e l s e v i e r . c o m / l o c a t e / y j b i nare built by permutation, and the significance of genes are evalu-ated by a statistic. To validate the performance and applicability of the method, four gene expression datasets were investigated. The results show that the method can select significant genes for cancer classification.
2. Methods
2.1. Partial least squares discriminant analysis (PLSDA)
Partial least squares (PLS) regression is a well-known method to find the relationship between predictor variablesXand dependent variablesy. In a PLS model, not only the variance ofX, but also the covariance betweenXandyis taken into account. Therefore, the central point of PLS is to find latent variables in the feature space that have a maximum covariance withy. PLSDA is a variant of PLS to improve the separation between classes using a categorical response variabley. In this study,Xis the matrix of gene expres-sion values and the values ofyare given as 1 and1 for positive and negative class, respectively. Each row ofXmatrix represents the gene expression values of all the genes for each sample, and each column corresponds to the gene expression values of all sam-ples for a gene. PLSDA is used for modeling the genes expression data (X) and the response variable (y) using the training set. In the calculations, the optimal latent variable (LV) number used in the modeling is determined by Monte Carlo cross validation (MCCV). In the prediction, the samples with predicted values above zero are ascribed to positive class, otherwise to negative class. The parameters of accuracy (Acc), precision (P), recall (R) andF -mea-sure (F) are used to evaluate the classification effect.
2.2. Randomization test (RT)
RT is a method for variable selection by employing the statistics of the regression coefficients in the models built with permutation of the dependent variablesyin the training set[27]. In the calcu-lation of RT, a regular model showing the recalcu-lationship ofyandX is built for reference and a number (M) of random PLSDA models are built by randomization, i.e., randomly scrambling the indices ofywhile keeping the indices ofX. In this study, the number of the permutations is 1000, as discussed in our previous work[27]. In each of the random models, a regression coefficient can be ob-tained for each gene. Clearly, the regression coefficients of each gene in the random models must be due to chance. Therefore, the values of the regression coefficients can be referred to as ‘noise values’.
A statistic, P, is defined as the fraction of the ‘noise values’ exceeding the regression coefficient in the regular PLSDA model,
Pj¼numðjbjj>jb0;jjÞ=M ðj¼1;2;. . .;pÞ ð1Þ wherejis the index of the genes, andpis the number of genes.bj andb0,jrepresent the ‘noise values’ and the regression coefficient in the regular model of the genej, andMis the number of random models. Since the value of the regression coefficient for each gene is a reflection of its importance in the model, the informative or rele-vant genes generally have coefficients of large absolute values. Therefore, the ‘noise values’ should be significantly smaller than the coefficients of the normal model, because they are obtained by randomization, and the significance of a gene can be assessed by itsPvalue. If a cutoff value is defined, the genes whose coeffi-cients are smaller than the threshold should be selected as informa-tive ones. In this study, all the genes are ranked by theirPvalues, and thus the genes are selected according to the order from low to highPvalues.
2.3. RT-PLSDA method
RT-PLSDA means a combination of RT and PLSDA, in which the coefficients of PLSDA models were used to calculatePvalues. Four steps are included in the calculations. Among the steps, the first two steps are used for selecting the informative genes according to thePvalues. The third step determines the retained genes by repetition of RT procedures to make the result more reliable, and the fourth step involves the modeling and prediction with the se-lected genes. The calculation details can be described as follows.
(1) With the training set, a regular PLSDA model is built, and the regression coefficients for the genes are recorded in a 1p
vectorb0. With the same training set,Mpermutations ofy are performed to buildMPLSDA random models. The regres-sion coefficients are recorded in anMpmatrixbas the ‘noise values’. It should be noted that before the calculation, auto-scaling were performed to the datasets in order to eliminate the effect of intensity difference between genes and make each gene have a comparable contribution to the classification.
(2)Pvalue of each gene is calculated by using Eq.(1), and the genes are ranked in an ascending order ofPvalues. With a number (N) of genes with lower P values, the error of cross-validation (ECV), which is defined as the number of misclassified samples, is obtained by MCCV. In the calcula-tion of MCCV, 50% of the samples in the training set are ran-domly selected to build the model and predict the remaining samples, and 1000 repetitions were performed. The ECV value is calculated by the sum of misclassified samples num-ber in the 1000 repetitions. The numnum-ber of genes with the minimum ECV value is selected.
(3) Because random permutation is involved in the calculations, the distribution ofPvalues is not identical in different runs. A large number of runs may not be necessary considering the time consumed, 100 was used for ensuring the reliability and for investigating the repeatability of the method. A fre-quency number in the 100 runs is used to further describe the significance of each gene. The selected genes are ranked in a descending order with the frequency number, and with different number of the selected genes, a series of PLSDA models are built and the ECV is obtained by MCCV. The opti-mal number of retained genes can be therefore determined by the lowest ECV value for the training set as calculated in step (2).
(4) With the retained genes, a multiple linear regression (MLR) model for classification is built and used to predict the test set.
In RT method, the distribution ofPvalues is plotted for determi-nation of the variables with low value. In this study,lgPis used in place of Pto make the distribution more clear. In this case, the genes with higher values will be more significant. It should be noted that for few genes,Pvalue may be zero when the regression coefficient in the regular model is larger than all the ‘noise values’. Such genes are obviously significant ones. For these genes,lgPis defined as 4 because the maximum value oflgPis 3 when only one of the ‘noise values’ is larger than the regression coefficient in the regular model.
3. Datasets
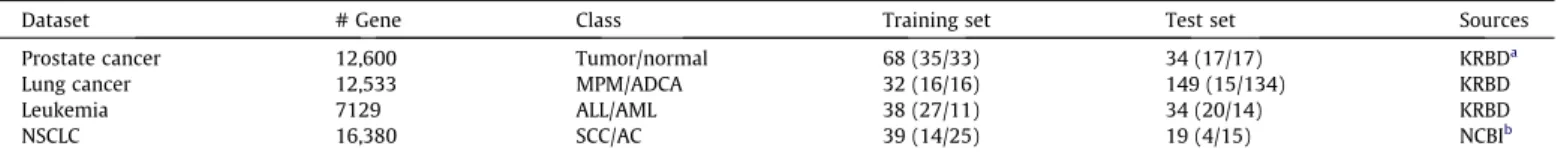
Four gene expression datasets of prostate cancer[30], lung can-cer[31], leukemia[32]and non-small cell lung cancer (NSCLC)[33] were used in this study. A summary of the four datasets are listed
inTable 1. In the calculations, the training and test set described in the website was used for the lung cancer and Leukemia dataset, but Kennard–Stone algorithm (KS) [34] was used to divide the two sets for the prostate cancer and NSCLC datasets. The KS algo-rithm sequentially selects a subset of samples that are uniformly distributed over the predictor variables space based on the Euclid-ean distance between samples.
4. Results and discussion
4.1. Gene selection by randomization test
In order to show the procedures of gene selection by RT method, prostate cancer dataset is used as an example. In the calculations, eight principal components are used for the dataset.Fig. 1shows thelgPvalues of the 12,600 genes obtained in one independent run. In the figure, most of thelgPvalues are less than one, mean-ing that their significance is near a random variable. Therefore, these genes are not significant at all in the classification model. On the other hand, only a small number of the genes have a large lgPvalue, and two of them are 4, corresponding to a zeroPvalue. The result indicates that there is only a small number of genes are informative and it may be possible to select the significant genes with thelgPvalues.
In order to determine the number of significant genes, the genes are ranked in a descending order oflgPvalues. With a number (N) of genes with higherlgPvalues, ECV value is calculated by MCCV.Fig. 2shows the variation of ECV with the number of se-lected genes fromN= 9 to 30. The reason for starting with nine genes is because the number of genes must be bigger than the LV number of the PLSDA model, and the reason for ending at 30 is just for clarity of the figure. Calculations show that the variation after 20 is almost the same until 100. It can be seen that, the ECV decreases from a large value to a minimum atN= 16, and then the ECV fluctuates around a number slightly bigger than the minimum.
The result indicates that the best model for the classification can be obtained with the 16 selected genes.
Because random permutation is involved in the calculations, the distribution oflgPvalues may not be identical in different runs. Therefore, 100 independent runs are performed to obtain a reliable result. The results show that the number of the selected genes in the 100 runs is between 10 and 30. Therefore, the frequency num-ber was calculated for further ranking the selected genes. As de-fined in the method, the higher the frequency number of a gene, the more significant.Fig. 3displays the frequency number of the selected genes. In the figure, the genes are ordered by the fre-quency number along the abscissa axis. It is clear that only 48 genes are selected, and most of the genes are selected in a high fre-quency. With this figure, the significant genes for classification can be selected according to the frequency number. On the other hand, the result also shows that, although random permutation is Table 1
Description of the four gene expression datasets.
Dataset # Gene Class Training set Test set Sources
Prostate cancer 12,600 Tumor/normal 68 (35/33) 34 (17/17) KRBDa
Lung cancer 12,533 MPM/ADCA 32 (16/16) 149 (15/134) KRBD
Leukemia 7129 ALL/AML 38 (27/11) 34 (20/14) KRBD
NSCLC 16,380 SCC/AC 39 (14/25) 19 (4/15) NCBIb
a
Kent ridge bio-medical dataset, <http://datam.i2r.a-star.edu.sg/datasets/krbd/>. b
NCBI GEO datasets, <http://www.ncbi.nlm.nih.gov/geo/query/acc.cgi?acc=GSE10939>.
Fig. 1.Distribution of –lgPvalues.
Fig. 2.Variation of ECV values with the number of selected genes.
involved, the algorithm has a good reproducibility. Similar result can be obtained in different independent run.
To determine the number of retained genes, ECV value is calcu-lated by MCCV with different number of the selected genes from high to low frequency number. The calculation starts with nine genes as the same reason mentioned above. The variation of ECV with the number of retained genes is shown inFig. 4. It can be seen that the ECV decreases from a large value to a minimum when the number of retained genes is 18. Then, with the increase of the number, the ECV fluctuates slightly, and reaches a minimum at 43. If tested withFcriterion[35], however, it can be found that the ECV values with 18 and 43 genes have no significant difference. Therefore, the 18 genes can be identified as the significant genes for the classification of the dataset.
For testing the efficiency of the retained significant genes in classification of the dataset, the classification model with the 18 genes is investigated. Because the number of retained genes is smaller than that of the samples, MLR model is adopted for model-ing and prediction to make the model less complicated. An accu-racy of 97.06% (66/68) was obtained for the training set by leave-one-out cross validation (LOOCV), and the accuracy for the test set is 91.18% (31/34). It is obvious that the results are acceptable, indicating that the genes obtained by the proposed method is informative enough for the classification.
4.2. Applicability of RT-PLSDA method
To further illustrate the performance of the proposed method, the lung cancer dataset, leukemia dataset and NSCLC dataset are investigated. In the calculations, 3, 5 and 3 principal components are used for the three datasets, respectively. Because the same pro-cedures were used in the calculation and the similar results were obtained as in the calculation of prostate cancer dataset, only the frequency number of the genes was given.Fig. 5shows the fre-quency numbers of the selected genes for the three datasets. With the same calculation for the prostate cancer dataset, i.e., the varia-tion of ECV values with the number of selected genes in MCCV, the number of significant genes for the three datasets is 4, 9 and 7, respectively.
The rationality of the significant genes was also investigated by MLR models, as did for the prostate cancer dataset. The accuracies, P, R andFfor the training and test sets are summarized inTable 2. It can be seen that both the accuracies and the statistical parame-ters are acceptable, demonstrating the rationality of the retained genes.
4.3. Biological investigation of the selected genes
In order to validate the selected genes,Table 3summarizes the index, gene IDentity (Gene ID), definition and annotation date of the 18 genes in an order of frequency number.
As labeled in the table, most of these genes are consistent with the results reported in the previous studies[30,36–40]. For exam-ples, X07732 was reported to encode hepsin, a serine protease that overexpresses in most prostate cancers. It has been known as a po-tential prostate cancer biomarker [41,42]. M84526 encodes an-other serine protease adipsin that is secreted by adipocytes into the bloodstream and functions as part of the alternative comple-ment pathway of the innate immune system [43]. Hokaiwado et al.[44]showed that glutathione transferase (M96233) mediates the proliferation of androgen-independent prostate cancer cells. M22832 has been correlated to different cancer types with consis-tent up-regulation in tumor[45].
Table 4lists the information of the four genes for the lung can-cer datasets. The first gene (AL050224) has been selected by Wang and Simon[46]. It may play a role in the RNA polymerase and the expression of the gene was found to be high in lung tissues[47]. Wang and Gotoh[37]reported that FBP1 (U21931) was likely to have high discriminative power for the ADCA and MPM samples. As for the last two genes in the table, Claudin-7 (AJ011497) was Fig. 4.Variation of ECV values with the number of retained genes.
Fig. 5.Frequency number of the selected genes for the lung cancer (a), leukemia (b) and NSCLC (c) dataset.
Table 2
Classification results for the datasets using RT-PLSDA method.
Dataset Training set Test set
Acc (%) P (%) R (%) F(%) Acc (%) P (%) R (%) F(%)
Prostate cancer 97.06 96.97 96.97 96.97 91.18 100 82.35 90.32
Lung cancer 100 100 100 100 97.99 99.25 98.51 98.88
Leukemia 97.37 100 87.50 93.33 94.12 100 87.50 93.33
found underexpressed in MPM while overexpressed in ADCA, and in contrast, MRC OX-2 (X05323) was found overexpressed in MPM[31]. Therefore, they are considered as biomarkers for the lung cancer.
Table 5presents a summary of the nine genes for the leuke-mia datasets. As labeled in the table, all of the nine genes have been identified as significant ones in previous studies[32,48,49]. For examples, CD33 (M23197_at) has been developed for
tar-geted antibody therapy to kill leukemia AML cells [32,50], and the zyxin gene (X95735_at) has been shown to encode an LIM domain protein that is important in cell adhesion of fibroblasts [51].
Table 6 shows a summary of the seven genes for the NSCLC dataset. Because the dataset is a relatively new one, it is difficult to find the literatures for biological interpretation of the genes. Thus further discussions are not given in this paper.
Table 3
Significant genes identified by RT-PLSDA method for classification of tumor and normal samples in the prostate cancer dataset.
Index Gene ID Definition Annotation datea
5890 AJ001625.1 Homo sapiens mRNA for Pex3 protein[36] October 7, 2008
6185 X07732.1 Human hepatoma mRNA for serine protease hepsin[30,36–38] July 15, 2003
6390 AI093155.1 qa97g04.x1 Homo sapiens cDNA, 3 end[36] August 18, 1998
6462 M11433.1 Human cellular retinol-binding protein mRNA, complete cds[30,38] January 8, 1995
9093 W72186.1 Zd69b19.s1 Homo sapiens cDNA, 3 end[39] June 19, 1996
9850 M84526.1 Human adipsin/complement factor D mRNA, complete cds[30,37,38] April 27, 1993
10215 X02152.1 Human mRNA for lactate dehydrogenase-A[40] September 12, 1993
12495 M98539.1 Human prostaglandin D2 synthase gene, exon 7[30,36] March 31, 1997
4432 AL034399.6 dA191P20.2 (novel Fibronectin type III domain containing protein similar to Ring finger protein MID1) January 24, 2013
9034 AL050152.1 Homo sapiens mRNA; cDNA DKFZp586K1220[37] February 18, 2000
11858 U04313.1 Human maspin mRNA, complete cds[38] June 11, 1994
12153 M96233.1 Human glutathione transferase class mu number 4 (GSTM4) gene, complete cds[30,37] December 20, 1994 205 M62895.1 Human lipocortin (LIP) 2 pseudogene mRNA, complete cds-like region January 7, 1995 8981 D13892.1 Human mRNA for carboxyl methyltransferase, complete cds February 14, 2003
9172 AI207842.1 Ao89h09.x1 Homo sapiens cDNA, 3 end[40,41] October 19, 1998
8965 M22382.1 Human mitochondrial matrix protein P1 (nuclear encoded) mRNA, complete cds[32] January 8, 1995
9044 U21128.1 Human lumican mRNA, complete cds March 8, 1996
8843 D14658.1 Human mRNA for KIAA0102 gene, complete cds March 25, 2006
a
http://www.ncbi.nlm.nih.gov/nuccore.
Table 4
Significant genes selected by RT-PLSDA method for discrimination of ADCA and MPM samples in the lung cancer dataset.
Index Gene ID Definition Annotation date
4336 AL050224.1 Homo sapiens mRNA; cDNA DKFZp586L2123[46] February 18, 2000
7249 U21931.1 Human fructose-1,6-biphosphatase (FBP1) gene September 27, 1995
8537 AJ011497.1 Homo sapiens mRNA for Claudin-7[31] October 7, 2008
7765 X05323.1 Human MOX2 gene for OX-2 membrane glycoprotein, exon 1 and joined CDS[31] November 14, 2006
Table 5
Significant genes detected by RT-PLSDA method for classification of AML from ALL samples in the leukemia dataset.
Index Gene ID Definition Annotation date
1829 M22960.1 Protective protein for beta-galactosidase[48] April 27, 1993 1834 M23197.1 CD33 CD33 antigen (differentiation antigen)[32,48,49] November 1, 1994
2020 M55150.1 FAH Fumarylacetoacetate[32,48,49] November 8, 1994
2121 M63138.1 CTSD Cathepsin D (lysosomal aspartyl protease)[48,49] October 31, 1994
3320 U50136.1 Leukotriene C4 synthase (LTC4S) gene[32,48] May 16, 1996
4229 X52056.1 SPI1 Spleen focus forming virus (SFFV) proviral integration oncogene spi1[49] April 18, 2005
4847 X95735.1 Zyxin[32,48] October 7, 2008
6376 M83652.1 PFC Properdin P factor, complement[32] February 11, 2002
6539 X85116.1 Epb72 gene exon 1[32,48] November 14, 2006
Table 6
Significant genes detected by RT-PLSDA method for classification of AC from SCC samples in the leukemia dataset.
Index NCBI reference sequence Definition Annotation date
15480 NM_003791.2 Membrane-bound transcription factor peptidase, site 1 December 13, 2012
2691 NM_024682.2 TBC1 domain family, member 17 January 7, 2013
11374 NM_022918.3 Transmembrane protein 135 November 12, 2012
11375 NM_018244.4 Ubiquinol-cytochrome c reductase complex chaperone January 12, 2013
13161 NM_002096.2 General transcription factor IIF, polypeptide 1, 74 kDa, mRNA January 27, 2013 15481 NM_020247.4 aarF domain containing kinase 3 (ADCK3), nuclear gene encoding mitochondrial protein, mRNA January 6, 2013
4.4. Further investigation of the selected genes
To further investigate the significance of the selected genes, PCA score plots obtained with the selected genes of the four datasets are shown inFig. 6. Using these plots, the distribution of the sam-ples for the datasets can be observed.
It is clear that a very good clustering occurs for all the four data-sets, although the result of prostate cancer dataset is relatively not so satisfactory. By using Fisher linear discriminant[52], the num-ber of misclassified samples for the four datasets is 7, 3, 3, and 1, respectively. The results clearly demonstrate that the retained genes can describe the nature of the samples in the two classes, and thus imply that the selected genes are significant for discrim-inating the samples. Therefore, the proposed method may be an efficient tool for finding possible biomarkers from gene expression data.
4.5. Comparison of the classification effect with the gene selected by different methods
In order to investigate the performance of the proposed meth-od, the number of selected genes by different methods and the classification effect by using these genes are summarized in Table 7.
At first, from the number of selected genes, the difference be-tween methods can be clearly found. For several methods, the number is as high as 50 or even 100, but for some methods, the number is less than 10, even only 1 or 2. However, it is difficult to do a further comparison of the selected genes for all the method listed in the table because the genes selected by the compared methods were not provided. The results may be accounted for by the small number of the dataset and the properties of the data[56]. As for the classification accuracies, the proposed method pro-duced the results of 97.06% and 91.18% for the training and test sets, respectively, using the 18 selected genes for the prostate can-cer dataset. The result is similar to most of the published works,
Fig. 6.PCA score plots of the selected genes for the prostate cancer (a), lung cancer (b), leukemia (c) and NSCLC (d) dataset. Open triangles and filled inverted triangles represent positive and negative samples, respectively. The numbers in percentage labeled in the axes represent the explained variances of the PCs.
Table 7
Comparison of the results obtained by different methods for the prostate cancer, leukemia, lung cancer and NSCLC dataset.
Dataset/method # Genes Training set Test set Prostate cancer dataset
RT-PLSDA 18 97.06% (66/
68)a
91.18% (31/34) Gaussian processes[36] 13 Unknownb
91.18%c (93/102) RIRLS[53] 100 Unknown 91.18%c (93/102) k-TSP[54] 2 Unknown 91.18%c (93/102) ERGS[21] 10 Unknown 94.12%c (96/102) WMW[46] 1 Unknown 89.22%c (91/102) Lung cancer dataset
RT-PLSDA 4 100% (32/32) 97.99% (146/149) k-TSP[53] 10 Unknown 98.90%c (179/ 181) ERGS[21] 10 Unknown 98.34%c(178/ 181) WMW[46] 1 Unknown 93.37% (169/181)
Gene expression ratios[31] 6 Unknown 99.33% (148/149)
RFE[55] 2 Unknown 98.34% (178/181) Decision rules[37] 1 93.75% (30/32) 97.32% (145/149) Leukemia dataset RT-PLSDA 9 97.37% (37/38) 94.12% (32/34) RIRLS[53] 50 Unknown 100%c (72/72) k-TSP[54] 18 Unknown 95.83%c (69/72) ERGS[21] 10 Unknown 98.61%c (71/72) Decision rules[37] 2 94.74% (36/38) 100% (34/34) Neighborhood analysis [32] 50 94.74% (36/38) 85.29% (29/34) PLS-LD[12] 50 100% (38/38) 97.06% (33/34) NSCLC dataset RT-PLSDA 7 94.87% (37/39) 94.74% (18/19) a
The numbers in parenthesis are the number of correctly classified samples and total samples, respectively.
b
‘‘unknown’’ Means that no related data are provided in the literature. c
except that Wilcoxon–Mann–Whitney (WMW) and effective range based gene selection (ERGS) method produce a slightly different accuracy. However, it may be noticeable that the accuracy by ERGS method was obtained by LOOCV of all the samples in the dataset, instead of the samples in the test set. For the lung cancer dataset, Gordon et al.[31]obtained the best classification among the sum-marized methods. The proposed method produces a similar result with the others including by k-top scoring pairs (k-TSP), ERGS, WMW and recursive feature elimination (RFE), which were ob-tained by LOOCV. For the leukemia dataset, the accuracy of the pro-posed method seems not as good as the previously reported ones. As for the NSCLC dataset, it is still difficult to find the reference data for comparison. The accuracy of 94.87% and 94.74% for the training and test sets is obtained by the proposed method.
Clearly, the proposed method cannot outperform all the exist-ing methods. However, it can outperform some of the published methods, and can obtain a comparable result with most of the pub-lished methods. The difference in the number of misclassified sam-ples is only one or two. More importantly, the results listed in Table 7for the proposed method were obtained by an independent test set, but that for most of the published methods were obtained by using LOOCV based on all the samples. Generally, the former ob-tains a more reasonable result. On the other hand, some of the methods producing high prediction percentage used too large or small number of the selected genes in the classification. For exam-ples, only one or two genes were used in the classification of pros-tate cancer dataset byk-TSP and WMW method and of lung cancer dataset by WMW, RFE and decision rules method. In some classifi-cation, however, more than 50 genes were employed. Such results may be difficult for a biological interpretation.
5. Conclusions
Randomization test is employed as a gene selection method. The method can evaluate the significance of a gene by a statistic of the regression coefficients in a series of random PLSDA models. Therefore, a few of the significant genes can be selected from the thousands or more genes in an expression data. With repetition of the calculations, the frequency number of a gene can be further used as a criterion to evaluate its significance. Four datasets of prostate cancer dataset, lung cancer dataset, leukemia dataset and NSCLC dataset are investigated by the method. 18, 4, 9 and 7 significant genes are identified, respectively, and the rationality of the results is validated by MLR modeling and PCA. Compared with the results obtained in previous studies, the superiority of the method is proved. Therefore, the method may be an alternative tool for classification using the expression data.
Acknowledgment
This work was supported by the National Natural Science Foun-dation of China (No. 21175074).
References
[1]Fang Z, Yang J, Li YX, Luo QM, Liu L. Knowledge guided analysis of microarray data. J Biomed Inform 2006;39:401–11.
[2]Wong H-S, Wang H-Q. Constructing the gene regulation-level representation of microarray data for cancer classification. J Biomed Inform 2008;41:95–105. [3]Wang H-Q, Wong H-S, Zhu HL, Yip TTC. A neural network-based biomarker association information extraction approach for cancer classification. J Biomed Inform 2009;42:654–66.
[4]Yeung KY, Ruzzo WL. Principal component analysis for clustering gene expression data. Bioinformatics 2001;17:763–74.
[5]Liu JJ, Cai WS, Shao XG. Cancer classification based on microarray gene expression data using a principal component accumulation method. Sci China Chem 2011;54:802–11.
[6]Li LP, Weinberg CR, Thomas AD, Pedersen LG. Gene selection for sample classification based on gene expression data: study of sensitivity to choice of parameters of the GA/KNN method. Bioinformatics 2001;17:1131–42. [7]Bushel PR, Hamadeh HK, Bennett L, Green J, Ableson A, Misener S, et al.
Computational selection of distinct class- and subclass-specific gene expression signatures. J Biomed Inform 2002;35:160–70.
[8]Pan F, Wang BY, Hu X, Perrizo W. Comprehensive vertical sample-based KNN/ LSVM classification for gene expression analysis. J Biomed Inform 2004;37:240–8.
[9]Blanco R, Inza M, Merino M, Quiroga J, Larranaga P. Feature selection in Bayesian classifiers for the prognosis of survival of cirrhotic patients treated with TIPS. J Biomed Inform 2005;38:376–88.
[10]Lutz U, Lutz RW, Lutz WK. Metabolic profiling of glucuronides in human urine by LC–MS/MS and partial least-squares discriminant analysis for classification and prediction of gender. Anal Chem 2006;78:4564–71.
[11]Peng YH. A novel ensemble machine learning for robust microarray data classification. Comput Biol Med 2006;36:553–73.
[12]Nguyen DV, Rocke DM. Tumor classification by partial least squares using microarray gene expression data. Bioinformatics 2002;18:39–50.
[13]Nguyen DV, Rocke DM. Multi-class cancer classification via partial least squares with gene expression profiles. Bioinformatics 2002;18:1216–26. [14]Pérez-Enciso M, Tenenhaus M. Prediction of clinical outcome with microarray
data: a partial least squares discriminant analysis (PLS-DA) approach. Hum Genet 2003;112:581–92.
[15]Furey TS, Cristianini N, Duffy N, Bednarski DW, Schummer M, Haussler D. Support vector machine classification and validation of cancer tissue samples using microarray expression data. Bioinformatics 2000;16:906–14. [16]Niijima S, Kuhara S. Recursive gene selection based on maximum margin
criterion: a comparison with SVM-RFE. BMC Bioinformatics 2006;7:543. [17]Saeys Y, Inza I, Larranaga P. A review of feature selection techniques in
bioinformatics. Bioinformatics 2007;23:2507–17.
[18]Yeoh EJ, Ross ME, Shurtleff SA, Williams WK, Patel D, Mahfouz R, et al. Classification, subtype discovery, and prediction of outcome in pediatric acute lymphoblastic leukemia by gene expression profiling. Cancer Cell 2002;1:133–43.
[19]Ooi CH, Tan P. Genetic algorithms applied to multi-class prediction for the analysis of gene expression data. Bioinformatics 2003;19:37–44.
[20]Díaz-Uriarte R, Alvarez de Andrés S. Gene selection and classification of microarray data using random forest. BMC Bioinformatics 2006;7:3. [21]Mahata P, Mahata K. Selecting differentially expressed genes using minimum
probability of classification error. J Biomed Inform 2007;40:775–86. [22]Shen Q, Shi WM, Kong W. New gene selection method for multiclass tumor
classification by class centroid. J Biomed Inform 2009;42:59–65.
[23]Peng YH, Wu ZQ, Jiang JM. A novel feature selection approach for biomedical data classification. J Biomed Inform 2010;43:15–23.
[24]Liu HW, Liu L, Zhang HJ. Ensemble gene selection by grouping for microarray data classification. J Biomed Inform 2010;43:81–7.
[25]Chandra B, Gupta M. An efficient statistical feature selection approach for classification of gene expression data. J Biomed Inform 2011;44:529–35. [26]Cai WS, Li YK, Shao XG. A variable selection method based on uninformative
variable elimination for multivariate calibration of near-infrared spectra. Chemometr Intell Lab 2008;90:188–94.
[27]Xu H, Liu ZC, Cai WS, Shao XG. A wavelength selection method based on randomization test for near-infrared spectral analysis. Chemometr Intell Lab 2009;97:189–93.
[28]Shao XG, Zhang M, Cai WS. Multivariate calibration of near-infrared spectra by using influential variables. Anal Methods 2012;4:467–73.
[29]Shao XG, Du GR, Jing M, Cai WS. Application of latent projective graph in variable selection for near infrared spectral analysis. Chemometr Intell Lab 2012;114:44–9.
[30]Singh D, Febbo PG, Ross K, Jackson DG, Manola J, Ladd C, et al. Gene expression correlates of clinical prostate cancer behavior. Cancer Cell 2002;1:203–9. [31]Gordon GJ, Jensen RV, Hsiao L-L, Gullans SR, Blumenstock JE, Ramaswamy S,
et al. Translation of microarray data into clinically relevant cancer diagnostic tests using gene expression ratios in lung cancer and mesothelioma. Cancer Res 2002;62:4963–7.
[32]Golub TR, Slonim DK, Tamayo P, Huard C, Gaasenbeek M, Mesirov JP, et al. Molecular classification of cancer: class discovery and class prediction by gene expression monitoring. Science 1999;286:531–7.
[33]Kuner R, Muley T, Meister M, Ruschhaupt M, Buness A, Xu EC, et al. Global gene expression analysis reveals specific patterns of cell junctions in non-small cell lung cancer subtypes. Lung Cancer 2009;63:32–8.
[34]Kennard RW, Stone LA. Computer aided design of experiments. Technometrics 1969;11:137–48.
[35]Haaland DM, Thomas EV. Partial least-squares methods for spectral analyses. 1. Relation to other quantitative calibration methods and the extraction of qualitative information. Anal Chem 1988;60:1193–202.
[36]Chu W, Ghahramani Z, Falciani F, Wild DL. Biomarker discovery in microarray gene expression data with Gaussian processes. Bioinformatics 2003;21:3385–93.
[37]Dagliyan O, Uney-Yuksektepe F, Kavakli H, Turkay M. Optimization based tumor classification from microarray gene expression data. PLoS ONE 2011;6:e14579.
[38]Varadan V, Anastassiou D. Inference of disease-related molecular logic from systems-based microarray analysis. PLoS Comput Biol 2006;2:e68.
[39]Wang XS, Gotoh O. Accurate molecular classification of cancer using simple rules. BMC Med Genomics 2009;2:64.
[40]Karan D, Kelly DL, Rizzino A, Lin M-F, Batra SK. Expression profile of differentially-regulated genes during progression of androgen-independent growth in human prostate cancer cells. Carcinogenesis 2002;23:967–76. [41]Magee JA, Araki T, Patil S, Ehrig T, True L, Humphrey PA, et al. Expression
profiling reveals hepsin overexpression in prostate cancer. Cancer Res 2001;61:5692–6.
[42]Dhanasekaran SM, Barrette TR, Ghosh D, Shah R, Varambally S, Kurachi K, et al. Delineation of prognostic biomarkers in prostate cancer. Nature 2001;412:822–6.
[43]Walport MJ. Complement. First of two parts. N Engl J Med 2001;344:1058–66. [44]Hokaiwado N, Takeshita F, Naiki-Ito A, Asamoto M, Ochiya T, Shirai T. Glutathione S-transferase Pi mediates proliferation of androgen-independent prostate cancer cells. Carcinogenesis 2008;29:1134–8.
[45]Kishino H, Waddell PJ. Correspondence analysis of genes and tissue types and finding genetic links from microarray data. Genome Inform 2000;11:83–95. [46]Wang XS, Simon R. Microarray-based cancer prediction using single genes.
BMC Bioinformatics 2011;12:391.
[47]Hasegawa T, Takeuchi A, Miyaishi O, Xiao H, Mao J, Isobe K. PTRF (polymerase I and transcript-release factor) is tissue-specific and interacts with the BFCOL1 (binding factor of a type-I collagen promoter) zinc-finger transcription factor which binds to the two mouse type-I collagen gene promoters. Biochem J 2000;347:55–9.
[48]Yoo CK, Gernaey KV. Classification and diagnostic output prediction of cancer using gene expression profiling and supervised machine learning algorithms. J Chem Eng Jpn 2008;41:898–914.
[49]Bø TH, Jonassen I. New feature subset selection procedures for classification of expression profiles. Genome Biol 2002;3:111. research0017.1–0017.11. [50] Thomas JG, Olson JM, Tapscott SJ, Zhao LP. An efficient and robust statistical
modeling approach to discover differentially expressed genes using genomic expression profiles. Genome Res 2001;11:1227–36.
[51]Crawford AW, Beckerle MC. Purification and characterization of zyxin, an 82000-dalton component of adherens junctions. J Biol Chem 1991;266:5847–53.
[52]Fisher RA. The statistical utilization of multiple measurements. Ann Eugen 1938;8:376–86.
[53]Fort G, Lambert-Lacroix S. Classification using partial least squares with penalized logistic regression. Bioinformatics 2005;21:1104–11.
[54]Tan AC, Naiman DQ, Xu L, Winslow RL, German D. Simple decision rules for classifying human cancers from gene expression profiles. Bioinformatics 2005;21:3896–904.
[55]Kelemen JZ, Kertesz-Farkas A, Kocsor A, Puskas LG. Kalman filtering for disease-state estimation from microarray data. Bioinformatics 2006;22:3047–53.
[56]Ein-Dor L, Kela I, Getz G, Givol D, Domany E. Outcome signature genes in breast cancer: is there a unique set? Bioinformatics 2005;21:171–8.
![Table 4 lists the information of the four genes for the lung can- can-cer datasets. The first gene (AL050224) has been selected by Wang and Simon [46]](https://thumb-us.123doks.com/thumbv2/123dok_us/10105695.2911045/4.892.76.427.101.353/table-lists-information-genes-datasets-first-selected-simon.webp)
![Table 5 presents a summary of the nine genes for the leuke- leuke-mia datasets. As labeled in the table, all of the nine genes have been identified as significant ones in previous studies [32,48,49].](https://thumb-us.123doks.com/thumbv2/123dok_us/10105695.2911045/5.892.53.833.130.390/presents-summary-datasets-labeled-identified-significant-previous-studies.webp)

