A VALUE-BASED, POLICY DRIVEN METHODOLOGY FOR SUSTAINABLE, RESILIENT, FLOOD-DISASTER PLANNING
by
Josey Chacko Ph. D. Student
Department of Business Information Technology Virginia Polytechnic Institute and State University
Blacksburg, VA 24061 540.231.5051 (voice)
540.231.3752 (fax) [email protected]
to be submitted to the Student Paper Competition of the Southeastern Chapter of the Decision Sciences Institute
A VALUE-BASED, POLICY DRIVEN METHODOLOGY FOR SUSTAINABLE, RESILIENT, FLOOD-DISASTER PLANNING
ABSTRACT
This paper describes a policy-driven approach to both mitigation and recovery planning for communities impacted by flooding. The methodology prescribes actions to counter disaster effects that threaten goals tacit behind a given policy. Results in terms of damages, resilience measures, and resource levels are generated for each policy considered; this provides local planning groups sufficient information to examine the effects of implementing various policy options. An example is provided to illustrate the procedure. Conclusions are drawn and future work described.
1 A VALUE-BASED, POLICY DRIVEN METHODOLOGY FOR
SUSTAINABLE, RESILIENT, FLOOD-DISASTER PLANNING
1.0 INTRODUCTION
Sudden-onset natural disasters, including earthquakes, floods, and tsunamis, continue to threaten life and property across the world and are demanding increased attention from researchers as to planning, mitigation, and proper response. The recent earthquake and tsunami in Japan is a grim example of a disaster and the ensuing responses taken to return a country to normalcy.
Certain themes are emerging from researchers in terms of disaster planning and response, and these include such concepts as disaster resilience, goal-driven methodologies, and sustainability. Because natural disasters can reoccur, it is important to evaluate plans and responses not just in terms of the amelioration and recovery from an immediate disaster, but also in scenarios that consider the goals of a community attendant with both short-term recovery and long-range sustainability.
1.1 Disasters and Resilience
A system’s response to a disaster depends on the systems’ resilience (Cutter et al, 2008). Resilience as defined by Cutter is the ability of a system to recuperate from a disaster and “bounce back” to its original operational functions or to a better functional level, and is generally considered a function of rapidity and robustness, as may be seen in Figure 1. In this figure, system quality is plotted versus time; at the time of a disaster, a sudden, vertical drop in system quality occurs, and the ability of a system to recuperate from a disaster lies in its ability to limit damages resulting from the disaster (robustness) and secondly the speed with which the system is able to get back to full functionality (rapidity).
2 Research in the area of resilience with respect to post-disaster recovery has long been qualitative in nature. But, based on original work and definitions by Bruneau et al. [2003], Zobel has defined a resilience measure for both single disaster events [Zobel, 2010] and multi-disaster events [Zobel & Khansa, 2011] so that decision makers can now guide their decisions by using resilience as a quantitative measure that incorporates the time–based (dynamic) effects of a disaster.
Figure 1: Resilience Triangle (adapted from [Zobel 2010)])
There is hope that the dynamic definition of resilience can be melded with studies of pre- and post-disaster static resilience by Cutter et al. (Cutter, Burton et al. 2010). Miles and Chang [2011] have developed clever and intricate mathematical models of post-disaster recovery. However, at this point very little work exists in creating an overarching quantitative framework that connects pre-disaster resilience to post-disaster resilience, much less to subsequent disasters suffered by the community. Such a framework could provide an avenue for improved decision making, which would enable more effective use of resources toward such goals as maximizing community resilience and enabling sustainable recovery. Stated differently, there is a need for
3 tying social goals or policies to disaster planning, and to the resulting resilience posture of the impacted communities.
1.2 A Goal-Driven Methodology
Much outstanding research has been performed developing so-called indicator models that describe a community’s resilience position at a given point in time. Birkmann in a 2006 review of various measures of disaster resilience, noted however that indicator models exploring vulnerability (the lack of resilience), lack a strong theoretical connection between the disaster goal or policy pursued and the resulting impact on the community as described by various measures of disaster resilience. Moreover, he pointed out that most vulnerability indicator models have no clear connection between resources and disaster actions (Birkmann 2006). He then suggested that good indicator methodology must employ goals to define the appropriate characteristics of interest, which in turn provides a better estimate of resilience for disaster impact assessment on a multi-dimensional scale.
The methodology advanced in this paper attempts to address this deficiency in linkage from policy to effects during and after a disaster. In particular, this research makes an explicit connection between a policy choice, decisions that accrue as a result of that choice, and the resulting status/recovery/resilience the community achieves.
1.3 Sustainable Recovery
One of the goals set forth by planners, researchers, etc., is sustainable recovery. Sustainable disaster recovery is a process shaped by social, economic, natural, and physical elements and implemented through both pre-disaster and post-disaster actions. While the concept of sustainability has been adopted by hazard researchers and applied to mitigation, sustainable
4 recovery following a disaster is not a widespread phenomenon, particularly in the United States (Smith and Wenger, 2007).
Characterization of sustainable disaster recovery includes the following elements [(Smith & Wenger, 2007; Wiek, Ries, Thabrew, Brundiers, & Wickramasinghe, 2010)]:
1. It is locally driven. Decision making is driven by the local community and emphasizes inclusion of all stakeholders in a transparent manner.
2. It uses local income. Through pre-disaster planning, there are post-disaster sources of local income for the community.
3. There is a long-term focus. Decision making includes a long-term perspective in which the effects of decisions transcend the initial disaster.
4. Disaster planning and response are compatible with current institutional settings. Disaster planning and management are built into current governmental systems, and include the development of local, state and federal policies that enable sustainable recovery.
5. There is an emphasis on post-disaster recovery that aims to bring to equilibrium the effects of disasters on differing levels of social vulnerability and power.
1.4 Purpose and Structure of this Paper
This paper describes a policy-driven approach to both mitigation and recovery planning for communities impacted by flooding. Note that it does not prescribe any specific policy. Rather it generates consequences for each given policy to be evaluated. In particular, for each policy considered, the methodology prescribes actions to counter disaster effects that threaten goals tacit behind that policy; results in terms of damages, resilience measures, and resource levels are subsequently generated. These output measures for each policy to be evaluated are then
5 provided to local planning groups so that they may intelligently examine the various consequences of implementation.
Section 2 describes the design of a proposed methodology that develops dynamic resilience indicators through the development of goals that follow through on various policy options – including sustainable recovery. Section 3 provides a descriptive disaster example, in which the proposed methodology is applied. The next section (4) provides the solution reached using the methodology. Section 5 discusses future work that is now underway to enhance the designed methodology. Finally, in section 6, conclusions are drawn.
2.0 A Value-Based Methodology for Flood-Disaster Planning
In this section a disaster planning methodology for flooding is outlined. The proposed methodology does not deal with planning during the flood (for example, which individuals should be rescued first and which fallen trees should be removed from which roads and in what order). Rather, the methodology seeks to address larger-view issues pre-disaster such as, what may the community do to mitigate against possible effects of a potential flood, as well as post-disaster planning concerning recovery. An example of mitigation would be when and where a community should build levees; an example of a recovery decision would be whether to rebuild homes in a flood plain.
2.1 Set Policy Options
The first step in the methodology (see Figure 2) is to set all policy options of interest. For example, three fictitious (but very possible) policy options are listed in Table 1; we refer to these as the Min (Community) Cost option; the Economically Driven option; and the Sustainable policy alternative. (We will use these three policy options in the example of section 3.) Each option implies certain philosophical (i.e., value-based) assumptions tacitly. In Table 1 we
6 assume for the sake of illustration several such values. The point is not that these philosophical assumptions are correct and should be adopted; rather, it is that the community in question’s policy with tacit goals should be surfaced.
Figure 2. A Methodology for Policy-Driven, Sustainable, and Resilient Flood-Planning and Recovery
7 1. 2. 3. 4. 5. 6. 7. 8. 9. 10. 11. 12. 13. 14. 15. 16. 17.
Table 1. Underlying Philosophies behind Policy Decisions
2.2 Develop Appropriate Goals for Each Policy under Consideration
In this step of the methodology, practical goals are developed that, if met, will ensure successful implementation of the policy and its goals, within financial bounds. For example, a community may have a high proportion of elderly residents, and it may set the practical goals that (1) it will
THREE (FICTITIOUS) RECOVERY POLICIES and THEIR UNDERLYING PHILOSOPHIES
Policy 1: Minimize (Community) Cost Philosophy:
Rather than invest money that most probably will be wasted, we will gamble that either the flood will not hit us, or if it does, we will be able to get federal aid.
Times are hard and funds are limited. If we do “get hit,” we will repair and rebuild with particular attention to minimizing cost.
If we do get flooding, this will not be the time to correct social inequities.
If it does flood, we will allow contractors to rebuild in the flood plain if that is their best option. Policy 2: Economically Driven
Philosophy:
We will make decisions that are in the financial best interests of our community. That will determine mitigation levels within each area of the community.
We will ensure that those who are most likely to contribute the most financially to our community have top priority in receiving available funds.
This is not the time to correct social inequities.
We will allow contractors to rebuild less expensive neighborhoods in the flood plain if that helps builders and contractors financially.
Policy 3: Sustainable Philosophy:
We will attempt to minimize dependence on the federal or state government. We will mitigate against possible flooding.
We will take the long view with our planning to mitigate against future floods. If it does flood, we will not allow rebuilding in the flood plain.
We will not allow a disaster to let the “rich get richer and the poor poorer.” That is, if we do get flooding, we will not allow the financially less fortunate to be struck disproportionately.
8 be prepared to have sufficient volunteers trained and available and (2) sufficient handicap-equipped vehicles with drivers to assist the elderly in the case of an evacuation.
2.3 List Possible Disaster Events that Threaten Policy Goals
This step lists all possible events of nature and otherwise that threaten the goals developed in the previous section. Possible events of nature would include such happenings as (1) roads are flooding; (2) power poles are down and electricity is out; (3) water accumulates to a significant level; and (4) water levels remain after 7 days.
2.4 Determine Activity Clusters that Countermand Possible Disaster Events
In this portion of the methodology, activities are stipulated that ameliorate or prevent each event in the previous step. For example, a town may choose to ensure that, in the event of possible flooding, sandbags are placed around its most lucrative businesses and the homes of the wealthiest individuals in the town. Alternatively, a community may choose to restore essential (“lifeline”) services first.
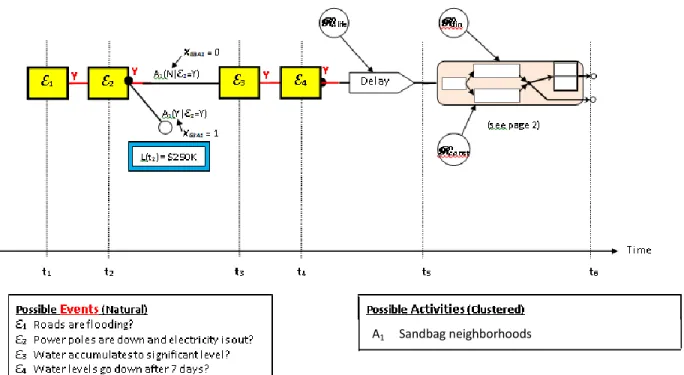
Steps 2.3 and 2.4 may often be combined into a decision tree. Figure 3 shows a simplified situation of four events and a corresponding activity (A1: sandbagging) that mitigates against Event 2. This activity may be undertaken, in which case there is a corresponding financial loss of $250K (primarily the cost of the sandbags and labor); or the activity may be ignored, in which case one must traverse further down the tree to ascertain consequences such as property damages, health risks, etc. Since each event has a probability of occurrence, an expected value may be calculated at each node, and the tree may be solved to determine which activities make economic sense for this given policy.
(Due to the space limitations, no decision trees will be included in the illustrative example developed in Section 3.)
9 2.5 Determine Access to Financial and Construction Resources
Access to financial and construction resources determine the post-disaster recovery process, in terms of duration and level of rebuilding. This methodology explicitly incorporates household attributes, decisions, and functions (such as insurance and personal savings), as well as business attributes and functions, enhancing similar work in the ResilUS model developed by Miles and Chang [2011]. By aggregating over businesses and then households in a community, a pool of funds is determined that can be added to other sources of capital, including federal and state funds, NGO’s, etc.
2.6 Optimize/Satisfice
Using the information developed in the five steps above, decision trees may be solved (using expected values), policy goals may be prioritized, and a resulting lexicographic goal
A1 Sandbag neighborhoods
10 programming problem (gpp) written for each policy under consideration. Using pseudo random numbers, probabilities may be drawn to determine possible disaster/recovery scenarios, and each resulting gpp may be solved to “optimality.” By simulating thousands of scenarios for each policy, a most likely, satisficed solution may be generated for each policy option.
2.7 List Measures: Resources, Resilience, etc.
In step 2.6 above, the methodology evaluates each policy under consideration by a community and generates measures, damages, resources levels, and resilience that ensue with that policy. Planners may then clearly see the ramifications of possible choices and hence make a more-informed decision. The methodology also provides a solution for consequences under recurring disasters.
3.0 A Flooding Example
The community chosen to illustrate the methodology of this paper is the Hampton Roads area of Virginia, and as such, the maps and 2010 Census Data utilized in this paper are taken from this area. However, as there is no intention to dictate to Hampton Roads what their planning policies should be and how they should respond to flood disasters, the rest of the data used in this example is fabricated. Consequently, to emphasize this point, the community under study in this example is referred to as Floodville.
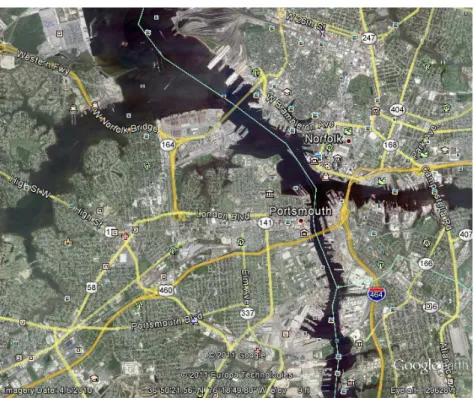
A Google map rendering of Floodville is shown in Figure 4a, and a FEMA risk-of-flooding overlay is shown in Figure 4b. Figure 5 provides the median income for Floodville for the same area. Note in this figure that the median income has been stratified into three groups: those with median annual income above $70,000 (called “upper”); those less than $27,000 (termed “lower”); and those in between (“middle”). Finally, Figure 6 provides the flood risk overlay together with the annual median income overlay – all on one map.
11 Figure 4a. Google Map Image of Example Community
Figure 4b. Same Google Map Image shown in Fig 4a with a Flood Hazard Overlay Added. Key: Shaded Red Area – High Flood Risk
12 Figure 5. Economic Level Overlay
Key: Light Median Household Income of up to $27,000
Red/Brown/Yellow Median Household Annual Income of $27,000 – $70,000 Dark Median Household Annual Income in excess of $70,000
13 Figure 6. Flood Hazard Overlay plus Population Density Overlay
3.1 Set Policy Options for the Example Community
The first step in the methodology (see Figure 2) is to determine and specifyall policy options of interest. In this fabricated example, the three policy options of Table 1 are utilized, namely:
Policy 1: the Min (Community) Cost option. [With this policy, the overarching concern is to minimize the cost to the community of Floodville of any flooding.] Policy 2: the Economically Driven option. [With this second policy, the primary
interest is to promote and enhance the economic well-being of the community. This implies helping key businesses and the key contributors to the tax base.]
14 Policy 3: the Sustainable policy alternative. [Here the focus is on taking the “long view” and planning to mitigate against not just an imminent flood, but those “down the road.”]
3.2 Develop Appropriate Goals for Each Policy under Consideration
For pedagogical purposes, only four goals are defined in this example for each of the three policies. (See Table 2, the first two columns, for a summary):
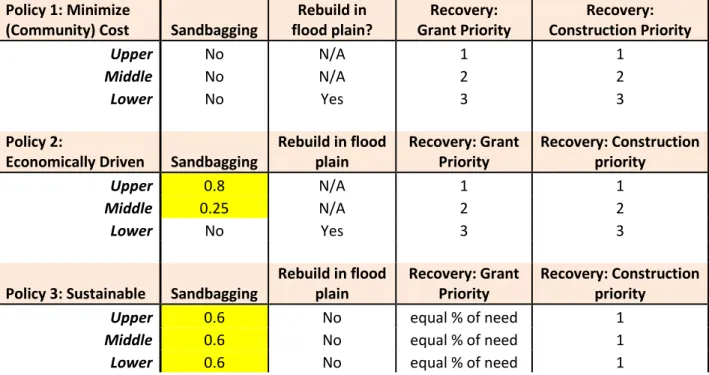
Policy 1: the Min (Community) Cost option. Being hard pressed financially, Floodville will not expend any funds at this time to mitigate against a future flood. Should a flood occur, the community will not impose any new building restrictions.
Policy 2: the Economically Driven option. Floodville will expend some limited funds at this time to mitigate against a future flood, but the priority will be to protect those businesses and homes most critical to the tax base. Should a flood occur, the community will not impose any new building restrictions.
Policy 3: the Sustainable policy alternative. Floodville will expend some limited funds at this time to mitigate against a future flood, but the priority will be to allocate funds across all income strata so that the lower income homes do not bear a disproportionate share of the burden of the disaster. Should a flood occur, the community will impose new building restrictions that prohibit funding being provided in areas likely to be struck by a future flood.
3.3 List Possible Disaster Events that Threaten Policy Goals
The major event considered in this simplified example is that flooding will occur at levels that threaten both homes and businesses across the town of Floodville.
3.4 Determine Activity Clusters that Countermand Possible Disaster Events
For each policy, here are the activities consistent with the goals set above. See the first two columns of Table 2.
Policy 1: the Min (Community) Cost option.
sandbagging: No part of town will be sandbagged.
rebuilding in the flood plain: The town will allow this. Note, however, that as only those in the lower median income category presently have homes in the flood plain, only they will be affected.
15
sandbagging: The community will be sandbagged, but as funds are limited, only up to the budgeted amount. Practically, this means 80% of the upper median-income homes will be protected and 25% of the middle median-median-income homes.
rebuilding in the flood plain: The town will allow this. Note, however, that as only those in the lower median income category presently have homes in the flood plain, only they will be affected.
Policy 3: the Sustainable policy alternative.
sandbagging: The community will be sandbagged, but as funds are limited, only up to the budgeted amount. Practically, this means that only 60% of all homes (regardless of median income) will be protected.
rebuilding in the flood plain: The town will not allow this.
Policy 1: Minimize
(Community) Cost Sandbagging
Rebuild in flood plain? Recovery: Grant Priority Recovery: Construction Priority Upper No N/A 1 1 Middle No N/A 2 2 Lower No Yes 3 3 Policy 2:
Economically Driven Sandbagging
Rebuild in flood plain Recovery: Grant Priority Recovery: Construction priority Upper 0.8 N/A 1 1 Middle 0.25 N/A 2 2 Lower No Yes 3 3
Policy 3: Sustainable Sandbagging
Rebuild in flood plain Recovery: Grant Priority Recovery: Construction priority
Upper 0.6 No equal % of need 1
Middle 0.6 No equal % of need 1
Lower 0.6 No equal % of need 1
Table 2. Policy Options/Decisions Considered for the Example
3.5 Determine Access to Financial and Construction Resources
Access to financial and construction resources determine the post-disaster recovery process, in terms of duration and level of rebuilding. To simplify the exposition of this example, we assume
16 funds in terms of a recovery grant are received from the federal government and that the primary issue for Floodville is to determine the distribution of these funds. The decisions under each policy are shown in the last two columns of Table 2 and are as follows:
Policy 1: the Min (Community) Cost option.
recovery grant priority: Funds will be expended, until depleted, in the priority order of upper median-income home reparation, then middle income homes, and finally lower-income homes.
construction priority: Construction resources will be allocated in the same order as recovery grant monies, namely upper, then middle, then lower.
Policy 2: the Economically Driven option.
recovery grant priority: Funds will be expended, until depleted, in the priority order of upper median-income home reparation, then middle income homes, and finally lower-income homes.
construction priority: Construction resources will be allocated in the same order as recovery grant monies, namely upper, then middle, then lower.
Policy 3: the Sustainable policy alternative.
recovery grant priority: Funds will be expended, until depleted, without regard to median income. That is to say, all income groups will receive funding so that each gets an equal percentage based on need.
construction priority: Construction resources will be allocated in the same order as recovery grant monies, namely without regard to income, but rather based on need.
3.6 Optimize/Satisfice
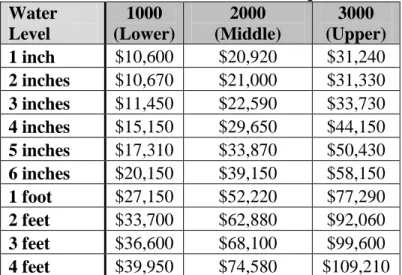
Using the information developed in the five steps above, an Excel program was developed to determine the optimal solution under each policy. Additional parameters were set (not shown here) such as size of homes (square feet) in each income group, the amount of surge/flooding occurring, etc. Damage estimates (see Figure 7) were made using data provided by the U.S. government online [Cost of Flooding].
17 Size of Home: Area in Square Feet
Water Level 1000 (Lower) 2000 (Middle) 3000 (Upper) 1 inch $10,600 $20,920 $31,240 2 inches $10,670 $21,000 $31,330 3 inches $11,450 $22,590 $33,730 4 inches $15,150 $29,650 $44,150 5 inches $17,310 $33,870 $50,430 6 inches $20,150 $39,150 $58,150 1 foot $27,150 $52,220 $77,290 2 feet $33,700 $62,880 $92,060 3 feet $36,600 $68,100 $99,600 4 feet $39,950 $74,580 $109,210
Figure 7. FloodMap: A Flood Disaster Damage Estimator Source: The Cost of Flooding, 2011,
http://www.floodsmart.gov/floodsmart/pages/flooding_flood_risks/the_cost_of_flooding.jsp
3.7 List Measures: Resources, Resilience, etc.
Measures from the Excel program were generated and are shown in the next section.
4.0 Solution & Results
Many different output measures are generated by this methodology, and in fact, one of the key goals of this research stream is to determine those measures that best equip communities (and ultimately state and federal planners as well) with the information they need to make the wisest decisions.
In this section, what the author believes is one of the more interesting output measures is illustrated. This measure addresses those areas such as the east coast of the United States that face repeated disasters, such as (perhaps) three category 2 hurricanes or worse over a decade. In particular, this measure takes the disaster stipulated and then postulates that two more
18 occurrences of the same magnitude disaster occur in the short term. That is, this measure assumes that three identical back-to-back-to-back disasters occur. With this measure, myopic strategies should suffer in comparison to those that are more long-range in their planning. Conversely, decisions made using this measure would most likely be unnecessarily costly in regions where repeated disasters are rare. [Note that all measures in this methodology do not assume multiple disasters; rather, one is merely selected here to demonstrate the types of questions that can be addressed with this methodology.]
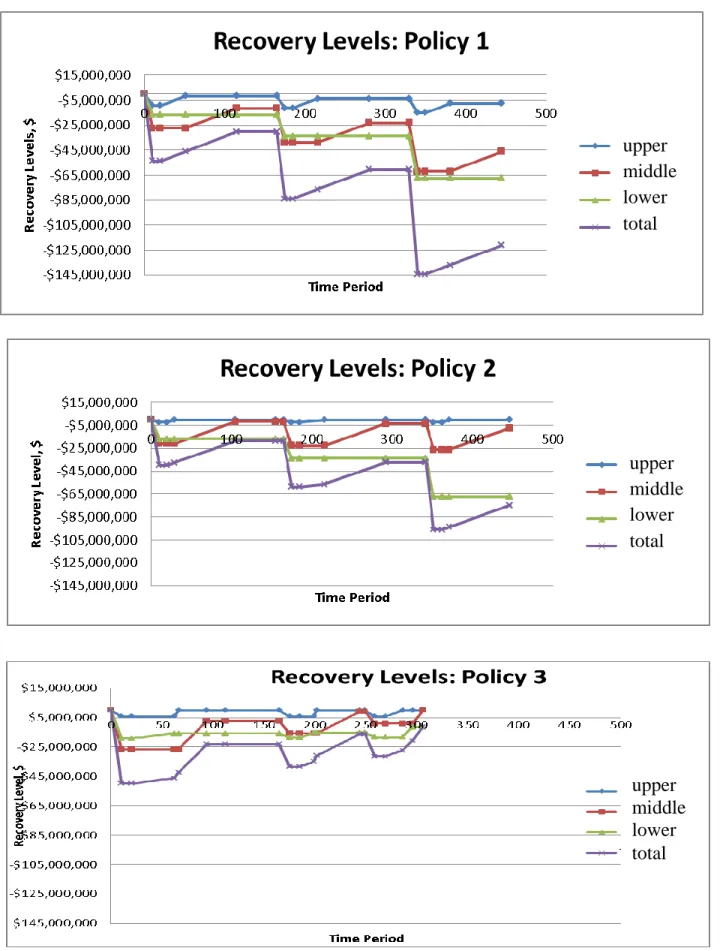
Figure 8 shows the recovery levels recorded over the cumulative impacts of the three subsequent disasters for each of the three policies. Each policy is drawn with similar scales for ease of comparison. Disaster 1 occurs at time 0, and is shown as the initial decline in recovery levels in each of the plots. Three “dips” are shown for each policy; each dip corresponds to a new disaster. For the sustainable disaster recovery policy, over disaster 1, damage levels also include the costs of moving households from floodplains, since rebuilding in the flood plains is no longer allowed by policy option 3, to higher ground.
One may conclude from Figure 8 that policy option 3 may not be the best option (economical is better) over the short term (disaster periods one and maybe two), but it in fact is the best policy over the long term (after disaster 3).
19 Figure 8. Cumulative Damage Results over Time for the Example
upper middle lower total upper middle lower total upper middle lower total
20 Additional measures are directly calculated by the methodology, but some may also be inferred directly from Figure 8. For example, resilience is a function of robustness (recovery levels) and rapidity (recovery durations). Higher recovery levels and faster recovery durations represent higher resilience measures. Thus, from the results of Figure 8, it is seen that policy option 3 has a higher resilience than either of the other two options over the three disaster periods.
5.0 Implications and Future Work
The work presented in this paper evaluates a simplified disaster example and as such, future research work in this area is fertile as more complex features are integrated. Some of the issues worthy of future work include evaluating various tradeoffs the different policy options offer. For example, the sustainable policy option should be more advantageous in locations where disasters are frequent, and should be less promising in areas where repetitive disasters occur less frequently; determining the “breakeven point” would be helpful. A second tradeoff issue to explore would be when, as a function of the number of households in a floodplain, to ban rebuilding in that floodplain.
Another potential area for investigation is to incorporate the interactions of other agents in this disaster recovery model. For example, how would the inclusion of other agents such as nearby communities, NGOs, and FBOs affect disaster recovery?
Finally, a third area of future work is to include other aspects of resilience such as social, institutional, environmental factors, and to determine how specific policy options have different effects on these dimensions of resilience.
21 6.0 Conclusions
In this paper, the author has developed a policy-driven methodology that iterates through each policy under consideration by a community and proceeds to generate measures, damages, resource levels, and resilience that ensue with each of these policies. Using this approach, planners may clearly see the ramifications of possible choices they are making and hence make better-informed decisions.
Acknowledgements
This research was funded in part by the Institute for Society, Culture and Environment at Virginia Tech.
REFERENCES
(2011, 10/17/2011). "The Cost of Flooding." Retrieved October 26, 2011, from http://www.floodsmart.gov/floodsmart/pages/flooding_flood_risks/the_cost_of_flooding.jsp. Birkmann, J. (2006). Indicators and the criteria for measuring vulnerability: Theoretical bases and requirements. Measuring vulnerability to natural hazards: towards disaster resilient societies. J. Birkmann. Tokyo, United Nations University Press: 55 - 77.
Bruneau, M., Chang, S. E., Eguchi, R.T., Lee, G. G., O’Rourke, T. D., and Reinhorn, A. M. (2003). A framework to quantitatively assess and enhance the seismic resilience of communitites. Earthquake Spectra 19(4): 733-752.
Cutter, S. L., Barnes, L., Berry, M., Burton, C., Evans, E., Tate, E., & Webb, J. (2008). A place-based model for understanding community resilience to natural disasters. Global Environmental Change-Human and Policy Dimensions, 18(4), 598-606.
Cutter, S. L., C. G. Burton, et al. (2010). "Disaster Resilience Indicators for Benchmarking Baseline Conditions." Journal of Homeland Security and Emergency Management 7(1).
Miles, S. B. and S. E. Chang (2011). "ResilUS: A Community Based Disaster Resilience Model." Cartography and Geographic Information Science 38(1): 36-51.
Smith, G. P. and D. Wenger (2007). Sustainable Disaster Recovery: Operationalizing an Existing Agenda. Handbook of Disaster Research. H. Rodriguez, E. L. Quarantelli and R. R. Dyes. New York, Springer: 234 - 257.
Wiek, A., Ries, R., Thabrew, L., Brundiers, K., & Wickramasinghe, A. (2010). “Challenges of sustainable recovery processes in tsunami affected communities.” Disaster Prevention and Management, 19(4), 423-437.
Zobel, C. W. (2010). "Comparative Visualization of Predicted Disaster Resilience." Proceedings of the 7th International ISCRAM Conference – Seattle, USA, May 2010.
Zobel, C. W. (2011). "Representing perceived tradeoffs in defining disaster resilience." Decision Support Systems 50(2): 394-403.
Zobel, C. W., and Khansa, L. (2011). Characterizing multi-event disaster resilience. Computers & Operations Research, Special Issue on MCDM in Emergency Management.
![Figure 1: Resilience Triangle (adapted from [Zobel 2010)])](https://thumb-us.123doks.com/thumbv2/123dok_us/10148933.2916504/4.918.141.468.408.658/figure-resilience-triangle-adapted-zobel.webp)