MONAURAL SPEECH ENHANCEMENT BASED ON TWO STAGE LONG SHORT-TERM
MEMORY NETWORKS
Yang Xian
1, Yang Sun
1, Wenwu Wang
2, Syed Mohsen Naqvi
11
Intelligent Sensing and Communications Research Group, Newcastle University, UK
2Centre for Vision, Speech and Signal Processing, University of Surrey, UK
ABSTRACT
The performance of the deep neural networks (DNNs) based monaural speech enhancement methods is still limited in real room environments, particularly for the speaker-independent case. The surface reflections and unseen speakers increase the challenge in the estimation of sources from reverberant noisy speech mixtures. To address these issues, we propose a two-stage approach using long short-term memory (LSTM) networks. In the first stage, the dereverberation mask (DM) is obtained by using a trained LSTM, which aims to dereverber-ate the noisy speech mixture. In the second stage, the ideal ratio mask (IRM) is estimated by the second trained LSTM, which is exploited to separate the desired speech signal from the dereverberated speech mixture. The signal-to-distortion ratio (SDR) shows the efficacy of the LSTMs over DNNs.
Index Terms— deep neural networks, monaural speech enhancement, reverberant room environments, long short-term memory networks
1. INTRODUCTION
Speech enhancement has potential applications in many fields such as hearing aids and robotics. [1–3]. A variety of meth-ods have been developed for speech enhancement and sep-aration, including statistical signal processing based meth-ods e.g. independent component analysis (ICA), independent vector analysis (IVA) [4,5], and computational auditory scene analysis (CASA) based methods [6, 7].
Nowadays, DNNs have shown great potential particularly for monaural speech enhancement. Narayanan et al. extracted the spectro-temporal information such as time-frequency (T-F) features from the training data, and then use trained DNN to estimate the speech spectra or masks [8, 9]. Huang et al. proposed the joint optimization by using recurrent neural net-work (RNN) for monaural speech enhancement [10]. Willi-amson et al. employed the phase and magnitude informa-tion to build the complex ideal ratio mask (cIRM) [11] which enhances the robustness of the IRM [9]. Sun et al. pro-posed the two-stage monaural speech separation with DNNs to solve the reverberant speech separation problem [12]. The vanilla DNN utilizes a window to capture temporal dynamics,
which is insufficient for speaker characterization and speech enhancement [13]. The enhancement performance of these state-of-the-art methods needs to be improved within rever-berant room environments for speaker-independent case.
Recently, the LSTM achieves great success in the field of speech processing [14], thanks to its ability in capturing the temporal information. It is better suited to process the sequen-tial data than other types of neural network e.g. DNNs. In this paper, the LSTMs are introduced to further improve our recently proposed two-stage DNNs method [12]. We focus on reverberant monaural speech enhancement for the speaker-independent case. The long-term speech context is captured by the LSTM, which improves the robustness of the system. Two parallel LSTMs are used to estimate two different train-ing target, One of LSTMs is used to estimate DM, another LSTM is applied to estimate IRM. Then, both DM and IRM are integrated for speech enhancement.
The remainder of the paper is organized as follows. Sec-tion 2 describes the proposed two-stage LSTMs based system. Then, Section 3 shows the experimental settings and results. Section 4 draws the conclusions and provides forecast future work.
2. ALGORITHM DESCRIPTION 2.1. The Proposed Method
The reverberant noisy speech mixture can be expressed as [12]:
yr(m) =s(m)∗hs(m) +n(m)∗hn(m) (1)
whereyr(m)denotes the reverberant noisy speech mixture at discrete timem, ‘∗’ denotes the convolution operator,s(m)
andn(m)represent the speech source signal and noise at time
m, respectively, andhs(m)andhn(m)are impulse responses of speech signal and noise, respectively. Besides, the noise can be background noise or speech interference signal. The spectra of reverberant noisy speech mixture is obtained by using short-time Fourier Transform (STFT).
whereHs(t, f)shows the impulse response of clean speech signal, andHn(t, f) denotes the impulse response of noise both in the time frequency domain. N(t, f)andS(t, f)are the spectra of noise and clean speech signal, respectively. The dereverberated speech mixture can be represented as:
Y(t, f) =S(t, f) +N(t, f) (3) According to(2)and(3), we can rewrite the reverberant noisy speech mixture as:
Yr(t, f) =Y(t, f) Hs(t, f) 1 +N(t, f) S(t, f) + Hn(t, f) 1 + S(t, f) N(t, f) (4) 2.2. Training Targets
According to (4), the DM is expressed as [12]:
DM(t, f) = Hs(t, f) 1 + N(t, f) S(t, f) + Hn(t, f) 1 + S(t, f) N(t, f) −1 (5)
By using theDM(t, f), the reflections in reverberant mix-ture are removed, the dereverberated speech mixmix-ture can be estimated as:
ˆ
Y(t, f) =Yr(t, f)·DM(t, f) (6)
The IRM is calculated as [9]:
IRM(t, f) = |S(t, f)|
2 |S(t, f)|2+|N(t, f)|2
!η
(7)
where|S(t, f)|2is the clean speech signal energy, and|N(t, f)|2 is the noise energy, andηis a tunable parameter to control the sparsity of mask, typically set to 0.5. According to(6)and
(7), the desired speech signal can be estimated as:
ˆ
S(t, f) = ˆY(t, f)·IRM(t, f)
=Yr(t, f)·DM(t, f)·IRM(t, f)
(8)
Since the DM ranges from0to+∞, which is not consistent with the IRM, the compression is applied to map the value of DM to(0, V][12]. The compressed DM is written as:
DMc(t, f) =V
1−eC·DM(t,f)
1 +eC·DM(t,f) (9)
whereCis the steepness constraint, andV is a scaling param-eter. At the test stage, the DM is decompressed to its original value: ˆ DM(t, f) =−1 Clog V −DMc(t, f) V +DMc(t, f) (10) 2.3. LSTM
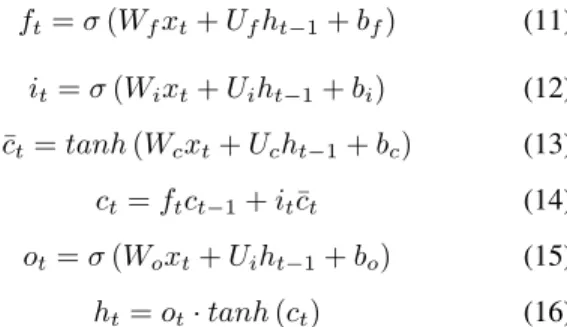
An LSTM block is shown in Fig. 1. The expressions of each gate and state in an LSTM block are:
ft=σ(Wfxt+Ufht−1+bf) (11) it=σ(Wixt+Uiht−1+bi) (12) ¯ ct=tanh(Wcxt+Ucht−1+bc) (13) ct=ftct−1+it¯ct (14) ot=σ(Woxt+Uiht−1+bo) (15) ht=ot·tanh(ct) (16) whereftanditdenote the states of forget gate and input gate, respectively. ¯ctis the block input, andotrepresents the state of output gate. There are three inputsht−1,xt,ct−1and two outputsht,ct. TheW’s,U’s denote weights,b’s represents biases.σandtanhrepresent the sigmod function and hyper-bolic tangent function.
Fig. 1:The block diagram of the LSTM block
Since the LSTMs can preserve the temporal information. The mask predicted by the LSTM exploits not only the infor-mation from the current frame but also the inforinfor-mation from previous frames. Therefore, we introduce the LSTM structure for the monaural speech enhancement problem.
2.4. System Architecture
The block diagram of proposed system is shown in Fig. 2. At the training stage, the two training targets DM and IRM are calculated by using the speech signal, noise and reverber-ant noisy speech mixture. The feature combination of train-ing data is extracted from the reverberant mixture, which is described in Section 3. Feature combination and DM are ap-plied to train the LSTM 1. Besides, the LSTM 2 is trained by feature combination and IRM. The relationship between the training targets and feature combination are learnt by two LSTMs. For the testing stage, the feature combination from testing data is also extracted, then input to the two trained
Targets Calculation Compression Module Reverberant Mixture Speech Source Noise DM IRM Training LSTM 2 Feature Extraction Training Stage Testing Stage Training LSTM 1 Testing Stage Estimated Speech Recovery Module Reverberant Mixture Trained LSTM 2 Feature Extraction Trained LSTM 1 Enhancement Module DM IRM Targets Calculation Compression Module Reverberant Mixture Speech Source Noise DM IRM Training LSTM 2 Feature Extraction Training Stage Training LSTM 1
Fig. 2: The block diagram of the propose two-stage speech enhancement system. Two LSTMs are trained separately. The LSTM1 is used to estimate the DM, and the LSTM2 is exploited to estimate the IRM.
LSTMs which predict the DM and IRM to be exploited in the enhancement module. Input is the reverberant noisy speech mixture to the enhancement module, the speech source is es-timated from the reverberant mixture. Besides, the compres-sion module is applied to map the range of DM. The DM is decompressed to its original value by using the recovery mod-ule.
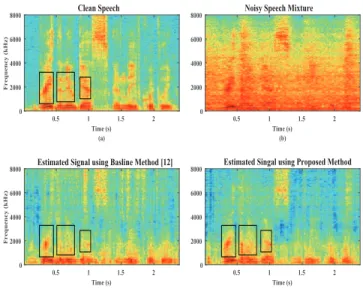
We plot a set of spectrograms in Fig. 3. It can be ob-served that both of the DNNs and the proposed LSTMs based methods can be used to recover speech signal. However, the spectrogram of LSTMs based method is more similar to the spectrogram of clean speech.
3. EXPERIMENTAL EVALUATIONS 3.1. Datasets
We use clean speech signals from the IEEE [15] and TIMIT corpora [16] to generate noisy speech mixtures. The IEEE corpus contains 720 utterances spoken by a single male speaker. The TIMIT corpus has 630 male and female speakers, ev-eryone spoken 10 utterances. To test the proposed system particularly for speaker-independent case, the training data is generated based on 150 male and female speakers from the database, and 50 unseen speakers are selected from the database in testting set. The factory and babble noises are se-lected from NOISEX database [17]. The factory noise is ap-plied to represent the industrial noise, and the babble noise is the recording of several unseen speakers’ voice, both of them are non-stationary. The clean utterances are mixed with noise signals at three signal-to-noise ratio (SNR) levels (3dB, 0dB, -3dB).
The real room impulse responses (Real RIRs) [18] are convolved with clean speech and noise to generate the
rever-Clean Speech Time (s) (a) 0.5 1 1.5 2 F r e q u e n c y (k H z ) 0 2000 4000 6000
8000 Noisy Speech Mixture
Time (s) (b) 0.5 1 1.5 2 0 2000 4000 6000 8000
Estimated Signal using Basline Method [12]
Time (s) (c) 0.5 1 1.5 2 F r e q u e n c y (k H z ) 0 2000 4000 6000 8000
Estimated Singal using Proposed Method
Time (s) (d) 0.5 1 1.5 2 0 2000 4000 6000 8000
Fig. 3:Spectrograms of different signals: (a) spectrogram of clean speech; (b) spectrogram of reverberant noisy speech mixture; (c) spectrogram of es-timated speech signal by DNNs based method [12]; (d) spectrogram of esti-mated speech signal by LSTMs based method. The reverberant noisy speech mixture is generated by factory noise at RT60s = 0.32s and 3dB SNR level. The color version is better to understand.
berant noisy speech mixtures. The real RIRs are from four types of rooms with different dimensions and RT60s. The detailed parameters are shown in Table 1. In total, 12,000 monaural mixtures are generated for training the proposed system, and the testing data includes 2,880 monaural mix-tures. The clean speech signals are unseen in the testing data.
Table 1:The parameters of Real RIRs for different rooms. Room Size Dimension (m3) RT60(s)
A Medium 5.7×6.6×2.3 0.32
B Small 4.7×4.7×2.7 0.47
C Large 23.5×18.8×4.6 0.68
D Medium 8.0×8.7×4.3 0.89
The enhancement performance is evaluated quantitatively by SDR improvement (∆SDR) [19]. The higher value means a better performance for SDR.
3.2. LSTMs Settings and Speech Features
Both LSTMs have three hidden layers, and each hidden layer has 512 units. To justify the comparison, the DNNs have the same configuration [12]. The number of epochs is 30. The LSTM is trained by using stochastic gradient descent (SGD) with momentum. The learning rate is selected as 0.001. The initial momentum is fixed to 0.5 with a change for every 5 epochs, and the final momentum is selected as 0.9. The batch size is fixed to 64.
The mel-frequency cepstral coefficient (MFCC), spectral transform and perceptual linear prediction (RASTA-PLP) and amplitude modulation spectrum (AMS) [20] are used to gen-erate the feature combination, which is used to train and test the proposed system.
3.3. Restults and Comparsions on Real RIRs
Figs. 4, 5, 6 & 7 show the∆SDR performances of the base-line [12] and the proposed methods with reverberant room environments and two background noises. Since the method in [12] has been confirmed to outperform the IRM- and cIRM-based methods in [11]. Therefore, we only use the method in [12] for state-of-the-art comparison.
-3 0 3 SNR(dB) 2 4 6 8 ∆ S D R
Room A with Factory Noise
-3 0 3 SNR(dB) 2 4 6 8
Room A with Babble Noise Proposed LSTMs DNNs [12]
Fig. 4:Averaged∆SDR of DNNs method [12] and the proposed LSTMs mentod in Room A with factory and babble noises.
Fig. 4 shows both the proposed LSTMs method and base-line DNNs method can provide the consistent∆SDR in the lowest reverberant environment Room A, which proves the proposed LSTMs method successfully remove the noise com-ponent from the noisy speech mixture. Meanwhile, the pro-posed LSTMs method generates, on average, 1.4dB improve-ment over baseline method [12].
-3 0 3 SNR(dB) 2 4 6 8 ∆ S D R
Room B with Factory Noise
-3 0 3 SNR(dB) 2 4 6 8
Room B with Babble Noise Proposed LSTMs DNNs [12]
Fig. 5:Averaged∆SDR of DNNs method [12] and the proposed LSTMs mentod in Room B with factory and babble noises.
In Room B, the proposed LSTMs method provides, on average, 0.6dB improvement. When compared Room A and Room B, for factory noise, the proposed LSTMs provides higher∆SDR in Room B. Although Room B has the higher RT60s than Room A, which proves the proposed LSTMs can efficiently address the dereverberation problem.
-3 0 3 SNR(dB) 2 4 6 8 ∆ S D R
Room C with Factory Noise
-3 0 3 SNR(dB) 2 4 6 8
Room C with Babble Noise Proposed LSTMs DNNs [12]
Fig. 6:Averaged∆SDR of DNNs method [12] and the proposed LSTMs mentod in Room C with factory and babble noises.
In Room C, the proposed LSTMs method obtains, on av-erage, 1dB improvement over the baseline DNNs method. The∆SDR of Room C is less than other reverberant rooms for both DNNs and LSTMs, because the direct-to-reverberation ratio is higher than other rooms [12]. When compared the fac-tory noise with babble noise, the proposed LSTMs method obtains a better ∆SDR with factory noise, because babble noise is human based noise, when it is mixed with the speech signal, it increases the complexity in speech enhancement.
-3 0 3 SNR(dB) 2 4 6 8 ∆ S D R
Room D with Factory Noise
-3 0 3 SNR(dB) 2 4 6 8
Room D with Babble Noise Proposed LSTMs DNNs [12]
Fig. 7:Averaged∆SDR of DNNs method [12] and the proposed two-stage LSTMs mentod in Room D with factory and babble noises.
In Room D, the proposed LSTMs method generates, on average, 1.5 dB improvement over the baseline DNNs method. The proposed LSTMs method outperforms baseline DNNs methods for all real RIRs and noise cases.
In summary, the proposed two-stage LSTMs method ob-tains, on average, 1.1dB improvement over the baseline two-stage DNNs. The LSTMs can use temporal information to estimate the training targets. Therefore, estimated masks are more accurate, which increase the generalization ability of the system. Moreover, in the high reverberant room environment, the LSTMs provide significant enhancement performance im-provements over the DNNs, which again confirm the temporal information is important for the estimation of the DM.
4. CONCLUSIONS AND FUTURE WORK
We exploited LSTMs to solve the monaural speech enhance-ment problem with the speaker-independent case in real re-verberant room environments. Two T-F masks were trained separately in the LSTM models to solve the dereverberation and speech enhancement tasks. The proposed method was evaluated with speaker-independent signals and real RIRs to confirm its generalization ability. The experimental results prove the proposed LSTMs method outperforms state-of-the-art DNNs method.
In this study, the DM and IRM are estimated using the parallel LSTMs. For future research, the sequential LSTMs will be taken into account, which may further improve the robustness of the system.
5. REFERENCES
[1] S. M. Naqvi, M. Yu, and J. A. Chambers, “A multimodal approach to blind source separation of moving sources,” IEEE Journal of Selected Topics in Signal Processing, vol. 4, pp. 895–910, 2010.
[2] B. Rivet, W. Wang, S. M. Naqvi, and J. A. Chambers, “Audiovisual speech source separation: An overview of key methodologies,”IEEE Signal Processing Magazine, vol. 19, no. 7, pp. 2125 – 2136, 2011.
[3] Y. Liang, J. Harris, S. M. Naqvi, G. Chen, and J. A. Chambers, “Independent vector analysis with a gener-alized multivariate Gaussian source prior for frequency domain blind source separation,”Signal Processing, vol. 105, pp. 175–184, 2014.
[4] Y. Liang, G. Chen, S. M. Naqvi, and J. A. Chambers, “Independent vector analysis with multivariate student’s t-distribution source prior for speech separation,” Elec-tronics Letters, vol. 49, no. 16, pp. 1035–1036, 2013. [5] Y. Sun, Y. Xian, P. Feng, J. A. Chambers, and S. M.
Naqvi, “Estimation of the number of sources in mea-sured speech mixtures with collapsed Gibbs sampling,” Sensor Signal Processing for Defence (SSPD), 2017. [6] M. S. Salman, S. M. Naqvi, A. Rehman, W. Wang, and
J. A. Chambers, “Video-aided model-based source sepa-ration in real reverberant rooms,”IEEE Transactions on Audio, Speech, and Language Processing, vol. 21, no. 9, pp. 1900–1912, 2013.
[7] Z. Y. Zohny, S. M. Naqvi, and J. A. Chambers, “En-hancing MESSL algorithm with robust clustering based on student’s t-distribution,”Electronics Letters, vol. 50, pp. 552–554, 2014.
[8] Y. Jiang, D. L. Wang, R. Liu, and Z. Feng, “Binaural classification for reverberant speech segregation using deep neural networks,”IEEE/ACM Transactions on Au-dio, Speech, and Language Processing, vol. 22, no. 12, pp. 2112–2121, 2014.
[9] A. Narayanan and D. L. Wang, “Ideal ratio mask estima-tion using deep neural network for robust speech sep-aration,” IEEE International Conference on Acoustics, Speech and Signal Processing (ICASSP), 2013.
[10] P. S. Huang, M. Kim, M. H. Johnson, and P. Smaragdis, “Joint optimization of masks and deep recurrent neural networks for monaural source separation,” IEEE/ACM Transactions on Audio, Speech, and Language Process-ing, vol. 23, no. 12, pp. 2136–2147, 2015.
[11] D. S. Williamson, Y. X. Wang, and D. L. Wang, “Com-plex ratio masking for monaural speech separation,”
IEEE/ACM Transactions on Audio, Speech, and Lan-guage Processing, vol. 24, no. 17, pp. 483–492, 2016. [12] Y. Sun, W. Wang, J. A. Chambers, and S. M. Naqvi,
“Two-stage monaural source separation in reverber-ant room environments using deep neural networks,” IEEE/ACM Transactions on Audio, Speech and Lan-guage Processing, vol. 27, no. 1, pp. 125–139, 2019. [13] J. Chen and D. L. Wang, “Long short-term memory for
speaker generalization in supervised speech separation,” The Journal of the Acoustical Society of America, vol. 141, no. 6, pp. 4705–4714, 2017.
[14] H. Palangi, L. Deng, Y. Shen, J. Gao, X. He, J. Chen, X. Song, and R. Ward, “Deep sentence embedding us-ing long short-term memory networks: Analysis and application to information retrieval,”IEEE/ACM Trans-actions on Audio, Speech and Language Processing, vol. 24, no. 4, pp. 694–707, 2016.
[15] “IEEE recommended practice for speech quality mea-surements,”IEEE Transaction on Audio Electroacoust, no. 17, pp. 225–246, 1969.
[16] J. S. Garofolo, L. F. Lamel, W. M. Fisher, J. G. Fiscus, D. S. Pallett, and N. L. Dahlgren, “Darpa timit acoustic phonetic continuous speech corpus cdrom,” 1993. [17] A. Varga and H. Steeneken, “Assessment for automatic
speech recognition: II. NOISEX-92: A database and an experiment to study the effect of additive noise on speech recognition systems,” Speech Commun, no. 12, pp. 247–251, 1993.
[18] B. Shinn-Cunningham, N. Kopco, and T. Martin, “Lo-calizing nearby sound sources in a classroom: Binaural room impulse responses,”Journal of the Acoustical So-ciety of America, vol. 117, pp. 3100–3115, 2005. [19] E. Vincent, R. Gribonval, and C. Fevotte, “Performance
measurement in blind audio source separation,” IEEE Transanctions on Audio Speech and Language Process-ing, vol. 14, no. 4, pp. 1462–1469, 2006.
[20] Y. X. Wang, A. Narayanan, and D. L. Wang, “On training targets for supervised speech separation,” IEEE/ACM Transactions on Audio, Speech, and Lan-guage Processing, vol. 22, no. 12, pp. 1849–1858, 2014.
![Fig. 5: Averaged ∆SDR of DNNs method [12] and the proposed LSTMs mentod in Room B with factory and babble noises.](https://thumb-us.123doks.com/thumbv2/123dok_us/10209765.2924056/4.918.91.444.586.737/averaged-method-proposed-lstms-mentod-factory-babble-noises.webp)
