Study on the Competitiveness of the Electrical
and Electronic Engineering Industry
Final Report
Client: DG Enterprise and Industry
Munich, 18 December 2013
Study on the Competitiveness of
the Electrical and Electronic
Engineering Industry
Within the Framework Contract for Industrial Competitiveness and Market
Performance – ENTR/90/PP/2011/FC
Study on the Competitiveness
of the Electrical and Electronic
Engineering Industry
Final Report
Client: DG Enterprise and Industry
Compiled by the following partners of the ECSIP consortium:
• Ifo Institute (Project lead) • Cambridge Econometrics • Danish Technological Institute • Decision
• IDEA Consult
About ECSIP
The European Competitiveness and Sustainable Industrial Policy Consortium, ECSIP Consortium for short, is the name chosen by the team of partners, subcontractors and individual experts that have agreed to work as one team for the purpose of the Framework Contract on ‘Industrial Competitiveness and Market Performance’. The Consortium is composed of Ecorys Netherlands (lead partner), Cambridge Econometrics, CASE, CSIL, Danish Technological Institute, Decision, ECIS, Euromonitor, Fratini Vergano, Frost & Sullivan, IDEA Consult, IFO Institute, MCI, and wiiw, together with a group of 28 highly skilled and specialised individuals.
ECSIP Consortium
p/a ECORYS Nederland BV Watermanweg 44 3067 GG Rotterdam P.O. Box 4175 3006 AD Rotterdam The Netherlands T. +31 (0)10 453 88 00 F. +31 (0)10 453 87 55 Email [email protected]
Table of contents
Section I: Report 15
1 Introduction 16
1.1 Study context and objectives 16
1.2 Structure of the report 17
2 Description of the EU electrical and electronic engineering industry 21
2.1 The EU electrical engineering sector 25
2.1.1 Electrical motors, generators and transformers 31
2.1.2 Electrical distribution and control apparatus 39
2.1.3 Instruments and appliances for measuring, testing and navigation 43
2.1.4 Accumulators and batteries 47
2.1.5 Insulated wires and cables 54
2.1.6 Lighting equipment and electric lamps 62
2.1.7 Electric domestic appliances 70
2.1.8 Electrical equipment for engines and vehicles 74
2.1.9 Installation of industrial machinery and equipment 79
2.2 The electronic engineering industry 85
2.2.1 Computers and peripheral equipment 90
2.2.2 Communication equipment 101
2.2.3 Consumer electronics 111
2.2.4 Medical engineering 120
2.3 The electronic component and semiconductor sector (EE3) 126 2.3.1 Electronic components (NACE 26.11): Semiconductors 129 2.3.2 Manufacture of loaded electronic boards (NACE 26.12) 142 2.4 Smart grids an example for a cross-sectoral technology 147
3 Major important competing economies in the market for electrical and electronic engineering
products 153
3.1 The United States 153
3.2 Japan 159 3.3 South Korea 165 3.4 Taiwan 171 3.5 China 176 3.6 India 182 3.7 Brazil 188
4 The competitiveness of the EU electrical and electronic engineering industry 195
4.1 Performance and price competitiveness 195
4.1.1 Comparative price performance 195
4.1.2 Performance and international price competitiveness of the EU EEI 200
4.1.3 Conclusion 205
4.2 Performance in international trade 206
4.2.1 The EU EEI’s regional trade performance 209
4.2.2 Perspectives for the Russian Federation and other Eastern economies 213 4.2.3 Perspectives for the Middle East and North African markets (MENA) 215
4.3 Technological competition 218
4.3.1 Patent analyses 218
4.3.2 Technology areas 227
4.4 Labour force and skills 230
4.4.1 The demand side: Current and future employment in the sector 231 4.4.2 The supply side: Labour force with relevant qualifications 238
4.5 International financial performance of EU-27 244
4.5.1 Sample selection 244
4.5.2 Electrical engineering (EE1) 244
4.5.3 Electronic engineering (EE2) 250
4.5.4 Electronic components and semiconductors (EE3) 255
4.5.5 The EEI industry: conclusions. 260
4.6 Structural change and geographic cohesion 260
4.7 Overall assessment of the electrical and electronic engineering industry 265
5 Impact of regulatory and other framework conditions on the electrical and electronic
engineering industry 273
5.1 Openness of international markets 273
5.1.1 Overview 273 5.1.2 United States 276 5.1.3 Japan 277 5.1.4 South Korea 278 5.1.5 China 279 5.1.6 India 281
5.1.7 Russian Federation and other East European economies 282
5.1.8 Middle East and North African economies 282
5.1.9 Central and South America 283
5.2 Public policies 284
5.2.1 Industrial policies with focus on SMEs 284
5.2.2 R&D and innovation policies 285
5.3 The regulatory system of the Single Market 292
5.3.1 New Approach and New Legislative Framework 292
5.3.2 Environmental policies 294
5.3.3 Assessment of the legal framework set by environmental regulation 295
5.3.4 “Market surveillance 297
5.4 European energy policy 298
5.4.1 Integration of renewable energies into competitive markets 300 5.4.2 Trans-European Networks – Energy (TEN-E) and demand-sided measures301
5.4.3 Smart cities and communities 302
6 Perspectives for the EEI and recommendations 305
6.1 Impact of the global economic environment on EEI’s perspectives 305 6.2 Assessment of the framework, policies and recommendations 307
6.2.1 Supply side economics 308
6.2.2 Demand side economics for EEI 312
7 Section II Annexes 315
Annex I.1 List of abbreviations 317
Annex II.1 Firm level analyses: Technical notes 341
Annex II.2 Firm level analyses: sample characteristics 344
Annex II.3 Firm level analyses: Representativeness 349
Annex II.4 EU-27 firm level analyses: EEI industry data 351
Annex II.5 Competing countries firm level analyses: EEI industry data 355
Tables
Table 2.1: Structure of the EU electrical and electronic engineering ... 21
Table 2.2: Key figures for the EU electrical and electronic engineering ... 23
Table 2.3: Changes in the regional distribution of employment within the EU-27 ... 25
Table 2.4: Key indicators for the EU electrical engineering sector (EE1) ... 28
Table 2.5: Regional distribution and changes of employment for EE1 and sub-sectors (1998 to 2008) ... 29
Table 2.6: Trade indicators “Electrical Engineering” ... 30
Table 2.7: Key indicators “Manufacture of electric motors, generators etc.” ... 37
Table 2.8: Foreign trade indicators “Manufacture of electric motors, generators etc.” 39 Table 2.9: Key indicators “Manufacture of electricity distribution etc.” ... 42
Table 2.10: Foreign trade indicators “Manufacture of electricity distribution etc.” ... 43
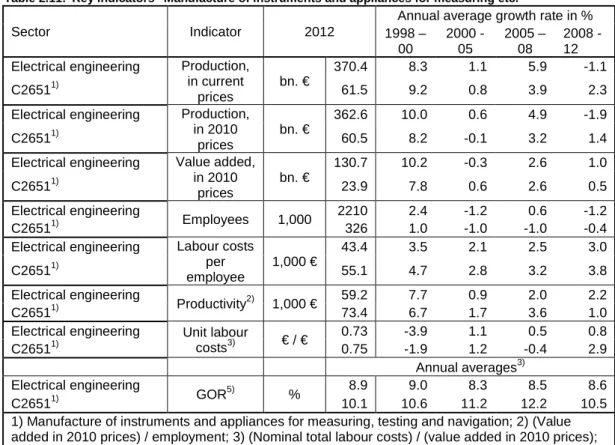
Table 2.11: Key indicators “Manufacture of instruments and appliances for measuring etc.” ... 46
Table 2.12: Trade indicators “Manufacture of instruments and appliances for measuring etc.” ... 47
Table 2.13: Key indicators “Manufacture of batteries and accumulators”... 53
Table 2.14: Trade indicators “Manufacture of batteries and accumulators” ... 54
Table 2.15: Key indicators “Manufacture of fibre optic cables” ... 58
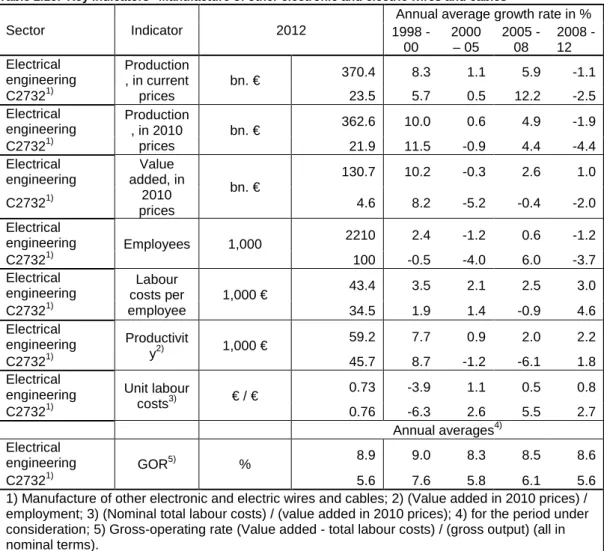
Table 2.16: Key indicators “Manufacture of other electronic and electric wires and cables” ... 59
Table 2.17: Regional distribution of employment for wires and cables ... 60
Table 2.18: Trade indicators “Manufacture of other electronic and electric wires and cables” ... 61
Table 2.19: Trade indicators “Manufacture of fibre optic cables” ... 62
Table 2.20: Leading players in the global LED market 2011 ... 66
Table 2.21: Key indicators “Lighting equipment and electric lamps” ... 69
Table 2.22: Trade indicators “Lighting equipment and electric lamps” ... 70
Table 2.23: Key indicators “Manufacture of domestic appliances” ... 73
Table 2.24: Regional distribution of employment for sub-sector “Domestic appliances” ... 73
Table 2.25: Trade indicators “Domestic appliances” ... 74
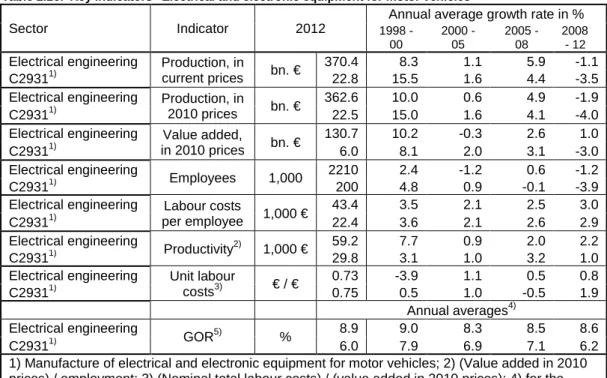
Table 2.26: Key indicators “Electrical and electronic equipment for motor vehicles” .... 77
Table 2.27: Regional distribution of employment “Electrical and electronic equipment for motor vehicles” ... 78
Table 2.28: Trade indicators “Electrical and electronic equipment for motor vehicles” . 79 Table 2.29: Key indicators “Installation of industrial machinery and equipment” ... 85
Table 2.30: Regional distribution of employment “Installation of industrial machinery and equipment”... 85
Table 2.31: Global ICT equipment market from 2010 to 2015 in value (million euros) ... 87
Table 2.32: Key indicators for the EU electronic engineering sector (EE2) ... 88
Table 2.33: Regional distribution of employment for “Electronic engineering” ... 89
Table 2.34: Trade indicators for “Electronic Engineering” ... 90
Table 2.35: Production of computers and peripheral products, 2011 (€ billion) ... 91
Table 2.36: Tablet market (E-readers excluded): EU-27 market share 2010 and 2015 ... 92
Table 2.37: PC market shares by units 2005 and 2012 (without tablets) ... 96
Table 2.39: Key indicators “Manufacture of computers etc.”... 99
Table 2.40: Regional distribution of employment for “Computers and peripheral equipment” ... 99
Table 2.41: Trade indicators for “Computers and peripheral equipment” ... 100
Table 2.42: Production of communication products, world and regional, 2011 (€ billion) ... 101
Table 2.43: Number of fixed telephone and fixed broadband subscriptions (million units) ... 103
Table 2.44: Ranking of Telecom Infrastructure Equipment Suppliers (sales in billion euros) ... 105
Table 2.45: Top mobile phone manufacturers 1) ... 106
Table 2.46: R&D-investing Telecom Equipment companies: 2011 R&D expenditures .. 109
Table 2.47: Key indicators for sub-sector “Manufacture of communication equipment” ... 110
Table 2.48: Trade indicators for “Manufacture of communication equipment” ... 111
Table 2.49: Production of consumer electronics products, world and regional 2011 (€ billion) ... 111
Table 2.50: Top LCD TV manufacturers (global shipments in million units)... 118
Table 2.51: Key indicators for sub-sector “Manufacture of consumer electronics” ... 119
Table 2.52: Trade indicators for “Manufacture of consumer electronics” ... 120
Table 2.53: Production of medical engineering products, world and regional 2011 (€ billion) ... 121
Table 2.54: Health expenditures as a percentage of GDP... 121
Table 2.55: Public and private health expenditures % in 2010 ... 122
Table 2.56: Key indicators for sub-sector “Manufacture of irradiation, electromedical and electrotherapeutic equipment” ... 124
Table 2.57: Trade indicators for “Manufacture of irradiation, electromedical and eletrotherapeutic equipment” ... 125
Table 2.58: Key indicators for the EU electrical and electronic components sector (EE3) ... 128
Table 2.59: Trade indicators for “Electronic components and electronic loaded boards (EE3)” ... 129
Table 2.60: SC manufacturers ranking by revenue ... 135
Table 2.61: Worldwide semiconductors market split by end-user segment (%) ... 140
Table 2.62: Key indicators for sub-sector “Manufacture of electronic components” .... 141
Table 2.63: Trade indicators for “Manufacture of electronic components” ... 142
Table 2.64: Top 20 EMS / ODM companies (sales in € million) ... 145
Table 2.65: Key indicators for sub-sector “Manufacture of loaded electronic boards” . 146 Table 2.66: Trade indicators for “Manufacture of loaded electronic boards” ... 147
Table 3.1: Key figures for the EU and US EEI ... 153
Table 3.2: Comparative economic performance of the EU and US EEI ... 155
Table 3.3: Sectoral performance of the EU and US EEI ... 157
Table 3.4: Key figures for the EU and Japanese EEI ... 160
Table 3.5: Comparative economic performance of the EU and Japan’s EEI ... 161
Table 3.6: Sectoral performance of the EU and Japan’s EEI ... 163
Table 3.7: Key figures for the South Korean and EU EEI ... 166
Table 3.8: Comparative economic performance of the EU and South Korean’s EEI .... 167
Table 3.9: Sectoral performance of the EU and South Korean EEI ... 168
Table 3.10: Key figures for the Taiwanese and EU EEI ... 172
Table 3.11: Comparative economic performance of the EU and Taiwanese EEI ... 173
Table 3.13: Key figures for the Chinese and EU EEI ... 177
Table 3.14: Comparative economic performance of the Chinese and EU EEI ... 178
Table 3.15: Sectoral performance of the Chinese and EU EEI ... 180
Table 3.16: Key figures for the EU and Indian EEI ... 183
Table 3.17: Comparative economic performance of the EU and Indian EEI ... 184
Table 3.18: Sectoral performance of the EU and Indian EEI ... 186
Table 3.19: Key figures for the EU and Brazilian EEI ... 189
Table 3.20: Comparative economic performance of the EU and Brazilian EEI ... 190
Table 3.21: Sectoral performance of the EU and Brazilian EEI ... 192
Table 4.1: Assessment of EEI’s comparative performance with major competing economies ... 196
Table 4.2: Assessment of EE1’s comparative performance with major competing economies ... 198
Table 4.3: Assessment of EE2’s comparative performance with major competing economies ... 199
Table 4.4: Assessment of EE3’s comparative performance with major competing economies ... 200
Table 4.5: Assessment of the EU EE1’s performance and international price competitiveness ... 202
Table 4.6: Sub-sectoral structure of EE2’s... 202
Table 4.7: Assessment of the EU EE2’s performance and international price competitiveness ... 203
Table 4.8: Assessment of the EU EE3’s performance and international price competitiveness ... 205
Table 4.9: EEI and its sectors in global exports ... 207
Table 4.10: EE1 and its major competing economies in international trade ... 208
Table 4.11: EE2 and its major competing economies in international trade ... 209
Table 4.12: EE3 and its major competing economies in international trade ... 209
Table 4.13: EU EE1 trade with competing economies and selected sales markets ... 211
Table 4.14: EU EE2 trade with competing economies and selected sales markets ... 212
Table 4.15: EU EE3 trade with competing economies and selected sales markets ... 213
Table 4.16: Forecasted power generation and available capacities of Arab countries .. 217
Table 4.17: Average share of each sector in the total number of patent applications at EPO by the competing countries 1) and EU-27 between 1990-2009 ... 221
Table 4.18: Average share of each sector in the total number of patent applications at EPO by the competing countries 1) and EU-27 between 1990-2009 ... 221
Table 4.19: Average percentage shares of patent applications in the total number of patent applications at the EPO, per sector in percent ... 226
Table 4.20: Average percentage shares of patents relative to the total number of patents granted at the USPTO, per sector ... 226
Table 4.21: Electrical Engineering & Instruments. Numbers employed (1000s) and anticipated change in numbers employed, 2010-2020 (%), all education levels. ... 236
Table 4.22: Electronics. Numbers employed (1000s) and anticipated change in numbers employed, 2010-2020 (%), all education levels. Source: EU Skills Panorama ... 237
Table 4.23: Reasons given by manufacturing enterprises for not training staff, 2005. Ranked according to frequency. ... 242
Table 4.24: Overview table Electrical Engineering (EE1) (a) (b) (c) (d) ... 249
Table 4.26: Overview table Electronic components and semiconductors (EE3) (a) (b) (c) (d)
... 259
Table 4.27: Evolution of labour costs in northern and southern economies of EU-27 .. 262
Table 4.28: Labour productivity of EU-27’s northern and southern economies ... 263
Table 4.29: Elasticity of labour productivity over labour costs per employee ... 264
Table 5.1: International standardisation organisations of relevance for EEI ... 275
Table 6.1: Key figures for the global development up to 2020 ... 305
Table 6.2: The perspectives for EEI driven by domestic and by third countries demand ... 307
Table 7.1: Profitability and financial indicators for firm-level data in Amadeus ... 342
Table 7.2: Sample structure of the micro-level analyses ... 343
Table 7.3: Overview of data coverage in the Amadeus database in the Electrical Engineering sector ... 349
Table 7.4: Overview of data coverage in the Amadeus database in the Electronic Engineering sector ... 350
Table 7.5: Overview of data coverage in the Amadeus database in the Electronic components & semiconductor sector ... 350
Table 7.6: The micro-economic performance of EEI industry (a) (b) ... 354
Figures
Figure 2.1: PC Sales in Million Units (1996 - 2015) ... 93
Figure 2.2: PC sales breakdown by region in value (%) ... 94
Figure 2.3: Value chain of the PC manufacturing industry ... 94
Figure 2.4: PC production breakdown in value by region, 2002 and 2012 ... 96
Figure 2.5: Global mobile-cellular subscriptions evolution ... 102
Figure 2.6: Network and Telecoms Infrastructure world ... 102
Figure 2.7: Mobile-cellular subscription trend 2001 - 2011 ... 104
Figure 2.8: Value chain of the mobile phone manufacturing industry ... 108
Figure 2.9: World TV set market (million units) ... 115
Figure 2.10: Typical electronic board packaging ... 126
Figure 2.11: Economic leverage of the semiconductor sector ... 130
Figure 2.12: Electronics equipment breakdown by region 2002 and 2011 ... 131
Figure 2.13: Semiconductor sales by region ... 131
Figure 2.14: Electronic equipment production breakdown in Europe by application 2002 and 2011 in value ... 132
Figure 2.15: Semiconductor supply chain ... 133
Figure 2.16: European share of SC sales and production ... 134
Figure 2.17: “Top 3” European SC manufacturers’ worldwide market share ... 137
Figure 2.18: Range of services offered by the EMS/ODM industry ... 143
Figure 2.19: EMS/ODM world market by segment (2010) ... 144
Figure 4.1: Evolution of the total number of patent applications at EPO in competing countries 1) and EU-27 in the 3 EEI sectors ... 220
Figure 4.2: Evolution of the total number of patents granted at USPTO in competing countries 1) and EU-27 in the 3 EEI sectors ... 222
Figure 4.3: EEI industry: Evolution of the share of patent applications in the total number of patent applications at the EPO 1) ... 223
Figure 4.4: EEI industry: Evolution of the share of patents granted in the total number of patents granted at the USPTO (for competing countries and EU-27) ... 223
Figure 4.5: Gross Output and Gross Value Added EE1, EE2 and EE3 in EU27 and US; Total number of EU-27 patent applications (a) ... 225
Figure 4.6: Share of total European employment in Electrical and Electronic Engineering, 2011 ... 231
Figure 4.7: Employment in Electrical and Electronic Engineering as a share of total employment in EU Member States and candidate countries, 2011 ... 232
Figure 4.8: Total employment in Electrical and Electronic Engineering in EU27, thousands ... 232
Figure 4.9: Employment trends in Electrical and Electronic Engineering and total manufacturing, EU27 2005 =100 ... 233
Figure 4.10: Average annual employment growth in Manufacture of Computers, electronic and optical products in EU and accession countries ... 234
Figure 4.11: Average annual employment growth in Manufacture of Electrical equipment in EU and accession countries ... 235
Figure 4.12: The development in the total number of graduates in relevant fields in 21 EU Member States and candidate countries by field of study 2000-2010 1) ... 240
Figure 4.13: The development in the total number of engineering graduates in three competing countries in the six relevant fields of study, 2000-2010. Index, 2000=100 ... 240
Figure 4.14: Percentage of all enterprises providing continuing vocational training, 2005
... 241 Figure 4.15: Forms of training in EEI enterprises, 2005 1) ... 242
Figure 4.16: Individuals participating in job-related training in STEM subjects, % of
respondents in Labour force survey. Ranked by participation in courses in science, mathematics and computing. ... 243
Figure 4.17: Average return on shareholders’ funds (in %) in EE1 in the EU-27 and
competing countries ... 245
Figure 4.18: Average EBIT margin (in %) in EE1 in the EU-27 and in competing countries
... 245
Figure 4.19: Average profit margin(in %) in EE1 in the EU-27 and in competing countries
... 246
Figure 4.20: Average current ratioin EE1 in the EU-27 and in competing countries ... 247
Figure 4.21: Average solvency ratio(in %) in EE1 in the EU-27 and in competing countries
... 247
Figure 4.22: Average gearing ratio(in %) in EE1 in the EU-27 and in competing countries
... 248
Figure 4.23: Average return on shareholders’ funds(in %) in the EE2 in the EU-27 and in
competing countries ... 250
Figure 4.24: Average EBIT margin (in %) in EE2 in the EU-27 and in competing countries
... 251
Figure 4.25: Average profit margin(in %) in EE2 in the EU-27 and in competing countries
... 251
Figure 4.26: Average current ratioin the electronic engineering sector in the EU-27 and in
competing countries ... 252
Figure 4.27: Average solvency ratio(in %) in the electronic engineering sector in the
EU-27 and in competing countries ... 252
Figure 4.28: Gearing ratio(in %) in the electronic engineering sector in the EU-27 and in
competing countries ... 253
Figure 4.29: Average return on shareholders’ funds (in %) in EE3 in the EU-27 and in
competing countries ... 255
Figure 4.30: Average EBIT margin(in %) in EE3 in the EU-27 and in competing countries
... 256
Figure 4.31: Average profit margin(in %) in EE3 in the EU-27 and in competing countries
... 256
Figure 4.32: Average current ratioin EE3 in the EU-27 and in competing countries ... 257
Figure 4.33: Average solvency ratio(in %) in the electronic components and
semiconductors sector in the EU-27 and in competing countries ... 257
Figure 4.34: Average gearing ratio(in %) in EE3 in the EU-27 and in competing countries
... 257
Figure 4.35: Evolution of employment in northern and southern economies of EU-27 .. 261
Figure 4.36: Evolution of labour costs in northern and southern economies of EU-27 .. 262
Figure 4.37: Evolution of labour productivity of northern and southern economies of
EU-27 ... 263
Figure 4.38: Changes in ULC of northern and southern economies of EU-27 ... 265
Figure 5.1: Trends in energy price indexes, 2005–2012 ... 301
Figure 6.1: The destination of the EU-27 total manufacturing industries’ and EEI’s
Figure 7.1: Sectoral distribution of the number of companies in the EU-27electrical
engineering sector ... 344
Figure 7.2: Distribution of companies in the EU-27 electrical engineering sector according to the number of employees (in 2010) in terms of number of companies ... 345
Figure 7.3: Distribution of companies in the EU-27 electrical engineering sector according to turnover (in 2010) in terms of total turnover ... 345
Figure 7.4: Sectoral distribution of the number of companies in the EU-27electronic engineering sector ... 346
Figure 7.5: Distribution of companies in the EU-27 electronic engineering sector according to the number of employees (in 2010) in terms of number of companies ... 346
Figure 7.6: Distribution of companies in the EU-27 electronic engineering sector according to turnover (in 2010) in terms of total turnover ... 347
Figure 7.7: Sectoral distribution of the number of companies in the EU-27electronic components and semiconductor sector ... 347
Figure 7.8: Distribution of companies in the EU-27 electronic components and semiconductor sector according to the number of employees (in 2010) in terms of number of companies... 348
Figure 7.9: Distribution of companies in the EU-27 electronic components and semiconductor sector according to turnover (in 2010) in terms of total turnover ... 348
Figure 7.10: Return on shareholders’ funds (in %) in the EU-27 EEI sector ... 351
Figure 7.11: EBIT Margin(in %) in the EU-27 EEI sector ... 351
Figure 7.12: Profit margin (in %) in the EU-27 EEI sector ... 352
Figure 7.13: Current ratio in the EU-27 EEI sector ... 352
Figure 7.14: Solvency ratio(in %) in the EU-27 EEI sector ... 353
Figure 7.15: Gearing ratio(in %) in the EU-27 EEI sector ... 353
Figure 7.16: Structure of shareholders’ funds and liabilities in the EU-27 EEI sector ... 354
Figure 7.17: Average return on shareholders’ funds (in %) in the EEI sector in the EU-27 and in competing countries ... 355
Figure 7.18: Average EBIT margin (in %) in the EEI sector in the EU-27 and in competing countries ... 355
Figure 7.19: Average profit margin(in %) in the EEI sector in the EU-27 and in competing countries ... 356
Figure 7.20: Average current ratio (in %) in the EEI sector in the EU-27 and in competing countries ... 356
Figure 7.21: Average solvency ratio (in %) in the EEI sector in the EU-27 and in competing countries ... 357
Figure 7.22: Average gearing ratio (in %) in the EEI sector in the EU-27 and in competing countries ... 357
1
Introduction
1.1 Study context and objectives
The Ifo Institute, core member of the ECSIP Consortium, lead the Study on the Competitiveness of the EU Electrical Engineering Industry. The Final Report is presented on behalf of the project team.
The Electrical Engineering Industry (EEI) is one of the most competitive European manufacturing industries. It is a strong competitor in international markets and has benefited from global growth in the past decade. The industrialisation of emerging economies has been the most important driver for expansion. In 2008 the outbreak of the global financial crisis caused a fall in demand and EEI as well as other manufacturing industries suffered a severe recession. The subsequent recovery has been fragile; the previous level of output has not been reached yet.
In recent years emerging economies’ manufacturing output has gained market share in global output, whereas the developed world has lost importance. Moreover, the European manufacturing sector remains affected by the European economic crisis. The EU-27 EEI is one of the most important manufacturing industries, a driver of innovation, provider of key-enabling technologies (KET) and largest employer within the EU. The aim of this study is the assessment of the EU’s EEI competitiveness in comparison with major competing economies: the US, Japan, China, South Korea, Taiwan, India and Brazil.
The EEI is a heterogeneous industry. Its sub-sectors show large differences in their supply-side structure, business models and market environment. In information and communication technologies fast moving technological progress has lead to strong growth in labour and capital productivity. In power generation, environmental concerns and the expected scarcity of resources are pushing the development of new technologies. As a consequence of the diversity of the EEI a detailed analysis of numerous sub-sectors is asked for by the Request for Services (RfS). In the EU-27 the EEI is located in traditionally industrialized regions and a division of labour has evolved over time. In particular, the Member States that joined the EU in 2004 and were integrated into European value chains, remain vulnerable to global competition. More generally, there exist regional strengths and weaknesses for the EU-27 EEI that are analysed in this report.
The EEI as a supplier of electrical and electronic products is strongly affected by European policies, regulations, and in particular climate change regulation with its “20-20-20” targets:
• A 20 % reduction of EU greenhouse gas emissions from 1990 levels,
• Raising the share of EU energy consumption produced from renewable resources to 20 %,
• A 20 % improvement in the EU’s energy efficiency.
As the EEI supplies products for power generation, distribution and consumption it is an important enabler for the technical change required to reach these targets. It will benefit from the replacement of energy inefficient plants machinery and equipment overtaken by technological progress and investment in new, more efficient technology.
Beyond this growth-enhancing demand EEI is affected by EU provisions on energy efficiency, resource efficiency and recyclability. These policy targets are pursued with EU legislation. In this respect the Ecodesign Directive, the Restriction of Hazardous Substances Directive (RoHS), the Registration, Evaluation, Authorisation and Restriction of Chemicals Directive (REACH) and the Waste Electrical and Electronic Equipment Directive (WEEE) are of great importance for EEI. Other provisions relevant for the EEI concern the functionality and compatibility of products, such as the Electro-Magnetic Compatibility Directive (EMC) and Radio and Telecommunications Terminal Equipment Directive (R&TTE). Legislation directed towards consumers’ health, safety and security in the workplace, as well as emissions is also relevant. The EU regulatory framework is supported by standardization work carried out by the ESOs1. This report analyses the impact of all of these policies on EEI’s performance within the Single Market and globally.
The assessment of the EU-27 EEI’s performance in the domestic and global markets has been carried out by an in-depth investigation of the evolution of price competitiveness, financial
performance, comparative advantages, performance in foreign trade, technological competitiveness and the labour market. These evaluation criteria have been applied as basis for a quantitative assessment of the EU EEI’s perspectives up to 2020, differentiated by domestic demand and exports to third countries.
1.2 Structure of the report
The focus of Chapter 2 is on the EU EEI. It provides a comprehensive description of the industry that consists of the electrical engineering sector (EE1), the electronic engineering sector (EE2) and the electrical and electronic components sector (EE3). All of these sectors show major differences in their structure and their products. To a large extent EE1 comprises capital goods and key components delivered to a broad range of industries, many of them dedicated to machinery and equipment and, transport equipment. The EU-27 commands a strong position in international markets for these products. The sector EE2 comprises information, communication and
telecommunication (ICT) equipment. In several markets the EU-27 commands a strong position in international competition, in particular markets for medical equipment and communication infrastructure technologies. However, in consumer electronics the EU-27 is largely dependent on imports, predominantly from Asian countries. As compared to both EE1 and EE2, EE3 is small, despite being of crucial importance for technological progress. It comprises intermediary products, among them semiconductors that are key-enabling products not only for EE1 and EE2, but for a broad range of downstream industries. Hence, EE3 is a driver of innovation in downstream industries.
All of the three sectors are investigated in detail. For this purpose numerous sub-sectors are considered separately, as they differ strongly in the structure of the supply side, the pace of technological progress and innovation as well as their performance in international markets. The first part provides a description of EE1, based on a detailed analysis of its sub-sectors. The second and third parts are dedicated to EE2 and EE3 including sub-sectors. This sectoral differentiation is kept throughout the report. The assessment of the EEI’s competitiveness is carried out for the sectors, EE1, EE2 and EE3, separately and summed up in an overall evaluation. Most of Chapter 2 is dedicated to a sectoral and sub-sectoral analysis of EU EEI. The final section tackles smart grids, a cross-sectoral technology that is of outstanding importance for the EU energy policy.
1
CEN and CENELEC develop a specific program to support SMEs. URL: http://www.cencenelec.eu/sme/pages/default.aspx.
Chapter 3 is dedicated to an in-depth investigation of the relative competitiveness of the seven non-European economies. As for the EU EEI a qualitative description and a quantitative analysis of the EEI and its three sectors are carried out. The assessment of each competing economy’s EEI performance is examined by two dimensions. First, the competing economy’s domestic economic development is compared to the competing economy’s total manufacturing as a benchmark. Second, the competing economy’s EEI is compared to the EU EEI. The results provide insights into the evolution of comparative advantages or disadvantages.
Chapter 4 discusses in detail the different aspects that have been mentioned in the RfS as basis for the assessment of the EU EEI’s competitiveness. Those are
• factor prices and productivity,
• performance in international trade and important sales markets,
• state of technology and the EU’s position in global competition,
• availability and quality of input factors,
• companies’ financial performance, liquidity and solvency and
• intra-EU division of labour, competitive clusters and coherence, structural elements of crucial importance for the long-time performance of the EU EEI.
Chapter 4.1 analyses the price competitiveness and its evolution over the period under
investigation for the EU and the seven competing economies, differentiated by EE1, EE2 and EE3. Chapter 4.2 investigates the performance of the EU and its competing economies in international markets. Chapter 4.3 analyses the technological competitiveness with a focus on EU and US patent statistics. The evaluation is carried out for the EU, the US and a group of Asian economies. The analysis shows that the strength of Asia in high-tech industries has increased remarkably. Chapter 4.4 investigates the availability and quality of labour supply. It concludes that demography and qualifications will be challenges for EEI if it wants to maintain its strong technological position in international competition. Mathematics, natural sciences and engineering have lost some of their former attractiveness, which is reflected in the subjects young people are interested in.
Chapter 4.5 investigates the financial performance of the EU and the competing economies. The results have been mixed. Although EU EE1 turns out to be competitive internationally in technology and international trade, the microeconomic analysis unveils a below average profitability. However, profitability has improved over the period under investigation. In contrast, EE2’s profitability was remarkably good during the early years of the period under investigation, but it has worsened thereafter. In parallel, liquidity and solvency have deteriorated. For EE3 profitability was poor during the early years of the investigation, but has improved remarkably. Nevertheless, liquidity remains poor and long-term debt is higher than in competing economies. This poses a significant challenge for investment in future production technologies.
Chapter 4.6 investigates in the intra-EU division of labour. During the period under consideration, the employment record of the northern economies and central European economies (CEE) has been significantly better than for southern economies. The results of our investigation suggest that changes of price competitiveness had an impact on employment.
Chapter 4.7 provides an in-depth assessment of the EU EEI’s international competitiveness. The strength of the EU EEI is strongly dependent on EE1. This is reflected in its trade performance. EE1 commands a long-term trade surplus. Moreover, EU EE1 has gained share in global markets despite competition from emerging economies. For EE2 and EE3 the EU-27 the foreign trade balance is negative. The overall trade balance for EU EEI is balanced. Likewise, the technological position of the EU EEI in international competition is to a large extent dependent on EE1. The sectoral analysis of patents shows strong competition in EE2 and EE3 between Asia and the US.
Although the EU is leading globally in certain areas of technology, it is trailing behind Asia and the US in most sectors.
The EU EEI strengths are closely related to downstream industries, in particular the capital goods industries and transport equipment. The linkages are based on the delivery of intermediary products. Simultaneously, these value chains are innovation chains. Key-enabling technologies (KET) primarily supplied by EE3, are indispensable for innovation in downstream industries. The investigation in the evolution of employment has revealed that the employment effects of key-enabling technologies depend on downstream industries’ ability to innovate. Generally speaking, all of the innovation and value chain is relevant for employment. For all of the competing economies it has turned out that the employment record of EE3, the KET-sector, was worse than for EEI overall. EE3’s performance in international trade is characterized by a growing focus of EU production in domestic markets, on strong downstream industries. In parallel, imports of EE3 products have declined. This development has been caused by a loss of production capacities for large scale manufactured consumer electronics and telecommunication terminals within the EU. In contrast to the general tendency of growing international division of labour, a specialization of the EU EE3 on domestic clients has taken place with the production of more specialized and customized products as asked for by domestic clients.
Chapter 5 investigates European policies and their impact on the performance of EEI in global competition. It focuses on the most relevant policies for EEI. Market access barriers are of
importance for the EU EEI, an industry that exports roughly one third of its production. The chapter provides insight on trade barriers, in particular non-tariff barriers, for five of the seven competing economies plus three economic areas with which the EU maintains close trade relations. The EU industry – via its standardization bodies CEN, CENELEC and ETSI – is strongly involved in initiatives to develop technical standards that are internationally recognised and contribute to a reduction of non-tariff barriers.
As mentioned above EEI is a technology driven industry which is of pivotal importance for the EU to reach the EU ”20-20-20” energy targets. Hence, numerous EU R&D policies in Horizon 2020 focus on technologies applied and developed by EEI. The chapter analyses schemes on electro-mobility, semiconductors, photonics, renewables power generation, smart grids and advanced production technologies.
Chapter 5 investigates EU regulations. The legal framework set by selected EU directives is assessed as regards a coherent, less bureaucratic regulatory system so as to ease compliance for companies placing products on the Single Market. With the New Legal Framework, which came into effect in 2010, the EU strives for a more consistent regulation. This is a challenge because
simultaneously legislative initiatives are taken that will lead to new requirements. An initiative launched by the Commission is the Product Safety and Market Surveillance Package (PSMSP) that is dedicated to overcome the deficiencies of market surveillance in the Single Market and to warrant competition on eye level for economic operators.
Chapter 6 provides an outlook for the EU EEI up to 2020 based on the Ifo Institute’s latest medium-term economic outlook (as of October 2013). The EU’s macroeconomic perspectives are muted and impact EU EEI strongly. Domestic demand will stagnate over the forecasting period, whereas third country demand is the driver of growth. The foreign markets importance as measured by the export ratio will continue to increase. While it was only 26 % in the period 1998 – 2005, it increased to 31 % for 2005 – 2012, and is forecast to reach 37% for 2012 – 2020. Beyond stagnant domestic
demand an on-going increase of the international division of labour – as in the past – will contribute to this development.
Chapter 6 highlights the more important framework conditions and provides some
recommendations. They are subsumed under two categories: Supply side economics comprise:
• Public policies on R&D;
• Regulation;
• Competitive advantages based on manufacturing and research clusters;
• Access to third countries;
• Qualification and the supply of labour.
Demand side economics focus on EU climate and energy policies built upon the EU “20-20-20” Targets. They affect EEI as the supplier of products for power generation, distribution and consumption. Policies pose high requirements on resource and energy efficiency, but simultaneously incorporate the potential for growing demand.
2
Description of the EU electrical and electronic
engineering industry
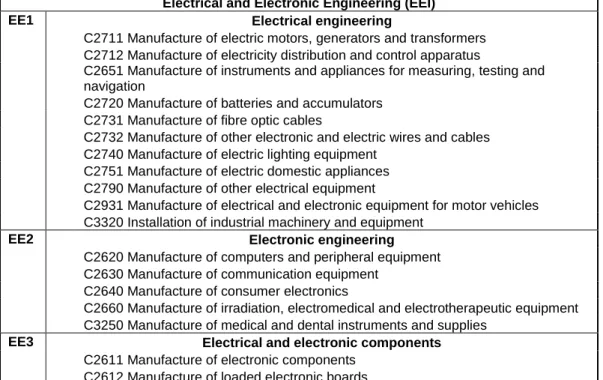
The scope of the investigation is illustrated in Table 2.1. The definition of the sub-sectors is based in NACE (Rev. 2) and the grouping into three sectors has been agreed upon during the Kick-off Meeting. This chapter contains a detailed description of the EU electrical and electronic engineering (EEI), differentiated by the sectors and sub-sectors. Most of the sub-sectors are defined by four digit NACE groups as shown below. One sub-sector “Insulated wire and cables” reported in this chapter consists of two NACE codes, C2731 and C2732. No analysis will be carried out on the following two sub-sectors: C2790 “Manufacture of other electrical equipment” is a conglomerate of quite different products and markets that does not allow meaningful analysis and assessment. C3250 “Manufacture of medical and dental instruments and supplies” is beyond the EEI and comprises a number of mechanical products without much linkages to the EEI production and value chain. This gives a total of 15 sub-sectors to be reported on in this chapter instead of the 13 requested in the RfS.
Table 2.1: Structure of the EU electrical and electronic engineering
Electrical and Electronic Engineering (EEI)
EE1 Electrical engineering
C2711 Manufacture of electric motors, generators and transformers C2712 Manufacture of electricity distribution and control apparatus
C2651 Manufacture of instruments and appliances for measuring, testing and navigation
C2720 Manufacture of batteries and accumulators C2731 Manufacture of fibre optic cables
C2732 Manufacture of other electronic and electric wires and cables C2740 Manufacture of electric lighting equipment
C2751 Manufacture of electric domestic appliances C2790 Manufacture of other electrical equipment
C2931 Manufacture of electrical and electronic equipment for motor vehicles C3320 Installation of industrial machinery and equipment
EE2 Electronic engineering
C2620 Manufacture of computers and peripheral equipment C2630 Manufacture of communication equipment
C2640 Manufacture of consumer electronics
C2660 Manufacture of irradiation, electromedical and electrotherapeutic equipment C3250 Manufacture of medical and dental instruments and supplies
EE3 Electrical and electronic components
C2611 Manufacture of electronic components C2612 Manufacture of loaded electronic boards Source: EUROSTAT; Cambridge Econometrics; Ifo Institute.
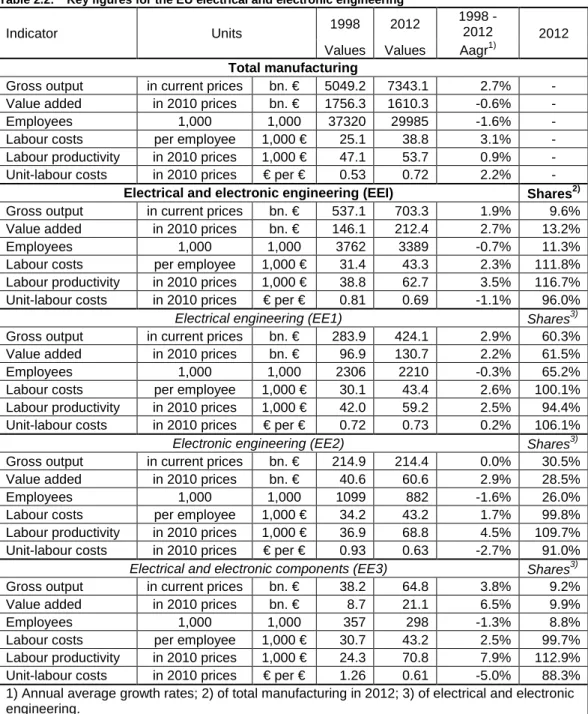
The EEI is one of the large sectors of the EU-27. In 2012 its gross output2 was € 703.3 billion. This equals a share of 9.6 % of all manufacturing industries’ gross output. In 2000, its share was 10.0 %, showing a slight but steady decline over the period under consideration. In spite of this decrease, the number of workplaces declined only at an annual average rate of 0.7 % to 3,389,000 in 2012, whereas employment in the manufacturing industry as whole declined at a rate of 1.6 % per year. (Table 2.2)
2
Gross output ~ Turnover +/- changes in inventories ~ production + sale of services and merchandise goods +/- changes in inventories.
The EEI – as measured by value added in constant prices – increased at an average annual rate of 2.7 % between 1998 and 2012. It accounted for € 212.4 billion in 2012 and had grown at a fast pace, whereas total manufacturing suffered some losses. The better development of the EEI in real terms rather than in nominal terms is explained by falling prices in the EE1 and EE2 sectors. Moreover, the increasing manufacturing depth of EEI had also contributed to a certain extent. This indicator – measured by the ratio of nominal value added divided by gross output – hovered around 30 % for the EEI over the period under consideration. In recent years it increased slightly. In contrast, for total manufacturing the depth of manufacturing declined from 28 % to only 23 %. This indicates that the value creation within the EU-27 has retained its importance in the EU EEI’s global manufacturing production networks. For all other manufacturing industries with the EU-27 as a location for production lost some of their former importance on average within the global production networks.
Labour productivity of the EEI increased much stronger than value added at an annual average rate of 3.5 % over the period under consideration. Simultaneously, labour costs per employee only increased by 2.3 % per annum and caused a decline of unit-labour costs (ULC) by 1.1 % (a noteworthy improvement of price performance). In contrast, for total manufacturing price performance had worsened. Labour costs increased at a higher pace at 3.1 % annually and exceeded labour productivity by far, which expanded by a meagre 0.9 %. As a consequence, unit-labour costs (ULC) worsened annually by 2.2 %.
The sectors of the EEI developed quite differently. EE1 accounts for around 52.9 % of the EEI’s gross output. Its pattern of growth was broadly in line with traditional industries. Product prices did not change much over the period under consideration, only increasing by an average of 0.4 % per annum. Improvement of labour productivity by 2.5 % p.a. was well above total manufacturing, but lagged behind the other sectors in the EEI. By 2012, manufacturing depth increased and
contributed to a relatively good employment record, compared to the other sectors. The number of workplaces declined only by around 0.3 % p.a.
EE2 accounts for around 40 % of the EEI’s gross output. The sector is directly driven by
technological progress in microelectronics and discloses the typical pattern of high-tech industries. Labour productivity improved by 4.5 % annually and exceeded by far price adjusted growth of value added, which increased only at an annual rate of 2.9 %. Falling prices let companies’ revenues stagnate and companies shed workforce on average by 1.6 % p.a.
EE3 contributes almost 7 % to the EEI’s gross output. This upstream industry provides intermediary products to EE1, EE2 and a broad range of different industries. It is even more affected by
technological progress than EE2. This is indicated by a technology driven improvement of
labour productivity of 7.9 % p.a. Although the growth rate of real value added reached an annual
rate of 6.5 %, it was not sufficient to prevent a reduction of staff that was lower than for EE2.
Table 2.2: Key figures for the EU electrical and electronic engineering
Indicator Units 1998 2012
1998 -
2012 2012
Values Values Aagr1)
Total manufacturing
Gross output in current prices bn. € 5049.2 7343.1 2.7% - Value added in 2010 prices bn. € 1756.3 1610.3 -0.6% -
Employees 1,000 1,000 37320 29985 -1.6% -
Labour costs per employee 1,000 € 25.1 38.8 3.1% -
Labour productivity in 2010 prices 1,000 € 47.1 53.7 0.9% - Unit-labour costs in 2010 prices € per € 0.53 0.72 2.2% -
Electrical and electronic engineering (EEI) Shares2)
Gross output in current prices bn. € 537.1 703.3 1.9% 9.6%
Value added in 2010 prices bn. € 146.1 212.4 2.7% 13.2%
Employees 1,000 1,000 3762 3389 -0.7% 11.3%
Labour costs per employee 1,000 € 31.4 43.3 2.3% 111.8%
Labour productivity in 2010 prices 1,000 € 38.8 62.7 3.5% 116.7% Unit-labour costs in 2010 prices € per € 0.81 0.69 -1.1% 96.0%
Electrical engineering (EE1) Shares3)
Gross output in current prices bn. € 283.9 424.1 2.9% 60.3%
Value added in 2010 prices bn. € 96.9 130.7 2.2% 61.5%
Employees 1,000 1,000 2306 2210 -0.3% 65.2%
Labour costs per employee 1,000 € 30.1 43.4 2.6% 100.1%
Labour productivity in 2010 prices 1,000 € 42.0 59.2 2.5% 94.4% Unit-labour costs in 2010 prices € per € 0.72 0.73 0.2% 106.1%
Electronic engineering (EE2) Shares3)
Gross output in current prices bn. € 214.9 214.4 0.0% 30.5%
Value added in 2010 prices bn. € 40.6 60.6 2.9% 28.5%
Employees 1,000 1,000 1099 882 -1.6% 26.0%
Labour costs per employee 1,000 € 34.2 43.2 1.7% 99.8%
Labour productivity in 2010 prices 1,000 € 36.9 68.8 4.5% 109.7% Unit-labour costs in 2010 prices € per € 0.93 0.63 -2.7% 91.0%
Electrical and electronic components (EE3) Shares3)
Gross output in current prices bn. € 38.2 64.8 3.8% 9.2%
Value added in 2010 prices bn. € 8.7 21.1 6.5% 9.9%
Employees 1,000 1,000 357 298 -1.3% 8.8%
Labour costs per employee 1,000 € 30.7 43.2 2.5% 99.7%
Labour productivity in 2010 prices 1,000 € 24.3 70.8 7.9% 112.9% Unit-labour costs in 2010 prices € per € 1.26 0.61 -5.0% 88.3% 1) Annual average growth rates; 2) of total manufacturing in 2012; 3) of electrical and electronic engineering.
Source: EUROSTAT; Cambridge Econometrics; Ifo Institute.
Despite a slight decline in the number of workplaces, the EEI’s share of total manufacturing increased from 10.1 % in 1998 to 11.3 % in 2012. This relatively positive development was driven above all by EE1. This sector’s contribution to EEI’s employment increased from 61.3 % to 65.2 % over the period under investigation. For EE2 and EE3, the shares declined from 29.2 % to 26.0 % and from 9.5 % to 8.8 %, respectively.
It is of crucial importance to understand that – as measured by the number of workplaces – the reduced weight of EE2 and EE3 does not indicate a loss of relevance. Technological progress drives labour productivity strongly, exceeding output growth by far. As a result, employment could be reduced. EE3 is an upstream industry and provides many key enabling technologies to client industries. It has become an important driver for innovation throughout the period under
investigation. The growing interdependencies between EE3 and downstream industries – fuelled by an accelerated pace of technological progress and the delivery of high-tech components – are
pivotal to client industries’ long-term competitiveness. The tendency of a growing interrelation between EE3 and EE2 as well as EE1 is highlighted in the following chapters.
The EU EEI’s regional concentration is measured as its employment share in total
manufacturing (TM) employment. In 2012, the EEI’s share of the total workforce in manufacturing
was 11.3 %. Member States with a strong focus on EEI are the more developed economies, Finland (16.2 %), Germany (14.6 %) and Austria (13.6 %), followed by Sweden (12.3 %) and France (12.2 %). Another group of countries with a strong focus on EEI are characterised by lower wages and beneficial framework conditions for large enterprises. Ireland is in the lead with around one quarter, followed by Hungary at one fifth of TM’s workplaces in the EEI, and then Slovakia and Slovenia. For southern EU Member States, such as Spain and Portugal, the EEI less important with lower shares of 7.0 % and 5.6 % of domestic total manufacturing, respectively. During the early phase of the period under investigation (1998), the concentration was less pronounced. At the time, the EU EEI’s share in total manufacturing employment was 10.1 %. For instance, the EEI’s share in Germany's total manufacturing employment was 12.1 %, whereas the share in Portugal and Spain was 7.6 % and 6.0 %, respectively.
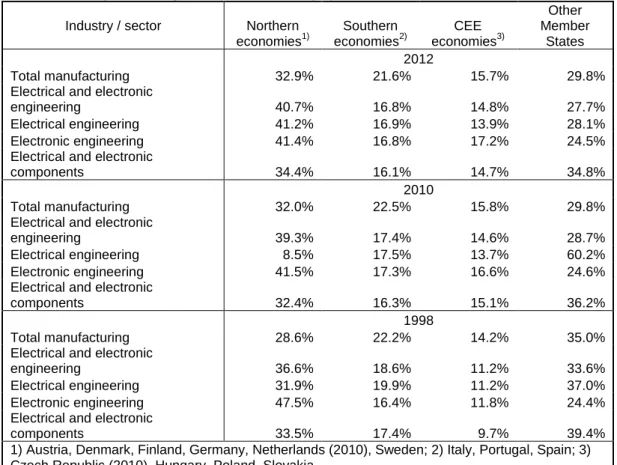
The regional shift of employment within each of the industries is highlighted by a comparison of Northern, Southern and Central Eastern European (CEE) economies as depicted in Table 2.3 for
TM, EEI, EE1, EE2 and EE3. Northern economies provided 32.9 % to TM’s workplaces in 2012.
This share increased by 4.3-percentage points since 1998, while the share of CEE economies had also increased by 1.5-percentage points. Simultaneously, the southern and other Member States lost some of their former importance throughout the period under investigation.
For the EEI, the increase in weight was of similar magnitude for northern economies as in TM, while for CEE economies it was even more pronounced. Their share of employment increased from 11.2 % in 1998 to 14.8 % in 2012. The southern economies lost 1.8-percentage points over the whole period under consideration and in 2012 only had 16.8 % of EEI’s workplaces. The losses of other Member States were of similar size. It is important to note that most of the shifts in employment took place before 2009 and cannot be attributed to the Euro Area public debt
and banking crises. Northern and CEE economies gained shares above all in EE1. In EE2,
only the CEE economies gained significant shares as measured by the number of workplaces, whereas the northern economies lost their former weight. The southern economies maintained their weight in this sector. However, EE2 is most challenged by global competition and the EU-27 lost much of their former importance, in particular in markets for mass manufactured electronics.
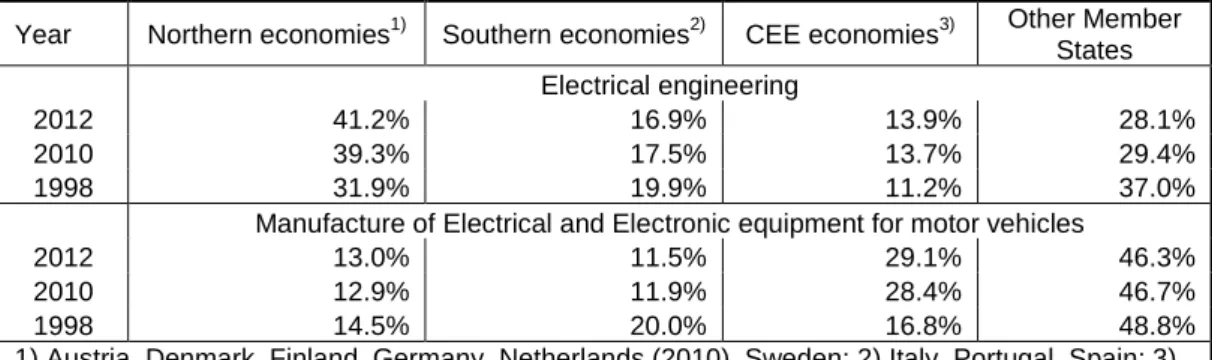
Table 2.3: Changes in the regional distribution of employment within the EU-27
Industry / sector Northern economies1) Southern economies2) CEE economies3) Other Member States 2012 Total manufacturing 32.9% 21.6% 15.7% 29.8%
Electrical and electronic
engineering 40.7% 16.8% 14.8% 27.7%
Electrical engineering 41.2% 16.9% 13.9% 28.1%
Electronic engineering 41.4% 16.8% 17.2% 24.5%
Electrical and electronic
components 34.4% 16.1% 14.7% 34.8%
2010
Total manufacturing 32.0% 22.5% 15.8% 29.8%
Electrical and electronic
engineering 39.3% 17.4% 14.6% 28.7%
Electrical engineering 8.5% 17.5% 13.7% 60.2%
Electronic engineering 41.5% 17.3% 16.6% 24.6%
Electrical and electronic
components 32.4% 16.3% 15.1% 36.2%
1998
Total manufacturing 28.6% 22.2% 14.2% 35.0%
Electrical and electronic
engineering 36.6% 18.6% 11.2% 33.6%
Electrical engineering 31.9% 19.9% 11.2% 37.0%
Electronic engineering 47.5% 16.4% 11.8% 24.4%
Electrical and electronic
components 33.5% 17.4% 9.7% 39.4%
1) Austria, Denmark, Finland, Germany, Netherlands (2010), Sweden; 2) Italy, Portugal, Spain; 3) Czech Republic (2010), Hungary, Poland, Slovakia.
Source: EUROSTAT; Cambridge Econometrics; Ifo Institute.
2.1 The EU electrical engineering sector
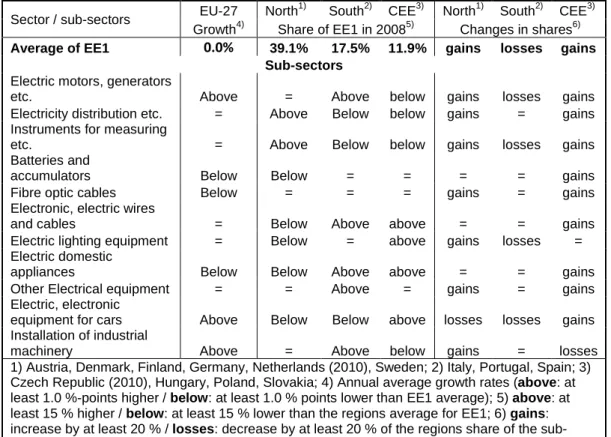
This chapter begins with an assessment of EE1 compared to its benchmark EEI and highlights the sector’s specifics and the evaluation of its price and trade performance. Moreover, it provides a synopsis of the major results derived from the investigation into the sub-sectors. The presentation of the detailed sub-sectoral results follows.
EE1 is an industry with a broad product programme that comprises capital goods, durable consumer goods and intermediary products. Parts, components and complex systems that are crucial for the quality and performance of final goods are also manufactured. Intermediary goods are delivered to other companies in the sector, such as for the construction of power generation plants, electricity grids, and also to a broad range of downstream industries. EE1 products provide essential functions in all kinds of transport equipment, airplanes, trains and cars. Industrial automation and process control in all manufacturing companies are based on EE1 products. Building automation, heating, air-conditioning and access authorisation as well as the equipment of private households with domestic appliances are similarly dependent on the supply of EE1.
For a long time – compared to EE2 and EE3 – EE1 was understood as a more conventional branch of total manufacturing with a moderate pace of innovation. However, throughout the past decade there have been changes across many of EE1’s sub-sectors and the pace of technological progress has accelerated. In some sub-sectors, dramatic shifts have been taking place that have not only affected product innovation, but also the structure of sub-sectors and upstream linkages, such as in the sub-sector “Lighting equipment and electric lamps”. These trends have to be taken into account when assessing the performance and future perspectives of the whole industry under investigation.
The EE1’s increasing importance as a supplier of innovations for downstream industries can be highlighted, above all, by deliveries into the automotive industry. During the early stages of the electronification of vehicles, the electro-mechanical motor control was replaced by electronic control and management systems. Throughout the past two decades, more electronic features have been integrated into vehicles to increase the comfort of drivers and passengers and to improve active and passive safety by anti-lock braking systems (ABS), Electronic Stability Program (ESP) etc. Self-driving cars – once just a utopic dream - have now been realised with the help of electrical and electronic engineering. Electro-mobility is another more recent trend driven by electric and electronic innovations. However, insufficient battery capacity has remained the Achilles heel for a widespread dissemination, despite all public incentives. While the more traditional electric
components – such as starters, lamps etc. – delivered to the automotive industry are aggregated in a separate sub-sector of EE1, the high-tech electronic components have not been allocated to this sub-sector. They cannot be easily spotted because they are not subsumed in a product group, or a single sub-sector.
Notably, the sub-sector “Lighting equipment and electric lamps” has been affected by new
technology based on upstream deliveries from EE3. The dissemination of the SSL-technology with LEDs has become a driver for product innovation and structural change of the sub-sector. LEDs provide a number of additional opportunities for the design of lighting and will lead to an enormous increase in energy efficiency compared to traditional light sources, which will be substituted to a large extent in the medium-term. A more application-driven (rather than standardisation-driven) design of light sources will lead to an intensification of the interaction between companies along the value chain and will provide leeway for companies at the lower end to open up new business opportunities. The semiconductor industry will become the most important supplier of key components for this sector. This means supply relationships between the industry’s sub-sectors EE1 and EE3 have been intensified by this innovation and will further deepen. This technology push highlights the growing importance of upstream key-technology dependency. In the area of SSL-technology, Asian manufacturers are globally in the lead by volume and they have long-standing experience in the production of LEDs. This strength eases Asian manufacturers’ access to the EU market, although EU manufacturers of light sources are the global leaders in this market. These large manufacturers have always been leading the market for traditional light sources and command a strong position in LEDs with technologically advanced and high-quality products. Their knowledge of specific applications and system engineering gives them an edge in competition with Asian suppliers who build on their ability to raise scale effects. The strengths of US companies in the area of SSL-technologies are especially based on innovations concerning the light spectrum. This underscores the necessity to investigate the international competitiveness along value chains in order to understand and assess the potential long-term perspectives of EU industries.
Photovoltaic – not a new technology, but one that has gained in importance for power generation – is another good example for the intra-industrial division of labour of the EEI. Photovoltaic cells are semiconductors mentioned under EE3 as products of NACE 26.1. Solar panels are delivered for the production of photovoltaic systems for the direct generation of electricity to manufacturing sites that are subsumed under the EE1 sub-sector “Electric motors, generators and transformers” (NACE 27.1). The manufacture of photovoltaic plants is subsumed under the EE1 sub-sector “Other electrical equipment n.e.c.” (NACE 27.90). As for lighting equipment, the supply relationships between EE1 and EE3 have become closer. This product group has grown over the past decade and will remain one of the growth drivers stimulated by public funding dedicated to reducing the CO2 footprint.
Likewise, the sub-sector “Accumulators and batteries” has undergone significant changes. In particular Lithium-ion batteries (LiB) have gained importance. Market penetration of these types of batteries has started in consumer electronics and with these applications they dominate the market. Here Asia has, once again, longstanding experience in R&D and in the production of small LiBs due to the region’s focus on the manufacture of consumer electronics. Asian manufacturers have become global market leaders. However, Asian manufacturers are challenged by the growing demand for batteries with high capacities. It has become evident that it is not sufficient to simply put together a large number of LiBs. Of crucial importance to the development of batteries with large capacities and high energy density is a sophisticated battery management process for longevity and safe handling.3 These technologies are urgently needed for a widespread dissemination of electro-mobility and for back-up storages necessary for smoothing fluctuating power generation by renewables. In these technologies the EU EE1 commands a strong position, to a certain extent based on European strengths in power electronics and interdisciplinary research.
For more than a decade another tendency has been observed: a growing integration of different
technologies and services towards complex systems. One striking example is smart grids. New
technological opportunities and escalating efforts to shift from fossil power generation to
renewables have required a more flexible adjustment of both power supply and electricity demand. Power engineering has to be developed further, with problems to be solved for the technical implementation of long-distance DC transmission, such as high-voltage breakers, where a
European player has made a breakthrough development of worldwide importance. Simultaneously, wide area monitoring, regulation and control systems based on computers, sensors and software tools for data processing have to be combined for a well-functioning and flexible power supply that enables the final consumer of electricity to adjust their demand on the basis of price information received from advanced metering infrastructure. Smart grids is a type of technology that reaches beyond traditional sectoral or sectoral boundaries and cannot be aggregated into one sub-sector of the EEI. The different parts and components are scattered over different product groups of EEI. However, a separate analysis of this technology is provided within the sub-sector “Electrical distribution and control apparatus” to provide a comprehensive overview.
Production automation is another cross-sectoral area of technology that cannot be assigned to a single industry. It is a combination of products from the majority of EEI’s sub-sectors and reaches beyond the industry under investigation – in particular mechanical engineering and related software service providers. The integration of hardware, software and related services has become one of the characteristics of advanced technologies, which is of particular importance to companies with a stake in production automation. This trend provides new business opportunities that can be used to substitute the loss of workplaces in the course of globalisation by a growing international division of labour whereby the manufacture of simple parts and intermediary products is relocated to emerging economies. Beyond maintenance and repair, more comprehensive after-sales-services and even the operation of complete power generation plants, grids and production systems for clients have become promising business areas. These services not only provide opportunities for employment but also allow companies to run steadier businesses, such as the marketing of capital goods with its volatile demand cycles. Machinery and equipment for production automation are widespread throughout numerous sub-sectors but will be tackled in a subsection on installation of industrial machinery and equipment (2.1.11).
3
Boeing’s problems with LIBs used in its latest and most advanced airliner indicate yet existing difficulties in new applications.