Erik Figenbaum Marika Kolbenstvedt
Pathways to electromobility -
perspectives based on
Pathways to electromobility - perspectives
based on Norwegian experiences
Erik Figenbaum Marika Kolbenstvedt
This report is covered by the terms and conditions specified by the Norwegian Copyright Act. Contents of the report may be used for referencing or as a source of information. Quotations or references must be attributed to the Institute of Transport Economics (TØI) as the source with specific mention made to the author and report number. For other use, advance permission must be provided by TØI.
ISSN 0808-1190
ISBN 978-82-480-1645-8 Paper version
Tittel: Veier til elektromobilitet - perspektiver basert på norske erfaringer
Pathways to electromobility - perspectives based on Norwegian experiences
Title:
Forfattere: Erik Figenbaum
Marika Kolbenstvedt
Author(s): Erik Figenbaum
Marika Kolbenstvedt TØI rapport: Sider TØI report: Pages Dato: Date: 05.2015 05.2015 1420/2015 1420/2015 65 65 978-82-480-1645-8 978-82-480-1645-8
ISBN Paper: ISBN Papir:
ISSN 0808-1190 ISSN 0808-1190 978-82-480-1643-4 ISBN Elektronisk: 978-82-480-1643-4 ISBN Electronic: Finansieringskilde: Financed by: EU 7th FP (Electromobility+)
Institute of Transport Economics The Research Council of Norway Transnova
EU 7th FP (Electromobility+) Norges forskningsråd Transnova
Transportøkonomisk institutt
Project: 3826 - Compett Prosjekt: 3826 - Compett
Terje Assum Kvalitetsansvarlig:
Terje Assum Quality manager:
Prosjektleder: Erik Figenbaum Project manager: Erik Figenbaum
Brukergrupper Diffusjon Elbil Fler-nivå analyse Politikk Regional endring Emneord: Diffusion Electric Vehicles Multi-Level Perspective Policy Regional transition User groups Key words:
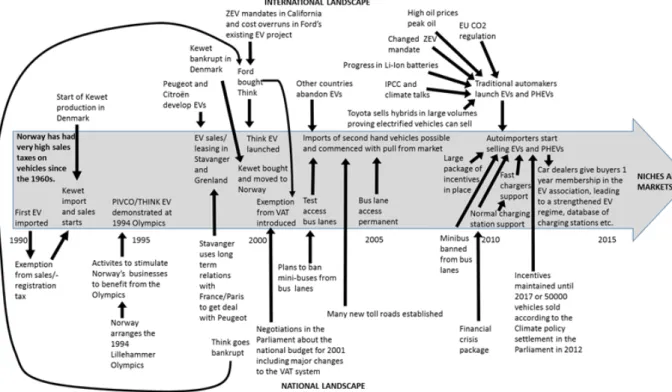
Rapporten presenterer to analyser av den norske elbilhistorien. Den første bruker et fler-nivå perspektiv (MLP) for å se på hvordan samspillet mellom hendelser i og mellom nisje-, regime- og landskapsnivåene formet den norske elbilpolitikken og ledet til verdens raskeste diffusjon av elbiler. Den andre ser på brukernes kjøp og tilnærming fra et sosio-teknisk perspektiv. Et langsiktig, tydelig og stabilt politisk rammeverk etablert bit for bit og med evne til opprettholde stabilitet og fokus over lengre tidsperioder, synes å være gode veier til suksess. Elbilenes kvaliteter, insentiver som gir brukerne relative fordeler framfor andre biler og økt tilgang på elbiler har vært effektiv diffusjonsmekanismer. Prosessen startet i
byregionene, men elbiler selges nå over hele landet. Bedre teknologi som gir lengre rekkevidde og lavere priser vil trolig gjøre det lettere for andre land å velge blant de mange insentiver som er testet ut i Norge og å utvikle egne tiltakspakker.
Sammendrag: The report presents two analyses of the Norwegian Electric
Vehicle (EV) story. The first one is using the multi-level perspective (MLP) framework to investigate how the interaction of events in and between the niche, regime and landscape levels, shaped the Norwegian EV policies that led to the world’s fastest diffusion of EVs. The second one looks at user adoption from a socio-technical perspective. A long-term evolving political framework built up piece by piece by many actors and with an ability to maintain stability and focus over long time periods, seem to be ways to success. EVs qualities, incentives giving relative advantages and increased availability of vehicles were effective diffusion mechanisms. The process started in urban regions but is now covering other locations as well. Technology development leading to longer range and lower prices should make it easier for other countries to choose between the many incentives tested in Norway and develop their own packages.
Summary: English Language of report: Transportøkonomisk Institutt Gaustadalleen 21, 0349 Oslo Telefon 22 57 38 00 - www.toi.no Institute of Transport Economics
Gaustadalleen 21, 0349 Oslo, Norway Telefon 22 57 38 00 - www.toi.no
This report is a part of the COMPETT project (Competitive Electric Town Transport) which is part of the ERA-NET Electromobility+ programme. Electromobility+ has initiated eighteen projects about electric vehicles concerning topics from the development of battery and charging technology to sociological investigations of the use of electric vehicles. COMPETT is a co-operation between the Institute of Transport Economics (TØI) in Norway, The Austrian Energy Agency (AEA), the University College Buskerud and Vestfold in Norway, Kongsberg Innovation in Norway and the Danish Road Directorate (DRD). The COMPETT project is jointly financed by the EU’s 7th FP (Electromobility+ programme),
Transnova (up to 31.12.2014), the Norwegian Public Roads Administration (from 01.01.2015), the Research Council of Norway (RCN), the Austrian Research Promotion Agency (FFG) of Austria and the Ministry of Science, Innovation and Higher Education in Denmark.
The objective of COMPETT is to facilitate the uptake of electric vehicles, particularly focussing on private passenger cars. The main question to be answered is: “How can electric vehicles come in to use to a greater degree?”.
This report contains two analyses of the Norwegian electric vehicles (EV’s) history. The first one, using the multi-level perspective framework to investigate the development of the framework for EVs in Norway, is presented in Part I. The second analysis, looking at user adoption from a socio-technical perspective with the theory of diffusion of innovations, is presented in Part II. The two parts can be read separately, and also have some duplicating parts or figures. However, since they supplement each other, TØI decided to publish them together.
Part I is mainly written by Erik Figenbaum with contributions from Marika Kolbenstvedt. Part II is jointly written by these two authors. Tove Ekstrøm has been responsible for the finishing. Following COMPETT’s quality assurance guidelines, COMPETT partners Reinhard Jellinek, AEA and Lykke Møller Iversen, DRD have reviewed the report. Terje Assum has been TØI’s quality assurer.
Oslo, May 2015
Institute of Transport Economics
Gunnar Lindberg Michael Wøhlk Jæger Sørensen Managing director Research Director
Contents
SummarySammendrag
Background ... 1
Electrification to reduce greenhouse gases from transport ... 1
Norway - a test site for electromobility ... 2
Different frameworks to analyse diffusion ... 3
Common materials ... 4
References... 5
Part I: A multi-level perspective on EVs in Norway ... 5
I:1 Introduction ... 6
I:2 Theoretical framework ... 6
I:3 Methods ... 9
I:4 Results ... 9
I:4.1 National characteristics ... 9
I:4.2 Experimental niche activities between 1989-1998 ... 11
I:4.3 The rise of the EV regime from 1999 to 2002 ... 13
I:4.4 The EV regime muddles through from 2003 to 2009 ... 14
I:4.5 Joining the party in 2010, the ICE regime swiftly took the initiative ... 16
I:4.6 Windows of opportunity ... 18
I:4.7 The fate of the competing technologies... 20
I:4.8 Resulting MLP-model for Norway ... 21
I:5 Discussion ... 22
I:6 Conclusions ... 25
I.7 References... 26
Part II Diffusion of EVs in Norway ... 29
II.1 Introduction ... 29
II:2 Theoretical framework ... 29
II:2.1 Diffusion as a social process ... 29
II:2.2 Characteristics of innovation ... 30
II:2.3 Diffusion systems and innovation decisions ... 31
II:2.4 Communication, channels and change agents ... 32
II:2.5 Nature of the social system ... 32
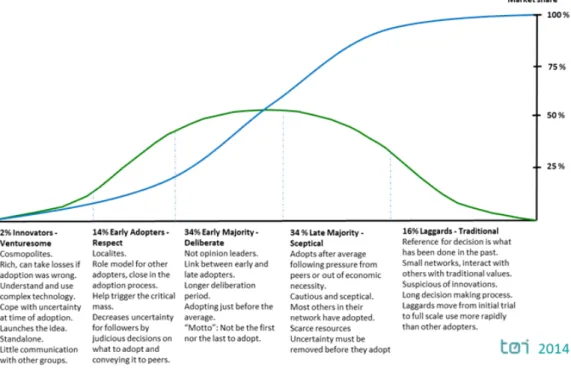
II:2.6 Different users in different phases ... 33
II:2.7 Expected diffusion ... 34
II:4 Actual diffusion patterns ... 36
II:4.1 National EV fleet ... 36
II:4.2 Regional diffusion ... 36
II:4.3 Market shares from 2011 ... 38
II:4.4 Diffusion by brand ... 39
II:4.5 EV segments’ market share ... 42
II:4.6 EV owners, coming buyers and non-buyers ... 43
II:5 Factors affecting diffusion rate and pattern ... 44
II:5.1 National characteristics ... 44
II:5.2 Norwegian EV incentives ... 45
II:5.3 Diffuser incentives ... 48
II:5.4 Attributes changing over time ... 49
II:5.5 User perception ... 51
II: 5.6 Meeting user needs ... 54
II:5.7 Communication channels ... 55
II:5.8 Role of change agents and change aids... 57
II:6 Discussion ... 58
II:6.1 Norway as a European Test site ... 58
II:6.2 EV diffusion in accordance with the theory ... 59
II:6.3 Changes in key elements influencing diffusion ... 60
II.7 Conclusions - challenges and opportunities ... 61
II:8 References ... 62
Part III: Learnings from Norway based on part I and II ... 65
Acronyms used in the report
EV Electric vehicle, is used for Battery Electric vehicles BEV Battery Electric Vehicle, only powered by electricity ICE Internal Combustion Engine
HEV Hybrid Electric Vehicle ICE Internal Combustion Engine
PEV Plug-in Electric Vehicle, includes both BEVs and PHEVs
PHEV Plug-in Hybrid Electric Vehicle, powered by electricity recharged from the grid and ICEs fuelled by diesel or gasoline. Alternatively an ICE running as generator producing electricity used in the motor.
Summary:
Pathways to electromobility - perspectives
based on Norwegian experiences
TØI Report 1420/2015 Authors: Erik Figenbaum and Marika Kolbenstvedt Oslo 2015, 65 pages English language
Electric propulsion is much more energy-efficient than internal combustion engines (ICEs), and electric vehicles (EVs) emit no local pollutants and greenhouse gases. Norwegian authorities have introduced a number of incentives for EV diffusion, in order to support a transition to more environmentally friendly transport. Norway is at the moment a leading EV country where 20% of the new vehicle market were EVs in the 1st quarter of 2015 and EVs constituted 2% of the total
fleet of passenger vehicles. The report is a part of the Electromobility+ project COMPETT, which should answer the main question: “How can EVs come to use to a greater degree?” The report provides some insights by presenting two analyses of the Norwegian EV story. The first one uses a multi-level perspective (MLP) to look at the interaction of events and actors at the niche, regime and landscape levels. The second one looks at user adoption from a socio-technical perspective using the theory of diffusion of innovations.
Introduction
Norway has had incentives for EVs since 1990. In the beginning these incentives were put in place to allow testing and experimenting with EVs. From about the year 2000 focus shifted to support a potential growing Norwegian EV industry, whereas from 2010 and onwards the policies have been linked to the policies for reducing climate gas emissions in Norway. Purchase incentives reduce the purchase cost of EVs. EVs are exempted from the Value added tax (25%) as well as the registration tax imposed on other vehicles being registered for the first time in Norway. The result is that small EVs cost about the same as comparable gasoline and diesel vehicles in Norway whereas compact and larger EVs are cheaper. In addition EVs have access to bus lanes and free parking, they do not pay on toll roads and have reduced rates on main road ferries crossing the Norwegian fjords. Annual tax is also reduced.
Part I: A multi-level perspective on EVs in Norway
The multilevel perspective framework developed by Geels (2003) and others, centres around the concept of interaction between niche activities in the market, regimes that consist of automotive actors, stakeholders, established practises of vehicle usage and the landscape being external factors originating internationally or nationally such as oil prices and the climate policies. Niche activities may according to this framework breakthrough as a result of windows of opportunity opening up the established regime often as a result of pressure from the landscape.
The success of EVs in Norway seems to be a result of the long-term stable political framework built up piece by piece by many actors and stakeholders. Heavy vehicle
not been much criticism of these policies. The introduction of long-term EV policies and incentives, addressing the various weaknesses of EVs, have allowed businesses to recognize and seize opportunities. The policies and incentives have been so
successful that in April of 2015, Norway had 50 000 EVs, this being 2% of the total fleet of passenger vehicles in the country. Thus, Norway has become the forerunning country within electro mobility.
The framing of the policies has evolved from first allowed testing of EVs, then support to industrial development, and finally the EV policy framed as a climate mitigation measure, leading to greater acceptance of the policies. These policies gave the traditional vehicle manufacturers a head start in the Norwegian market as they established a new EV regime within the ICE regime. This new regime could utilize the effects of all the achievements and incentives built up by the independent EV regime over a period of two decades. Other countries can take inspiration from the Norwegian policies, but may need to follow other paths as different windows of opportunity may open up for them.
The EV diffusion seems to be on a transformational path of transformation
internationally where moderate pressure on the ICE regime is leading to a gradual establishment of an EV regime. The EV regime grew out of the old regime through a reorientation of the powering of automobiles while keeping other basic vehicle features unchanged. In Norway, the policies and pressure from the landscape have been much larger, leading towards an incentive driven “technology substitution path”.
Being a country at the forefront of electro mobility could cost more money and strain public budgets more than Norwegian politicians originally anticipated. Globally electro mobility develops more slowly compared to the rapid changes seen in
Norway. This will lead to the cost of vehicles remaining higher for longer, as the total volume of EVs produced will increase at a slower rate, than if all countries had progressed at Norway’s rate. It could also lead to a narrower selection of models as the automakers may delay the introduction of new models. The risk of international setbacks in EV development is, thus, the main uncertainty for electro mobility in Norway. The other major uncertainty, the revision of the incentives, will also have an inevitable impact on sales.
Part II: Diffusion of EVs in Norway
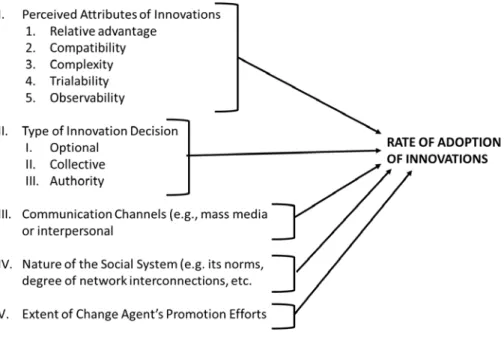
The technology itself, its characteristics and ability to meet user needs, and the ability to change the technology during the process to avoid possible weaknesses, is the key element of diffusion. The rate of diffusion (Rogers 1995) is influenced by the
perception of technology with respect to:
• Relative advantages of the innovation related to other technologies can be financial,
practical, environmental and personal, giving social status or satisfaction. Examples are economic profitability, low initial cost, improved comfort, saving time or effort, immediacy of reward.
• Compatibility with the users’ needs, basic values and norms in the social system.
The more radical and disruptive technology, the less it is compatible with existing practises, norms and values, the slower its rate of adoption.
• Complexity conceives how easy it is to understand and put the technology to use,
and its ability and flexibility to accommodate more opportunities. The more complex the innovation, the lower the adoption rate is.
on a small scale are perceived as less uncertain and easier to implement than those that require full implementation immediately. Trialability is more important for early than for later adopters. The latter will be helped by information from adopting peers.
• Observability/visibility for new users can increase the speed of implementation. This
factor stresses the importance of network communication and the strategy for launching the product.
Incentives to speed up EV adoption should address these factors, especially the first one, Relative advantage, which is the most influential in the diffusion process. The improved technology and reduced costs combined with the incentives have resulted in Norwegian EV buyers noticing that EVs have many relative advantages over ICE vehicles. The limited range is not a hindrance to adoption. Drivers learn to manage range limits. The reward is immediate as the EVs cost the same or less than ICEs, and their operative costs are much lower due to their energy efficiency and low cost energy carrier. Hence, one may claim that EVs are both climate friendly and low variable cost vehicles suitable for daily travel needs.
The diffusion process started in larger urban regions of Norway but now covers smaller cities and rural areas as well. To get the diffusion of EVs started, cities should be targeted. However, they should not be targeted when there is concern regarding an increase in traffic. Although this is a dilemma, the diffusion pattern shows that EVs spread to rural areas from the cities, suggesting that the issue is temporal. There is potential for future growth supported by diffusion through interpersonal networks, i.e. friends, families and colleagues and the anticipated availability of new longer-range models attracting new customer groups. Technology that gives longer range at lower prices, should make it easier for other countries to support the
introduction of EVs by choosing between the many incentives tested in Norway and developing their own packages.
The diffusion of EVs in Norway resembles what is expected from diffusion theory. An achievement of the EV policy is that national, regional and local governments, businesses and NGOs have been motivated to move in the same direction. The actual rate of diffusion will be heavily influenced by possible modifications to the societal and economic framework and cooperation. The Norwegian EV market is, however, dependent on the other automotive markets. If diffusion does not catch on globally or in Europe, the diffusion of EVs in Norway may slow down.
Part III: Learnings from Norway based on part I and II
The two perspectives in this report complement each other and provide a good understanding of how the EV policies in Norway came to being and how they have influenced the market actors and the vehicle buyers.
The EV policy has consistently been pro EV in Norway, indicating to users that the technology is compatible with societal needs, although the reasoning has changed. Other competing options such as biofuels have been more debated. The positive EV communication in Norway might have inspired a greater share of the general vehicle owners to consider buying an EV compared to the general vehicle owners in other countries were the communication is more ambivalent.
speed up diffusion whilst EVs are more expensive than ICEs. These incentives came about through a series of unique events where stakeholders took advantage of windows of opportunity. Other countries will need to find their own way of
supporting EVs as other windows of opportunity may appear and they will have their own framework of vehicle policies to start from.
Incentives that address and improve on the perceived relative advantage of EVs as seen by the potential buyers will be the most effective in speeding up the adoption of EVs. In Norway it has been seen that purchase incentives have been particularly effective in speeding up adoption in combination with user incentives that give EVs a relative advantage that is not available to others.
When the price is right and vehicle buyers are aware of and see the advantages of EVs, the diffusion pattern will be similar to that of other innovations.
Sammendrag:
Veier til elektromobilitet - perspektiver basert
på norske erfaringer
TØI Rapport 1420/2015 Forfattere: Erik Figenbaum og Marika Kolbenstvedt Oslo 2015, 65 sider, engelsk språk
Elmotorer er langt mer energieffektive enn motorer som drives av bensin eller diesel og elbiler slipper ikke ut noe lokal forurensning eller klimagasser. For å støtte en overgang til en mer miljøvennlig og bærekraftig transport har norske politikere og myndigheter derfor innført en rekke insentiver for å øke bruken av elbiler. Norge er i øyeblikket et ledende land for diffusjon av elbiler. I første kvartal 2015 utgjorde elbiler 20% av nybilsalget og elbiler utgjorde 2% av den samlede personbilflåten. Rapporten presenterer to analyser fra COMPETT prosjektet under EU’s Electromobility+ program. COMPETT skulle belyse spørsmålet: «Hvordan kan man gjøre elbiler mer
konkurransedyktige og øke bruken av dem?» Rapporten søker å gi noen svar ved å presentere to analyser av den norske elbilhistorien. Den første bruker et fler-nivå perspektiv (MLP) for å se på hvordan samspillet mellom hendelser og aktører på nisje-, regime- og landskapsnivåene har formet den norske elbilpolitikken. Den andre ser på brukernes kjøp og tilpasninger fra et sosio-teknisk perspektiv basert på teori om spredning av innovasjoner.
Bakgrunn
Norge har helt fra 1990 hatt en rekke insentiver for å støtte elbiler. Begrunnelsen på dette tidspunkt var å legge til rette for å teste ut og eksperimentere med elbiler, og ble fra 2000 klart uttrykt som å støtte en mulig voksende norsk elbilindustri. Fra 2010 og framover har elbilpolitikkens fokus vært koplet til klimapolitikken og målet om å redusere klimagassutslippene i Norge. Unntak fra registreringsavgift og
merverdiavgift ved kjøp av elbiler redusere kjøpskostnadene for mindre elbiler til et nivå på linje med prisen til tilsvarende bensin- eller dieselbiler, mens større elbiler blir billigere enn de tradisjonelle bilene i dette segmentet. I tillegg har elbiler enkelte steder tilgang til å kjøre i kollektivfelt og til gratis parkering og ladning. Andre økonomiske insentiver er fritak for bompenger, redusert avgift for bilen på ferger og redusert årsavgift.
Del I: Et fler-nivå perspektiv på elbiler i Norge
Rammeverket for fler-nivå analyser utviklet av Geels m.fl. (2003) er ment å fange samspillet mellom aktiviteter på tre nivåer; 1) nisjenivået som viser aktiviteter og ikke minst innovasjoner i markedet, 2) regimenivået som omfatter de etablerte
interessenter i bilbransjen, poltikken og den vante praksis for bilbruk samt 3) landskapsnivået som fanger de mange ytre påvirkningsfaktorer, internasjonalt og nasjonalt, fra oljepriser til klimapolitikk. Nisje aktiviteter kan i henhold til denne
av press fra landskapsnivået.
Suksessen i Norge synes å være et resultat av et langsiktig, tydelig og stabilt politisk rammeverk etablert bit for bit og som har involvert mange interessenter. Høye norske bilavgiftene ga rom for avgiftslettelser, noe som nok er lettere å få til enn nye direkte subsidieordninger. Denne langsiktigheten, insentivene og etablering av egne “elbilregimer” gjorde det lettere for den tradisjonelle bilbransjen både å se og utnytte mulighetene og å møte elbilenes ulike svakheter. Politikken har gitt resultater. I første kvartal 2015 sto elbiler for 20% av nybilsalget og elbiler utgjorde 2% av den samlede personbilflåten, noe som har gjort at Norge i øyeblikket er et ledende land når det gjelder diffusjon av elbiler.
Rammeverket utviklet seg fra tilrettelegging for testing av elbiler, så støtte til norsk industriutvikling, og til slutt en elbilpolitikk innenfor rammen av klimapolitikken. Dette synes å ha medført en høy akseptanse for politikken. De tradisjonelle bilprodusentene som etablerte et elbilregime innenfor forbrenningsmotor-regimet fikk et forsprang på det norske markedet. Dette nye regimet kunne bruke alle de fordelene det uavhengige elbilregimet hadde fått bygget opp gjennom tjue år. Elbilregimet vokste fram fra det gamle bilregimet via en nyvinning mht.
motordrivkraften, mens andre kjennetegn ved en bil forble uendret. I Norge ga mulighetene for teknologisk og miljømessig endring et sterkt press fra det politiske system, fra landskapsnivået. Også internasjonalt synes det nå å være et press på forbrenningsmotor-regimet i retning av en økt tilrettelegging for bruk av elbiler. Andre land kan bli inspirert og lære av den norske politikken, men trenger å lage sin egen vei utfra de mulighetsvinduer som kan åpne seg i deres land.
Å være et foregangsland for elektromobilitet kan komme til å koste mer enn det norske myndigheter hadde forutsett. Elektromobiliteten utvikles mye saktere globalt enn i Norge. Det fører til at produksjonsvolumet ikke blir så stort og at en får en lengre periode med høye kostnader på bilene. Det kan også gi et smalere utvalg av modeller. Risikoen for et internasjonalt tilbakeslag når det gjelder salget av elbiler er den største usikkerheten for utviklingen framover i Norge.
Del II: Diffusjon av elbiler i Norge
Elbilteknologiens egenskaper, evne til å møte brukernes behov samt å videreutvikle teknologien for å unngå eventuelle svakheter er nøkkelelementer i en diffusjons-prosess. Diffusjonstakten (Rogers 1995) påvirkes av hvordan teknologien oppfattes når det gjelder:
• Relative fordeler i forhold til andre teknologiers, f. eks. lavere innkjøpspris, lavere
driftskostnader, bedre komfort, miljøvennlighet, tidsbesparelser, sosial status eller tilfredshet.
• Overenstemmelse med brukerens behov, grunnleggende verdier og normer i
samfunnet.
• Kompleksitet, dvs hvor enkelt det er å forstå og bruke teknologien, og dens evne og
fleksibilitet mht å utvikle flere muligheter.
• Testbarhet eller muligheter for å få prøve ut teknologien. Innovasjoner som kan
prøves ut i liten skala oppleves som mindre usikre enn de som krever full implementering med en gang. Mulighetene for utprøvning er viktigere for tidlig-brukerne enn for de som kommer seinere som lettere kan få informasjon.
nettverkskommunikasjon og en strategi for å lansere det nye produktet. Insentiver som skal bidra til økt adopsjon av elbiler må ta hensyn til de nevnte faktorer, særlig relative fordeler. Stadig bedre teknologi og lavere kostnader
kombinert med insentiver har medført at norske brukere oppfatter at elbiler har flere fordeler som ikke de tradisjonelle bilene har. Begrenset rekkevidde er ikke noe hinder for de fleste daglige reiser og førerne lærer å håndtere dette. Belønningen er
umiddelbar siden elbilen, gitt insentivene, har samme eller lavere pris enn tilsvarende bensin/diesel-biler og dessuten mye lavere operative kostnader pga. sin
energieffektive motor. Det er dermed mulig å markedsfører elbiler både som et klimavennlig og billig kjøretøy egnet for hverdagens reiser. Diffusjonsprosessen startet i byregionene, men elbiler selges nå over hele landet, i tettsteder og på
landsbygda. Å satse på økt elbilbruk i byene samtidig som det er nettopp der man vil unngå økt trafikk er et dilemma, men som ut fra erfaringene synes å være av
temporær karakter.
Potensialet for framtidig vekst ligger både i teknologiutviklingen som kan gi lengre rekkevidde til lavere pris og dermed tiltrekke nye brukergrupper og i at de sosiale nettverk (venner, familie, naboer og kollegaer) fungerer som ambassadører for elbiler. Med billigere pris blir det lettere for andre land å støtte elbildiffusjon og å utvikle sine egne pakker ut fra de mange insentiver Norge har testet.
Elbilspredningen i Norge er som forventet ut fra diffusjonsteori. Elbilpolitikken har fått nasjonale, regionale og lokale myndigheter, bransjen og ulike organisasjoner å jobbe i same retning. Det norske elbilmarkedet er imidlertid avhengig av det internasjonale markedet. Om prosessen ikke tar fart internasjonalt, vil den kunne sakte opp i Norge.
Del III: Lærdommer fra Norge
De to perspektivene brukt i rapporten kompletterer hverandre og gir en forståelse for elbilpolitikken i Norge og hvordan den har påvirket markedsaktørene og elbilkjøperne.
En langsiktig elbilpolitikk har vist brukerne at teknologien er i overensstemmelse med samfunnets behov og verdier, selv om målet har vært endret. Andre alternative drivstoffer har i større grad vært temaer for diskusjon. Den positive
elbilkommunikasjonen kan ha gjort flere vanlig bileiere mer positive til å vurdere et elbilkjøp.
Erfaringene fra Norge viser helt tydelig at det trengs insentiver for å få fart på diffusjonsprosessen så lenge elbilene er dyrere enn de tradisjonelle bilene. Insentiver som øker potensielle brukeres oppfatning av relative fordeler er de mest effektive for å øke takten på diffusjonen. Når prisen er riktig, bilkjøperne har fått informasjon om og ser fordelene med elbiler vil diffusjonsmønstret bli det samme som for andre innovasjoner.
De norske insentivene kom til gjennom en serie unike hendelser der ulike aktører klarte å utnytte de mulighetesvinduer som oppsto. Andre land må finne egne veier til å støtte elbilutviklingen siden andre mulighetsvinduer kan dukke opp og de har andre rammebetingelser for sitt arbeid.
Background
To reach the 2°C target for global warming put forward by the UNFCC in 2014, a decrease of 40-70% of greenhouse gas emissions is estimated to be required in 2050 compared to emissions in 2010 (IPCC 2014). Road transportation emissions were 18.5 % of total EU emissions in 2012 according to the European Environment Agency. In Norway road transport accounted for 19% of emissions according to the Norwegian Environment agency (2014).
Electromobility at the EU level is anchored in the 2011 EU White Paper on
Transport, setting ambitious goals for phasing out conventionally fuelled cars in cities (EU 2011). Other important documents are the European Green Cars Initiative (EU 2009a), the EU Action Plan on Urban Mobility (EU 2009b) and the European alternative fuels strategy (EU 2014). These policies form the background for ERA-net’s Electromobility+ programme, funding 18 European projects on this topic. One of these projects, “Competitive Electric Town Transport” (COMPETT), which this report is part of, focuses how to make electric vehicles competitive in the motorized individual transport market. COMPETT have partners in Austria, Denmark and Norway.
Policies reducing transport volumes, shifting transport into more efficient modes and improving the energy efficiency of each mode, will be required to contribute to the targets for reduction of greenhouse gas emissions from transportation. Electrification of passenger vehicles, being the theme of this report, is targeting the improvement of the energy efficiency.
Electrification to reduce greenhouse gases from transport
Electric vehicles (EVs) having a motor and four wheels like all cars, constitute an
environmental innovation, being more energy efficient and emitting no local pollutants. The energy is charged into batteries from the electricity grid, mainly overnight at home. Charging at work or public places during the day will extend the driving range. Also fast charging will extend the range. Normal charging takes 6 - 13 hours depending on the vehicle and the electrical connection available. Fast charging can typically give 80% charge in 20 minutes, less in winter as batteries do not handle fast charging well when cold. In daily driving, the drivers usually do something else while the vehicles charge, such as sleeping, eating, being in a meeting, at work or some other activity.
In the early 20th century, EVs were popular because of the ease of operation. Range limitations and the invention of the electric starter for internal combustion engine vehicles (ICE), made EVs disappear. Recent years’ progress in Li-Ion battery technology and increased environmental policy pressure have led to the rebirth of EVs.
Greenhouse gas emissions from well to wheel are much lower from EVs than from ICEs when electricity is produced from hydroelectric or wind power and from the more controversial nuclear power. The average European electricity mix will also yield significant benefits. These benefits will increase as the electricity production becomes less CO2-intensive over time in Europe. Being part of the EU Emission Trading Scheme, electricity production will gradually be decarbonized as the
maximum cap on CO2-emissions is reduced. Electrification of vehicles is thus an important measure to reduce environmental impacts and greenhouse gas emissions from transport.
Norway - a test site for electromobility
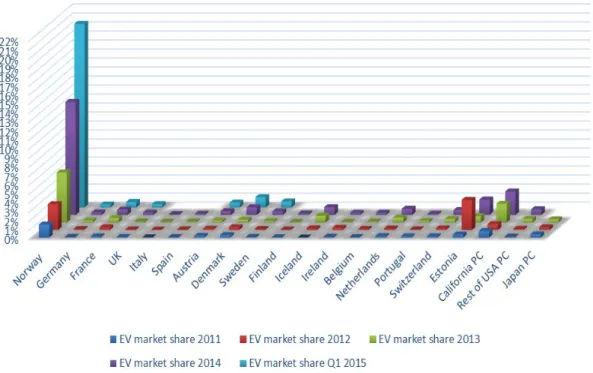
Norway has been a highly successful EV market with consumers buying 80% of the EVs sold (Gronnbil 2015). The market share of EVs reached 12.5% of new vehicle sales in 2014 and increased to 20% in the first quarter of 2015 (OFVAS 2015). Most other countries have market shares less than 1% and most often fleets is the
dominating adopter. In fact no other country have moved past 5% market share for battery electric vehicles in any year according to Statistical sources in each country, see figure 1.
Figure 1 EV market shares in Europe, USA and Japan. Percent. Sources includes: National statistical offices various webpages, historical sales material, for detailed references see Figenbaum et.al. (2015).
Learnings from the Norwegian diffusion of EVs as well as the identification of elements in society, car technology/ industry and related to stakeholders and users, having contributed to the success, are thus of general interest. Understanding the interplay between the society, the technology and the users must be seen from different perspectives. Other studies of potential EV market diffusion are often more theoretical, with no basis on real life experiences and real user attitudes and
considerations. In Norway we find:
1. Enough EVs to study the users’ experiences of pro’s and con’s in using EVs and how the users adjust to possible challenges.
2. Many incentives making it possible to study their effect on various aspects of diffusion of EVs.
3. A clear EV policy with incentives anchored in a climate policy settlement (2012) in the Norwegian parliament.
The purpose of this report is to investigate why and how EVs entered the Norwegian automotive market and how the political framework and stakeholder activities
evolved and influenced EV adoption.
Different frameworks to analyse diffusion
Several models or frameworks exist for the diffusion of technologies in a market. Some attempt to present the complex interaction between different actors at different level of society and how that interaction affects the ability of a technology to make a breakthrough into the mass market. One such framework is the multilevel perspective (MLP developed by Geels 2012). The MLP framework aims at explaining diffusion of technologies as interplay between the actors and practises at three levels:
1. Niche activities among the users and buyers.
2. The regime with actors being car producers, charging network providers, NGOs, municipalities, other industries as well as established practises of car usage.
3. The landscape with influencing exogenous factors such as the oil price, international politics, peak oil etc.
The MLP is most commonly used at the global level, but it can be adapted to a local level. This types of models are not so well developed when it comes to explaining diffusion at the micro level, such as:
• the pattern of EV diffusion in a region or between population groups and vehicle segments,
• what actually makes EVs diffuse,
• how the decisions to adopt are made and who influence it,
• why is the diffusion is going so fast in Norway after 2010,
• why some do adopt and others no.
The MLP models are better at explaining the early parts of the diffusion before the more stable mass market phase starts. Once the rules are set, i.e. the policies have been defined and incentives are introduced, the technologies spread as a result of cost reductions resulting from mass production, growing information, competence and confidence among potential buyers, as the number of buyers and users increases. In this phase more traditional models such as the diffusion of innovations by Rogers (1965, 1995) may be more relevant and better at explaining the diffusion pattern, i.e. why, how and when various adopter groups decide to adopt or not and who
influence the decision.
The political framework in Norway, i.e. incentives and policies, affecting the
introduction, has remained stable since 2011, the entire period with rapid increase in sales of EVs in Norway from a market share of only 0.3% in 2010 to over 20% in 2015. 2010 also marks the year when the initiative in the market switched form niche actors to the traditional car industry with EVs becoming available in unlimited volumes all over Norway from several car manufacturers. The fact that 80% of the vehicles sold after 2010 belong to individual consumers highlights the need to use a consumer oriented diffusion model.
In this report the MLP model will be used as the basic theory to analyse the interplay between actors and markets over the first two decades of EV development in
Norway, i.e. from 1990-2010, and the main factors that contributed to the
EVs will mainly be analysed using Roger’s theory of diffusion of innovations focusing on the period after 2010, a period when the users had options for real choices.
Common materials
Knowledge on consumer attitudes, behaviour and experiences is taken from the COMPETT net surveys of 1721 EV owners belonging to the Norwegian EV association and of 2241 general vehicle owning members of the Norwegian Automobile Federation (NAF) in January and February 2014 (Figenbaum, Kolbenstvedt & Elvebakk (2014). The latter survey could further be divided into potential EV users and determined non-users, expressing respectively an interest or no interest in taking up EVs the next time they would buy vehicles. In addition a series of interviews was conducted with various stakeholders from government, local authorities, NGOs, consumer organizations, car importers and car dealers from April to September 2014 (Assum, Kolbenstvedt & Figenbaum 2014). Results from these surveys are used in both parts of this report.
Links to the survey was sent out in a newsletter from the EV and NAF associations. The response rates were in the interval 22-40% depending on the assumptions made about how many actually saw the link of those who opened the newsletter
(Figenbaum, Kolbenstvedt & Elvebakk 2014).
At the time little knowledge existed on how the latest generation EVs were used. The questionnaire to the EV owners was developed taking the following considerations:
• It could not be too long so as to avoid people terminating in the middle of the survey
• It should cover as many as possible of the relevant topics for EV adoption
• The possibility to identify who the EV owners are and what their motivations are
• Compatibility with some questions asked in earlier surveys, to be able to follow changing attitudes to and perceptions of EV
• The possibility to compare with data from the national travel survey. Prior to the surveys a brief review of the literature on EV adoption was done to identify factors of relevance to EV adoption. Separate reviews of international EV related surveys (Hjorthol 2013) and of 20 earlier Norwegian surveys (Figenbaum & Kolbenstvedt 2013) were also used as inputs to the survey formulation. It is,
however, important to note that the rapid technological development of EVs makes such comparisons with earlier surveys complicated. The technical development has been rapid and the vehicles available in 2014 were different from the ones commonly in use in 2010. The result was that this survey contained up to 70 questions. The number varied as some questions were follow-ups depending on earlier answers. The survey of the ICE vehicle owners of the Norwegian Automobile association contained a subset of the questions asked to the EV owners. Some questions were reformulated to provide answers to the same topics as those asked to EV owners but seen from the perspective of non-owners. The COMPETT interviews of
stakeholders during 2014 (Assum, Kolbenstvedt & Figenbaum 2014), provide further insights. In addition facts about incentives, the timeline of introduction of EV
models and of the EV history in Norway (Figenbaum & Kolbenstvedt 2013), are used to explain the diffusion.
References
Assum, T., Kolbenstvedt, M. and Figenbaum, E. (2014). Potentials, barrieres and the future of electromobility in Norway. Stakeholders perspectives. COMPETT and TØI report 1385/2014. Institute of Transport Economics 2014.
EU (2009a). European Green Vehicles Initiative PPP. Use of new energies in road transport. European Commission www.egvi.eu.
EU (2009b. The European Action Plan on Urban Mobility. http://eur-lex.europa.eu/legal-content/EN/ALL/?uri=CELEX:52009DC0490.
EU (2011). WHITE PAPER 2011. Roadmap to a Single European Transport Area – Towards a competitive and resource efficient transport system The European Community, Document 52011DC0144. /* COM/2011/0144 final */
EU (2014). Clean Power for Transport: A European alternative fuels strategy.
Directive 2014/94/EU of the European Parliament and of the Council of 22 October 2014. Figenbaum, E. and Kolbenstvedt, M. (2013). Electromobility in Norway - experiences and opportunities with electric vehicles. TØI report 1281/2013, Oslo, Transportøkonomisk institutt.
Figenbaum, E. Kolbenstvedt, M. and Elvebakk, B. (2014). Electric vehicles – environmental, economic and practical aspects. As seen by current and potential users. COMPETT and TØI report 1329/2014. Institute of Transport Economics 2014.
Figenbaum,E., Fearnley, N., Pfaffenbichler, P., Hjorthol, R., Kolbenstvedt, M. Emmerling, B., Jellinek, F., Bonnema, G.M., Ramjerdi,F. and Møller Iversen,L. (2014). Increasing competitivewness of e-vehicles in Europe. Submitted to EUROPEAN Transport Research Review, December 2014.
Figenbaum, E., Assum, T. and Kolbenstvedt, M. (2015). Electrification in Norway – environmental, economic and practical experienses. Article accepted for publication in Research in Transportation Economics in 2015.
Figenbaum, E., et.al. (2015). Competitive Electric Town Transport. Main results from COMPETT – an Electromobility+ project. TØI report 1422/2015.
Geels, F. W. (2012). A socio-Technical analysis of low-carbon transitions: Introducing the multi-level perspective into transport studies, Journal of Transport Geography24 (2012) 471-482
Gronnbil (2015). EV related statistics from the webpage www.gronnbil.no.
Hjorthol, R. (2013). Attitudes, ownership and use of Electric Vehicles - a review of literature. TØI Report 1261/2013. COMPETT, Work Package 2 Report. Transportøkonomisk
institutt, Austrian Energy Agency, Vejdirektoratet Denmark.
Norwegian Environment agency (2014). Kunnskapsgrunnlag for lavutslippsutvikling. Rapport M229-2014.
OFVAS (2015). Brand, segment and EV sales statistics from OFVAS,
http://www.ofvas.no/bilsalget/category404.html.
Rogers, E.M. (1962). Diffusion of Innovations. ISBN 0-612-62843-4. Glencoe Free Press. Rogers, E.M. (1995). Diffusion of Innovations. ISBN 0-7432-2209-1. New York, Free Press.
Part I: A multi-level perspective on
EVs in Norway
I:1 Introduction
The aim of this part or the report is to analyse the beginning of the transition from ICEs to EVs in Norway and identify what elements in society, car technology/ industry and different stakeholders and users that have contributed to the success of EVs. In particular the interplay between society, technology and users at different levels based on Rogers (1962, 1995) and Geels (2012) earlier work. Geels developed
the multi-level perspective (MLP) framework that forms the basis for this part of the
report, further as a tool to study transitions in the transport system.
The analysis is structured in six chapters. Chapter 2 describes the MLP approach as given by Geels (2012), the assumptions or kind of hypotheses we will look at and the reasons for choosing them. Chapter 3 presents the methods and materials used. Chapter 4 presents results related to the three levels in the MLP model operates with, 1) the landscape, 2) the regime and 3) the niche level as well as the interplay between the
levels. The results are discussed in relation to the proposed hypotheses/assumptions in chapter 5, paving the way for the conclusions in chapter 6.
I:2 Theoretical framework
Socio-technical frameworks conceptualise socio-technical systems of transportation as a configuration of elements, including technology, policy, markets, consumer preferences and behaviour, infrastructure, cultural meanings and scientific knowledge (Geels 2012). The systems are maintained, reproduced and changed by the actors, such as automakers, fuel providers, consumer organizations, media, engineers, authorities, researchers and others. A major shift in these systems is termed a socio-technical transition, possibly taking decades to unfold given the long development times and life of vehicles, as well as the extent that personal mobility using individual vehicles is entrenched in society.
The multi-level perspective (MLP) framework is “a heuristic framework to analyse ….co-evolution and interaction between industry, technology, markets, policy¸ culture and civil society”
(Geels 2012, p. 471). The perspective is defined like this:
“The basic premise of the multi-level perspective is that transitions are non-linear processes that result from the interplay of multiple developments at three analytical levels: niches (the locus for radical innovations), socio-technical regimes (the locus of established practices and associated rules), and an exogenous socio-socio-technical landscape (Rip and Kemp 1998; Geels, 2002 Geels and Schot 2007). These ‘levels’ refer to heterogeneous configurations of increasing stability, which can be seen as a nested hierarchy with regimes being embedded within landscapes and niches existing inside or outside regimes (Fig. 1). The MLP helps explain why there may simultaneously be a flurry of change activities (at the niche level) and relative stability of existing regimes.” (Geels 2012, p. 472).
“The MLP does not employ linear cause and-effect relationships or simple drivers. Instead, it emphasises mutually reinforcing developments, alignments, co-evolution, innovation cascades, knock-on effects, and hype-disappointment cycles. Because of these characteristics, the MLP is not a ‘truth machine’ that automatically
produces the ‘right’ answers when the analyst enters the data. Instead it is a heuristic framework that guides the analyst’s attention to relevant questions and issues. Application therefore requires both substantive knowledge of the empirical domain and theoretical sensitivity (and interpretive creativity) that help the analyst ‘see’ interesting patterns and mechanisms. The MLP represents a certain epistemological style (interpretive research), which is well suited to study uncertain and messy processes such as transitions.” (Geels 2012, p. 474)
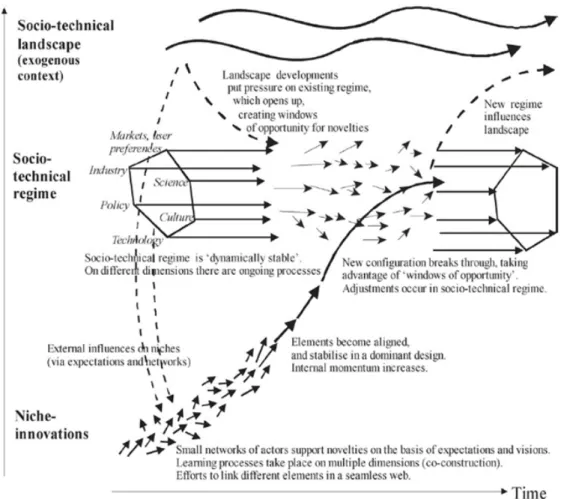
Figur I:1 provides an ideal-typical representation of how the three levels interact dynamically in the unfolding of socio-technical transitions. Although each transition is unique, the general dynamic is that transitions come about through the interaction between processes at different levels: (a) niche-innovations build up internal
momentum, (b) changes at the landscape level create pressure on the regime, and (c) destabilisation of the regime creates windows of opportunity for niche-innovations (Geels
2012).
Figure I:1 Multi-level perspective on transitions, Source: Geels 2012.
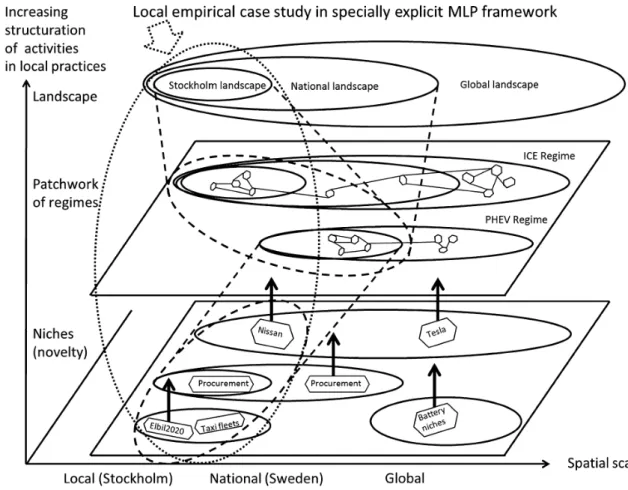
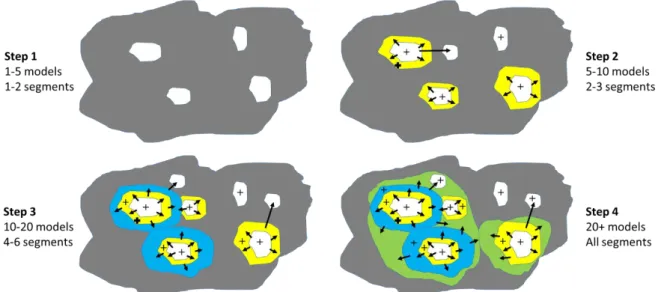
An example related to electromobility is a study of diffusion of EVs in Stockholm by Nykvist and Nilson (2014). They used the MLP framework developed by Geels (2002), c.f. figure I:1 and adapted it to a local scale with the result shown in figure I:2. They used a spatial scale on the x-axis and structuration of activities in local practises on the y-axis. The framework was then used to investigate three hypotheses,
concerning why the EV market in Stockholm has not developed. The three
hypotheses were (1) a lack of or poorly functioning niches, (2) a strong ICE regime and 3) the lack of economic incentives, policy direction and visions. They found
support for the niche and regime hypotheses and some but not conclusive supporting
evidence for the landscape hypothesis.
Figure I:2 Adapted MLP framework of Nykvist and Nilson (2014).
Norway being a highly successful EV market and a neighbouring country to Sweden makes it relevant to test the opposite three hypotheses on the case of Norway:
1. The niche hypothesis: The rapid development of EVs in Norway is the result of
well-functioning niches for EVs to expand in and from.
2. The regime hypothesis: The rapid development of EVs in Norway is the result of
a weak ICE regime in Norway
3. The landscape hypothesis: The rapid development of EVs in Norway is the result
of economic incentives, policy direction and visions at different scales. A central part of the framework of Geels (2012) is that destabilisation of the
established regime creates windows of opportunity for niche innovations. There is no guarantee that transitions succeed: niche-innovations may fail to build up sufficient momentum or suffer setbacks; or tensions in existing regimes may remain small so that ‘windows of opportunity’ for niche-innovations do not materialise (Geels 2012). A fourth hypothesis to be investigated is thus how exploitation of windows of opportunity may explain the rapid introduction of EVs:
4. The opportunity hypothesis: The rapid development of EVs in Norway is the
result of “windows of opportunity” opening up the established regimes. The perspective of this part of the report is national with the sociotechnical landscape split in two, one global and one national. The activities of the auto-industry, the European Union and activities in other countries is in the global
landscape we find national policies of transportation, pollution control and greenhouse gas emission reduction, as well as initiatives to support a Norwegian emerging EV industry in the early 2000s and the incentives for EVs.
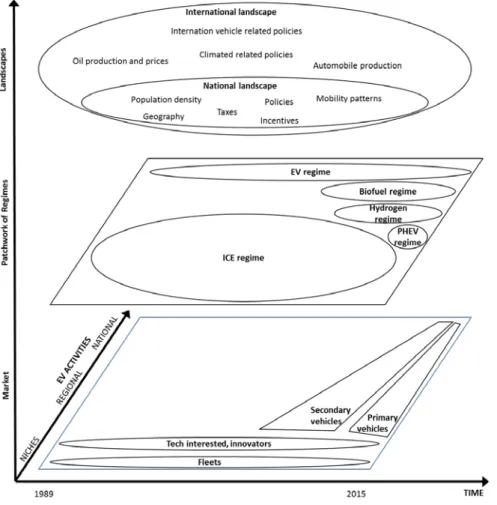
The proposed x-axis for the MLP framework is time as in Geels (2002). The y-axis shows the degree of structuration at different levels, while the z-axis is used for the spatial dimension using niches, regional and national as the three spatial levels. The EV activities at all levels will be discussed together with other competing
technologies, i.e. biofuels, hydrogen and PHEVs as these may have influenced the EV transition. Niches can be activities or sub markets based on usage patterns that can be geographically spread. The regional and national dimension is used to show the scale of EV development in Norway having now entered the main stream automotive market.
I:3 Methods
Norway is unique in being the first country where EVs have reached market shares above a few percent of new vehicle sales. This situation allows for the investigation of the four hypotheses using both market statistics and various policy documents from the actors in the investigation such as government white papers, settlements and decisions in the parliament, municipality actions and white papers from consumer and trade organisations as well as Non Governmental Organisations (NGOs). Being the most important ones, the vehicle manufacturers and importers can be studied by looking at the actions they have taken to respond to changes in their environment. Results from the surveys and interviews described in the chapter on common material in the beginning of the report have also been used.
I:4 Results
The Norwegian EV market development can be divided into four periods. 1989-1998, 1999-2002, 2003-2009 and 2010-2015. We will go through the niche, regime and landscape events in each of these phases. But first a brief look at some national characteristics of Norway that may influence EV developments.
I:4.1 National characteristics
Norway is an oil producing country with Norwegian companies being developers and operators of national oil fields, supported by a large supplier industry. These
companies are operating globally, selling the oil as a commodity on the world market. Statoil, the largest Norwegian oil producer, used to sell fuels in the Norwegian market. That business was separated out in 2010 and bought up by a Canadian company in 2012. No other companies are simultaneously involved in oil extraction business and the retail sales of fuels. The oil producing industry is thus not part of the ICE regime in Norway but the companies that sell fuel to consumers are. Norway is a large country in areas extending 2000 km north to south with a population of only 5 million people, owning 2.5 million passenger vehicles (SSB 2015a). The population density of 14/km2 is the second lowest in Europe
617 000 inhabitants. Bergen the second largest city have 260 000 inhabitants (SSB 2015). Small cities and the low population density is a challenge to establishing public transport alternatives to private car use. The climate is mild in the summer and cold in the winter with large variations. Topography is mostly hilly and a drive between some of the major cities will require the tackling of mountain passes with harsh winter conditions. In the inland winters can be very cold with temperatures of -20 to -30o C. On the coast the winter climate is not so cold, typically in the 0 to -10°C range. Driving range variability is thus large between summer and winter due to the need to heat the cabin and winter tyres with higher rolling resistance as well as higher resistive loads on the vehicle due to the low temperature. The fairly cool summers on the other hand puts less stress on the batteries which should last longer in Norway than in countries with hotter climates (Francfort & Shirk 2014).
The Norwegian transportation sector is heavily taxed. There are taxes on the registration of vehicles the first time as well as a yearly tax on vehicle ownership. A large number of roads are toll roads. Fuel taxes are also among Europe’s highest, and so is also the value added tax of 25%.
Norwegian speed limits are EV friendly, i.e. low. Most main roads have a limit of 80 km/h and most motorways 100 km/h (some have 110 km/h). The average annual mileage of vehicles is 13 000 km.
98% of Norwegian electricity is produced by hydroelectric power-plants (Ministry of Petroleum and Energy 2013). Electricity is abundantly available, pollution free, cheap and non-controversial compared with other countries. It is used for many purposes, including heating houses. Households have thus more electric power installed than in other countries in Europe.
Norway does not have any vehicle production apart from several unsuccessful attempts to start EV production. There is an industry selling parts to the auto industry in other countries. Norway has a large oil extraction industry and high national income from oil production. The sales of the petroleum products in the Norwegian market is, however, done by separate companies. There is no direct link between companies involved in oil extraction and the sales of Gasoline and Diesel in the Norwegian market. The small population of Norway may make it easier for stakeholders to identify and approach politicians and thus influence them. Numerous EV incentives have been introduced over the years. They are listed in table I:1 to provide the background for the sequential analysis of factors influencing the diffusion of EVs in Norway.
Table I:1 National incentives, policies and initiatives. Source: Figenbaum, Assum and Kolbenstvedt (2015).
Incentives Introduced Benefits for users
Fiscal incentives Reduction of purchase price/yearly cost gives competitive price Exemption from
registration tax
1990/1996 The tax is based on emission and weight. Example taxes on ICE vehicles: VW Up 3000 €. VW Golf: 6000-9000 €. The tax makes the vehicles competing with EVs more expensive
VAT exemption 2001 Vehicles competing with EVs are levied a VAT of 25% on sales price minus registration tax.
Reduced annual vehicle license fee
1996/2004 Three rates apply for private cars. EVs and hydrogen vehicles have the lowest rate of 52 € (2013-figures). Conventional vehicle rates: 360-420 €.
Reduced company car tax
2000 The tax on using a company car is lower for EVs. Most EVs are not company cars.
Direct subsidies to users – reducing usage costs and range challenges
Free toll roads 1997 Large impact when toll roads are expensive. In the Oslo-area the avoided costs are 600-1 000 €/year for commuters. Some places have tolls exceeding 2 500 €/year
Reduced rates on ferries
2009 Similar to toll roads avoiding costs for those using car ferries
frequently. Not important up to 2013, but the value of the incentive can be high in some areas.
Financial support for charging stations
2009 Reduces the economic risk for investors establishing charging stations. Contributes to reduced range anxiety and expand the EV market and get more EV miles out of every EV.
Financial support for fast charge stations
2011 More fast-charging stations become available increasing the EV miles driven and the total EV market including fleets. Fast charging does not void vehicle battery warranties.
Reduction of time costs and giving relative advantages
Access to bus lanes 2003/2005 EV users saves time driving to work in the bus lanes during rush hours. Very efficient, high value to user in regions with large rush-hour congestion. But only a limited number of vehicles can use the bus lanes. Can lead to increased vehicle ownership.
Free parking 1999 The benefit for users is to get a parking space where these are scarce or expensive and time saved looking for a space. Impact depends on how many spaces that are available.
I:4.2 Experimental niche activities between 1989-1998
Some small pioneers and enthusiasts started up niche electric vehicle activities around 1990. In 1989 the first EV was imported to Norway (Asphjell et al 2013). A company developed electric drive systems for VW. A few vehicles were built with this drive system of which four was taken into use in Norway (Ibid 2013, Figenbaum 1994). A small dealer/vehicles repair workshop started imports of the Danish mini EV Kewet Eljet from 1992. 43 Kewets was on the roads of Norway (Figenbaum 1994) in November 1993. The National Institute of Technology (TI) started testing EVs (Figenbaum 1993, 1994, 1995, 1997, 1998). The first market niches were fleets, mostly energy companies and municipalities testing the technology (Figenbaum 1994). All of these activities were established separately from the automotive industry regime that at the time showed little or no interest in manufacturing or selling EVs in Europe. An exception was a test production of 250 Citroën C15 in France (Arval 2010). Vehicle manufacturers were, however, evaluating various options, developing and testing some EVs for the Californian market. The ZEV mandate specified that a certain share of EVs had to be sold (California ARB 2015).
A small, separate EV regime parallel to the ICE regime was being established in Norway, independently of the traditional automakers, importers and dealers that were not taking an interest in EVs. The first attempts to establish an EV association
was initiated by the municipality of Oslo, EV actors, other industrial actors, local utilities and others (Asphjell et al 2013). By 1995 the association was founded in the beginning as a sort of a common interest stakeholder organisation that later evolved into a consumer organisation. The Norwegian government introduced the first EV incentive, the exemption from the vehicle/registration tax from 1990 to stimulate the usage and development of EVs (Ministry of Finance 1989). The exemption became permanent from 1996 (Ministry of finance 1995). From 1997 EVs were exempted from the toll roads of Oslo, a situation leading to exemptions on other toll roads in use or established later (Figenbaum & Kolbenstvedt 2013). From 1998 municipalities could offer free parking following a change to the national parking regulation
(Figenbaum & Kolbenstvedt 2013). These changes were induced by actors at the
landscape level such as municipalities, from actors of the EV regime under
establishment, NGOs, as well as the niche fleet users. They claimed that more
incentives were needed to sell EVs. As an example NGO drove their EV multiple times past the toll roads of Oslo without paying. They also parked on public streets without paying the parking fees. These activities led to substantial media coverage, putting pressure on the municipality of Oslo and the Norwegian Public Roads Administration to allow EVs to use the toll roads and park free of charge. The EV association and its members added to the pressure, and the combined efforts resulted in the introduction of the free parking and the free passing of toll roads incentives from 1997 and 1999.
At the Lillehammer winter Olympics in 1994 a small EV prototype made by the Norwegian company PIVCO demonstrated that EVs could operate in Norway’s winter climate (SNL 2015). The company developed the vehicle further. From 1995/96 a second-generation prototype was made and tested by Norwegian fleets (SNL 2015) and as a “station car” in California delivering last mile transport (CALSTART 1995). The company succeeded in getting investors on board for an industrialisation of the 2-seater EV. The factory opened in 1998 near Oslo with the company renamed Think. A month later the company got bankrupt (SNL 2015). In
Denmark Kewet went bankrupt leaving the Norwegian importer without vehicles to sell (Asphjell et al 2013).
In 1990 the Californian ZEV mandate included an obligation to sell 2% EVs from 1998 increasing to 5% in 2001 and 10% in 2003 (California ARB 2015). Expectations faded, and the mandate was postponed in 1996, leaving out requirements for 1998-2001 while keeping the 2003 target.
In the same timeframe the utility company Stavanger Energy, unable to get the Norwegian Peugeot importer to import Peugeot EVs, cut a deal directly with Peugeot in France (Figenbaum 2015). The result was that Peugeot EVs became available in the Stavanger area through the local Peugeot dealer. They also set up a small EV workshop in their premises to support the EV servicing in the region. In the region of Grenland (130 km southwest of Oslo) local investors, supported by a seed fund tasked with transforming the heavy industry based region to a more diversified base, started an EV leasing business, Miljøbil Grenland. In the beginning, Peugeot EVs were leased out as a result of a deal with the French utility company EdF (Asphjell et al 2013). These activities are illustrated in figure I:3, by a small overlap between the ICE regime and the EV regime under establishment, marking a partial assimilation of EVs by the incumbent ICE regime.
The competitive situation between EVs and gasoline vehicles in the late 1990’s as illustrated in figure I:3. EVs cost at the time twice as much as the small gasoline
vehicles they competed with. In addition the vehicles were mostly produced by unknown companies. The quality was not quite up to automotive standards, and a proper dealer network was not established. Although the Peugeot importer did import some vehicles, they were not too eager to sell them. The result was that the vehicles mostly were sold to fleets and enthusiasts that could take advantage of free parking or had much to save on the road-toll exemption.
Figure I:3 Sales prices of EVs in Norway compared with gasoline vehicles. EV prices are without all taxes according to the incentives. ICE vehicle prices include all registration taxes and VAT. Source: Taxnorway 2015, various webpages, news articles, historical sales material
The ICE regime seems to have accepted the EV incentives. At least they did not openly fight against them. Then again, they may not have felt threatened by the EV technology at the time.
I:4.3 The rise of the EV regime from 1999 to 2002
A few months after Think went bankrupt in October 1998, Ford Motor Company bought Think and industrialized the vehicle with sales starting in late 1999. Their main target was to deliver low-cost EVs to California to meet Fords ZEV mandates (Ford 2000). Their own internal EV project had experienced massive cost overruns with the resulting vehicle becoming too expensive to produce and sell (Figenbaum 2015). The Norwegian management at Think was tasked with developing the
Norwegian and European market (Ford 2000). Ford had expectations of deliveries to fleets owned by the Norwegian government (Asphjell et al 2013). With Ford owning Think, new pressure came for more incentives from the now more influential EV regime partly assimilated by the auto industry.
A second EV producing company was under establishment in Oslo from the early 2000s. The importer of the Danish Kewet bought the bankruptcy estate from
Denmark, moved the production equipment to Oslo and started a small scale production.
These two initiatives pointed at a possible emerging cluster of EV production and services in Norway, a country with no prior vehicle production. Politicians were now receptive to arguments about the establishment and expansion of EV production in Norway, introducing new incentives such as exemption from VAT, lowering EV prices with 20% from 2001, and reduced company car taxation from 2000
(Figenbaum & Kolbenstvedt 2013). EVs got specific EL number plates from 1999 to facilitate the control of admission to local incentives such as free parking and free passing of toll roads. In the region of Grenland, Miljøbil Grenland expanded its leasing business reaching 150 vehicles in 2000 and from 2002 they started selling EVs (Asphjell et al 2013).
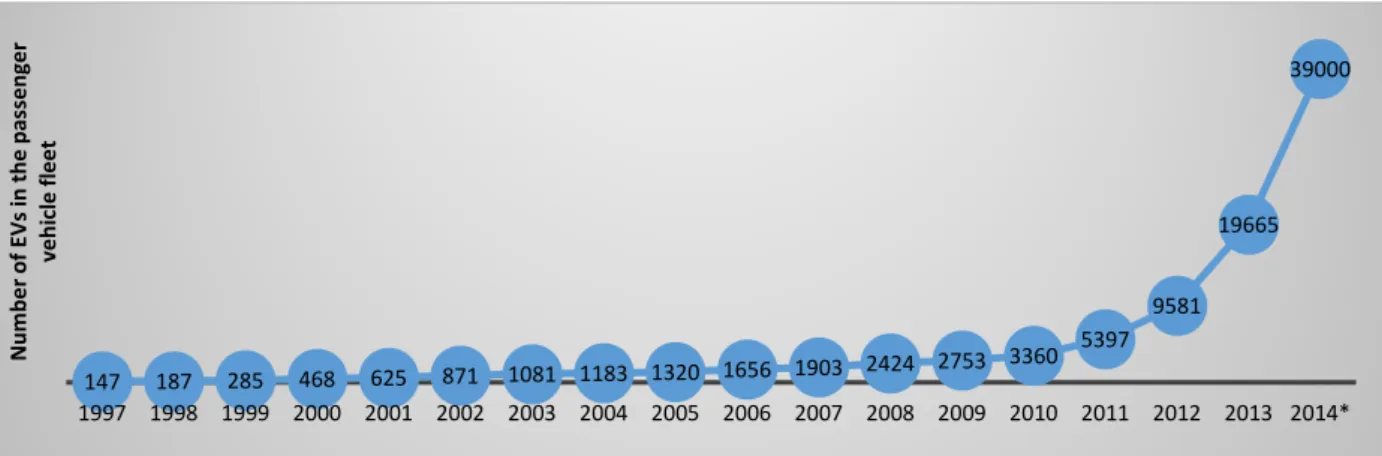
The competitive situation of EVs improved substantially as the result of the exemption from VAT introduced in July 2001, seen as a price drop from 2000 to 2001 in figure I:3. Sales, however, remained modest due to limited supply of vehicles as seen by the slow increase in the EV fleet shown in figure I:4.
In France, the car manufacturers with government support commercialized EVs with Ni-Cd batteries from 1995-2002 when the French automakers launched a few EV models (Arval 2010). Renault also launched an EV in the same period. Total production of these EVs was less than 10 000.
Figure I:4 EV fleet in Norway. 2014 estimate based on sales up to November. Source: Asphjell et al 2013 and OFVAS 2015.
I:4.4 The EV regime muddles through from 2003 to 2009
From 2003 and onwards there were several setbacks in the EV development.
All French car manufacturers stopped producing EVs. Poor sales, changing priorities and Cadmium being gradually banned from use in batteries may have contributed to the decision. The California regulators amended the ZEV regulation in 2001 allowing PHEVs to fulfil 8% of the 10% of the 2003 ZEV requirement. A lawsuit prohibited the enforcement of the 2001 amendment resulting in further relaxation of the mandate in 2003 and automakers could abandon electric vehicles altogether. Ford re-Think-ed their EV strategy. California relaxed the ZEV mandates and Ford decided they no longer needed Think (Figenbaum 2015, Asphjell et al 2013). The
147 187 285 468 625 871 1081 1183 1320 1656 1903 2424 2753 3360 5397 9581 19665 39000 1997 1998 1999 2000 2001 2002 2003 2004 2005 2006 2007 2008 2009 2010 2011 2012 2013 2014* N um ber o f EV s i n th e p assen ger veh ic le f leet
company was put out for sale in late 2002 with the takeover by a new owner in 2003. Within a couple of years Think went into receivership as the owner was unable to get production going. Kewet lost its type approval as the end date of the approval expired. The Norwegian company resorted to redesign it to a lower vehicle class, a light weight 4 wheel “motorcycle” with less demanding type approval.
The EV market was kept alive by enthusiasts in the EV regime importing second hand EVs (Aspjell et al 2013) made by Peugeot, Citroën and Renault between 1998 and 2003. These vehicles were abandoned by their original owners as other countries terminated EV activities and incentives. Think vehicles that had been exported earlier could also be reimported to Norway and sold to private consumers. Some of them were saved from crushing in the US as Ford when bailing out of Think terminated leases and recalled the vehicles (Asphjell et al 2013).
In 2003 the Norwegian Public Roads Administration intended to ban minibuses from the bus lane. These minibuses was bought by commuters to avoid the rush hour delays. From 2003 the bus lanes were opened for EV owners in a test area consisting of Oslo and the surrounding municipalities (Figenbaum & Kolbenstvedt 2013) after intense lobbying from the EV regime. Minibuses already in use could continue using the bus lanes until finally being ousted from 2009.
During the same time period there was a steady increase in the establishment of toll roads around cities and on the main roads. These toll roads were free of charge for EV owners. Unfortunately, the Norwegian EV producers were not in a position to take full advantage of this market. Think was then not producing EVs, and the production of Kewet’s was only about 100-200 vehicles per year. The Kewet was sold at a price comparable to the smallest 4-seater gasoline vehicles available in the market, c.f. figure I:3.
Think was re-established in 2006 by Norwegian investors, later with support from large international investment funds. A new Think model emerged in 2008 with production aimed at starting up in 2009. The company stumbled once again in the final industrialisation phase in the wake of the financial crisis of 2008-2009. The company managed to secure funds eventually, but the production was then moved to Valmet in Finland on a contract basis. According to Asphjell et al (2013), the
Norwegian investment fund Investinor required an automotive actor to get involved in the project as a requirement for investing in the company. Having a long
experience as a contract producer of vehicles, Valmet became a shareholder of Think. The production was moved to Valmets premises in Finland. At the same time Kewet re-emerged with the new Buddy-model. A new major incentive was
introduced, the introduction of reduced ferry rates from 2009. Things started looking rosy for the EV regime. The price of the Think vehicle, with either Li-Ion or Na-NiCl2 batteries, was, however, very high at launch, roughly three times that of the smallest gasoline vehicles, c.f. figure I:3.
Having problems obtaining EVs for leasing, Miljøbil Grenland decided to attempt to establish an EV production based on gliders (vehicles taken off the assembly line prior to the installation of the motor and drive system). First the idea was to use Smart vehicle gliders, but they did not manage to get the permission to do so. The focus shifted to gliders from the Indian vehicle producer TATA, and a prototype was made. Eventually, the company was bought by Tata which had the intention to start up EV production in Grenland. Tata went so far as to invest in an establishment of a battery production facility in Grenland as a precursor to establishing EV production.