Progressive Multiple Sequence Alignments from Triplets
Matthias Kruspe
1and Peter F. Stadler
∗1,2,3,41
Bioinformatics Group, Department of Computer Science and Interdisciplinary Center for Bioinformatics, University of Leipzig, H¨artelstraße 16-18, D-04107 Leipzig, Germany
2
Fraunhofer Institut f¨ur Zelltherapie und Immunologie (IZI), Deutscher Platz 5e, D-04103 Leipzig, Germany 3
Institute for Theoretical Chemistry, University of Vienna, W¨ahringerstraße 17, A-1090 Wien, Austria 4
Santa Fe Institute, 1399 Hyde Park Rd., Santa Fe, NM 87501
Email: Matthias Kruspe - [email protected]; Peter F. Stadler∗- [email protected]; ∗Corresponding author
Abstract
Motivation:
The quality of progressive sequence alignments strongly depends on the accuracy of the individual pairwise alignment steps since gaps that are introduced at one step cannot be removed at later aggregation steps. Adjacent insertions and deletions necessarily appear in arbitrary order in pairwise alignments and hence form an unavoidable source of errors.
Idea:
Here we present a modified variant of progressive sequence alignments that addresses both issues. Instead of pairwise alignments we use exact dynamic programming to align sequence or profile triples. This avoids a large fractions of the ambiguities arising in pairwise alignments. In the subsequent aggregation steps we follow the logic of the Neighbor-Net algorithm, which constructs a phylogenetic network by step-wisely replacing triples by pairs instead of combining pairs to singletons. To this end the three-way alignments are subdivided into two partial alignments, at which stage all-gap columns are naturally removed. This alleviates the “once a gap, always a gap” problem of progressive alignment procedures.
Results:
The three-way Neighbor-Net based alignment programaln3nnis shown to compare favorably on both protein sequences and nucleic acids sequences to other progressive alignment tools. In the latter case one easily can include scoring terms that consider secondary structure features. Overall, the quality of resulting alignments in general exceeds that of clustalwor other multiple alignments tools even though our software does not included heuristics for context dependent (mis)match scores.
Availability:
The Software is freely available for download fromhttp://www.bioinf.uni-leipzig.de/Software/aln3nn.
Contact:
{matthias,studla}@bioinf.uni-leipzig.de
1
Introduction
High quality multiple sequence alignments (MSAs) are a prerequisite for many applications in
bioinformatics, from the reconstruction of phylogenies and the assessment of evolutionary rate variations to gene finding and phylogenetic footprinting. A large part of comparative genomics thus hinges on our ability to construct accurate MSAs. Since the multiple sequence alignment problem is NP hard [Wang & Jiang, 1994] with the computational cost growing exponentially with the number of sequences, it has been a long-standing challenge to devise approximation algorithms that are both efficient and accurate. These approaches can be classified into progressive, iterative, and stochastic alignment algorithms. The most widely used tools such asclustalw[Thompsonet al., 1994] andpileuputilize the progressive method that was at first introduced in [Hogeweg & Hesper, 1984, Feng & Doolittle, 1987]. This approach makes explicit use of the evolutionary relatedness of the sequences to build the alignment. The complete multiple sequence alignment of the given sequences is calculated from pairwise alignments of previous aligned sequences by following the branching order of a pre-computed “guide” tree, which reflects (at least approximately) the evolutionary history of the input sequences. It is typically reconstructed from pairwise
sequence distances by some clustering method such as Neighbor-Joining [Saitou & Nei, 1987] or UPGMA [Sokal & Michner, 1958].
Progressive sequence alignments, while computationally efficient, suffer from two major shortcomings. First, they are of course not guaranteed to find the optimal alignment. Pairwise comparisons necessarily utilize only a small part of the information that is potentially available in the complete data set. In particular, the relative placement of adjacent insertions and deletions leads to score-equivalent alignments among which the algorithm chooses one by means of a pragmatic rule (e.g. “Always make insertions before deletions”). At a later aggregation step, when profiles are aligned to sequences or with each other, these alternative are no longer equivalent. Secondly, in contrast to other techniques, there is no mechanism to identify errors that have been made in previous steps and to correct them during later stages.
In this contribution we present a novel approach to progressive sequence alignment that alleviates both shortcomings at the expense of utilizing an exact algorithm to compute alignment of sequence and profile triples. Instead of using a single guide tree, we follow here the logic of phylogenetic networks as
constructed by the Neighbor-Net algorithm [Bryant & Moulton, 2002] which calls for an aggregation step that constructs pairs from triples. As this requires us to subdivide 3-way alignments into pairs of
alignments, it provides a chance for the removal of erroneously inserted gaps at later aggregation steps. The contribution is organized as follows: In the following section we outline the algorithms aspects of our approach. Furthermore we describe a straightforward way of incorporating RNA secondary information. Section 3 summarizes benchmark data in comparison to other multiple alignment tools. We conclude with a brief discussion of future improvements.
2
Methods
2.1 Dynamic Programming
The basic dynamic programming scheme for pairwise sequence comparison, known as the
Needleman-Wunsch algorithm [Needleman & Wunsch, 1970] requires quadratic space and time. It easily translates to a cubic space and time algorithms for three sequences. Biologically plausible sequence alignment, however, require the use of non-trivial gap cost functions. While cubic time algorithms are available for arbitrary gap costs [Dewey, 2001], affine gap costs (with a much higher penalty for opening a new gap than for extending an existing one) in general yield good results already. In this contribution we therefore use an affine gap cost model. Gotoh’s algorithm solves this problem with quadratic CPU and memory requirements for two sequences [Gotoh, 1982]. The same author also described a dynamic
programming scheme for the alignment of three sequences with affine gap costs [Gotoh, 1986] that requires
O(n3
) time and space, which we use here with minor modifications.
LetA,B, andC denote the three sequences. We useAi,Bj, and Ck to refer to theith,jth, andkth
position inA, B, andC, respectively, counting from 1. As usual, ’-’ denotes the gap character. Scores for the alignment of two or three non-gap characters are denoted byS(α, β) andS(α, β, γ), resp. Gap penalties are determined from gap open (go) and gap extensions (ge) scores. The best score of the alignments of the
prefixesAi,Bj, and Ck is denoted byM(i, j, k) if the residues (Ai, Bj, Ck) are aligned;Ixy(i, j, k) the best
score given that (Ai, Bj,−) is the last column of the partial alignment, andIx(i, j, k) the best score given
that the last column is of the form (Ai,−,−). Ixz(i, j, k),Iyz(i, j, k),Iy(i, j, k), andIz(i, j, k) are defined
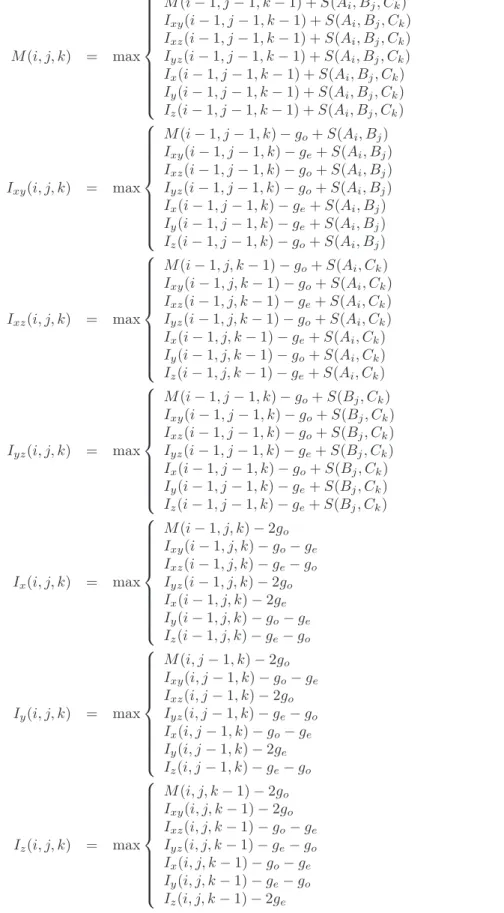
analogously. It is not hard to verify that these quantities must satisfy the recursions summarized in Fig. 1. While the algorithm would in principle allow us to use arbitrary three residue substitution scoresS(a, b, c) as described by [Konagurthuet al., 2004], we restrict ourselves to the sum-of-pairs model
S(a, b, c) =S(a, b) +S(a, c) +S(b, c). As in the case of pairwise sequence alignments, the recursions immediately generalize to alignments of profiles so that a single sequence becomes a special case of a profile. Match and gap scores are simply added up over all triples of sequences, one from each profile. The resource requirements of this algorithm, in particular the cubic memory consumption, are acceptable only for relative small sequence lengthsneven on modern workstations. Several approaches have been explored in the past to reduce the search space so that long sequences can be dealt with, see e.g. [Myers & Miller, 1988, Lipmanet al., 1989, Gupta & Schaffer, 1995]. We utilized here the Divide-&-Conquer
approach described by [Stoye, 1997] to limit both space and time requirements. Input sequences that exceed a given threshold lengthlare subsequently subdivided into smaller sequences until the length criterion is fulfilled. The partial sequences are aligned separately and the emerging alignments are concatenated afterward. The result is an approximate solution of the global multiple sequence alignment problem. The choice of the threshold length depends on sequence properties and the available amount of memory and CPU resources. For the following simulations we have chosen a length ofl= 150. The methods described by [Myers & Miller, 1988, Lipmanet al., 1989] are known to produce optimal alignments but are much harder to implement.
2.2 Alignment order
The order in which sequences and profiles are aligned has an important influence on the performance of progressive alignment algorithms. In programs that are based on pairwise alignments such asclustalwor
M(i, j, k) = max M(i−1, j−1, k−1) +S(Ai, Bj, Ck) Ixy(i−1, j−1, k−1) +S(Ai, Bj, Ck) Ixz(i−1, j−1, k−1) +S(Ai, Bj, Ck) Iyz(i−1, j−1, k−1) +S(Ai, Bj, Ck) Ix(i−1, j−1, k−1) +S(Ai, Bj, Ck) Iy(i−1, j−1, k−1) +S(Ai, Bj, Ck) Iz(i−1, j−1, k−1) +S(Ai, Bj, Ck) (1) Ixy(i, j, k) = max M(i−1, j−1, k)−go+S(Ai, Bj) Ixy(i−1, j−1, k)−ge+S(Ai, Bj) Ixz(i−1, j−1, k)−go+S(Ai, Bj) Iyz(i−1, j−1, k)−go+S(Ai, Bj) Ix(i−1, j−1, k)−ge+S(Ai, Bj) Iy(i−1, j−1, k)−ge+S(Ai, Bj) Iz(i−1, j−1, k)−go+S(Ai, Bj) (2) Ixz(i, j, k) = max M(i−1, j, k−1)−go+S(Ai, Ck) Ixy(i−1, j, k−1)−go+S(Ai, Ck) Ixz(i−1, j, k−1)−ge+S(Ai, Ck) Iyz(i−1, j, k−1)−go+S(Ai, Ck) Ix(i−1, j, k−1)−ge+S(Ai, Ck) Iy(i−1, j, k−1)−go+S(Ai, Ck) Iz(i−1, j, k−1)−ge+S(Ai, Ck) (3) Iyz(i, j, k) = max M(i−1, j−1, k)−go+S(Bj, Ck) Ixy(i−1, j−1, k)−go+S(Bj, Ck) Ixz(i−1, j−1, k)−go+S(Bj, Ck) Iyz(i−1, j−1, k)−ge+S(Bj, Ck) Ix(i−1, j−1, k)−go+S(Bj, Ck) Iy(i−1, j−1, k)−ge+S(Bj, Ck) Iz(i−1, j−1, k)−ge+S(Bj, Ck) (4) Ix(i, j, k) = max M(i−1, j, k)−2go Ixy(i−1, j, k)−go−ge Ixz(i−1, j, k)−ge−go Iyz(i−1, j, k)−2go Ix(i−1, j, k)−2ge Iy(i−1, j, k)−go−ge Iz(i−1, j, k)−ge−go (5) Iy(i, j, k) = max M(i, j−1, k)−2go Ixy(i, j−1, k)−go−ge Ixz(i, j−1, k)−2go Iyz(i, j−1, k)−ge−go Ix(i, j−1, k)−go−ge Iy(i, j−1, k)−2ge Iz(i, j−1, k)−ge−go (6) Iz(i, j, k) = max M(i, j, k−1)−2go Ixy(i, j, k−1)−2go Ixz(i, j, k−1)−go−ge Iyz(i, j, k−1)−ge−go Ix(i, j, k−1)−go−ge Iy(i, j, k−1)−ge−go Iz(i, j, k−1)−2ge (7)
Figure 1: Dynamic programming recursions for three-way alignments with affine gap costs. The empty alignments are initialized as M(0,0,0) = 0 and I..(0,0,0) = 0. The boundaries of the cubic tables are
initialized using the recursions above with the understanding that alternatives with negative indices are ignored.
Alignment Three−Way Splitting Process Sequence B Sequence C Alignment ABC Sequence A Alignment B’’C Alignment AB’
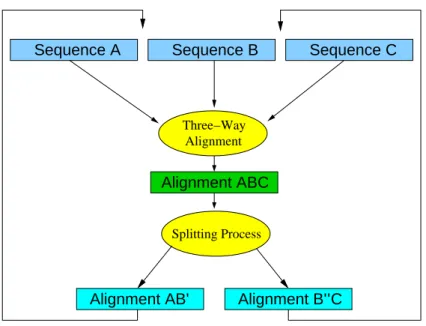
Figure 2: The three sequences/alignmentsA,B, andCare aligned simultaneously resulting in the alignment ABC. This alignment is divided into the two new alignmentsAB andBC. Duplicated sequences inB are deleted. The process continues until all sequences or alignments are aligned.
pileup, binary guide trees, which encapsulate at least an approximation to the phylogenetic relationships of the input sequences, are used to determine the alignment order. The input sequences form the leaves of this tree; each interior node corresponds to an alignment, so that the root of the guide tree represents the desired multiple alignment of all input sequences.
Instead of a phylogenetic treealn3nnuses a phylogenetic network to calculate the alignment order. The network is constructed using the Neighbor-Net (Nnet) approach, a distance based clustering algorithm that can be seen as a proper generalization of Neighbor-Joining [Bryant & Moulton, 2002, Bryant & Moulton, 2004]. TheNnetalgorithm can be described as follows: The input sequences are represented as nodes that are all disconnected in the beginning. In each aggregation step,Nnetselects two nodes using a specific selection criterion such as minimal distance. In contrast to Neighbor-Joining, the two nodes are not paired immediately. Instead,Nnetwaits until a node has been paired up a second time. Then the corresponding three linked nodes are replaced by two new linked nodes. As in the more familiar NJ algorithm, the distances of the newly introduced nodes to the remaining “actives” node are computed as a linear
combination of the distances of the nodes prior to aggregation. The entire procedure is repeated until only three active nodes are left. Then the agglomerated nodes are expanded to produce the planar splits graph that represents the desired phylogenetic network. The aggregation procedure of theNnetalgorithm
implicitly defines a circular split system, which can be shown to be consistent in the sense that for any distance matrix that is a linear combination of split metrics deriving from a circular split system,Nnet
recovers the original circular split system, see [Bryant & Moulton, 2007] for the mathematical details. It has been observed that phylogenetic distance data are often circular or at most mildly non-circular, see e.g. [Bandelt & Dress, 1992, Huson, 1998, Wetzel, 1995]. In other words, this class of phylogenetic networks very well represents distance data that obtained from pairwise sequence alignments.
In our picture, each node agglomeration corresponds to a triplet alignment. The alignment order is therefore given byNnet’s order of node fusions. Nnethowever replaces a triple by a pair. This suggests to split the three-way alignment again into a pair of alignments, see Fig. 2. InNnet, a node agglomeration occurs when one of the three involved nodes (B) has two neighbors, while the other two (AandC) have only a single one. Following this rule, we choose to split the alignmentABC such the sequences contained inB are distributed between two subsetsB′ andB′′ so as to maximize the scores of partial alignments
AB′ and B′′C. In practice, we start with partial alignmentsAB andBC obtained fromABC. Then each
of the duplicatedB sequences is removed from eitherABorBC using a greedy rule, i.e., we remove the copy that yields the smaller average score contribution. Of course, other division strategies are conceivable. For example, one could subdivide the alignment along the longest internal edge of its Neighbor-Joining tree, or along non-trivial splits that are optimal according to other criteria. At this stage, one can either approximate the profile distances to all other intermediate alignments usingNnet’s distance recursions (as implemented innn3aln), or one could recompute these distances based on the alignments.
The division of theABC alignment intoAB′ andB′′Cfrequently results in all-gap columns in the two
parts. These are removed in order to recover valid MSAs. This constitutes a mechanism by which gaps introduced in early agglomeration steps can be removed again in later steps. This removal is guided by the increasing amount of information that is implicit in profiles composed of a larger number of sequences. Our software keeps track of gaps that appear in intermediate alignments but that are not present in the final result to demonstrate that gap removal is not a rare phenomenon in practice.
2.3 Complexity
The dynamic programming algorithm for the three-way alignment requiresO(n3
) space and time (wheren is length of the input sequences). Thus the alignment of allN sequences takesO(N n3
) time. If the Divide-&-Conquer approach with the cutoff lengthl is used, the complexity of the alignment of one triplet can be reduced toO(n2
+l3
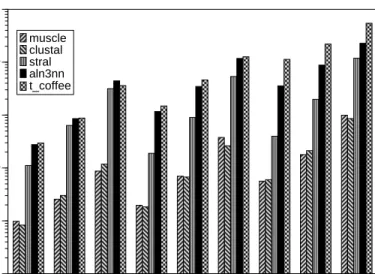
3x100 3x200 3x400 5x100 5x200 5x400 10x100 10x200 10x400
number and length of sequences 10-3 10-2 10-1 100 101 102
computing time [sec]
muscle clustal stral aln3nn t_coffee
Figure 3: Running time in seconds for calculation of one alignment consisting of various sequences of different length on a semi-logarithmic plot for muscle, clustalw, stral, aln3nn, and t coffee. The alignment programms are invoked all with their standard parameter settings.
(see [Stoye, 1997]) plus the space required for aligning the remaining (sub)sequences of length at mostl. The time complexity is given byO(n2
+nl2
). The termn2
results from the time that is needed to calculate the additional cost matrices plus the time to search for the optimal slicing positions. The termnl2
comes from the alignment of the triplet itself. We assume for simplicity that all sequences have the same length n=l·2D (D = 1,2, ...is the number of dividing levels) and all slicing positions are located exactly at the
midpoint of the (sub)sequences. The total time complexity of the alignment is thereforeO(N n2
+N nl2
). The determination of the alignment order runs inO(N3
) time andO(N) space. The calculation of the necessary pairwise distances takesO(N2
n2
) time andO(n2
) space. Typical running times for various sets of alignments with different numbers and lengths of sequences are shown in Figure 3. These are taken on an Intel P4 3.0GHz equipped with 2GB RAM running Fedora Core 5. The full source code of the program package is available free for academic users. The code will compile and run well on any machine with a full ANSI conforming C compiler and an installedVienna RNA package[Hofackeret al., 1994, Hofackeret al., 2002] for the RNA specific scoring function. TheVienna RNA packagecan be obtained from
http://www.tbi.univie.ac.at/∼ivo/RNA. Thealn3nnsource code and documentation is available from
2.4 Alignments of Structured RNAs
Recent discoveries of a large number of small RNAs with distinctive secondary structures has prompted the development of specialized multiple alignment programs for this class of molecules. Most of these
approaches make explicit use of structural alignment techniques such as tree editing (MARNA [Siebert & Backofen, 2005]), tree alignments (RNAforester[H¨ochsmannet al., 2003]), or variants of the Sankoff algorithm [Sankoff, 1985] (foldalign[Havgaardet al., 2005],dynalign[Mathews & Turner, 2002],
locarna[Willet al., 2007]). In contrast, “structure enhanced” approaches utilize standard sequence alignment algorithms but incorporate modified match and mismatch scores designed to take structural information information into account [Bonhoefferet al., 1993]. TheSTRALprogram [Dalliet al., 2006] recently has demonstrated that such “structure enhanced” alignments perform comparable to true structural alignments in many cases. We have thus included in our software the possibility to use RNA secondary structure annotation as additional input with nucleic acid alignments.
We use McCaskill’s algorithm [McCaskill, 1990] (as implemented in theVienna RNA package) to compute the matrix of equilibrium base pairing probabilitiesPij for each input sequence and derive for each
sequence position the probabilitiesp1
(i) =P
j<iPij,p2(i) =Pj>iPij, andp3(i) = 1−p1(i)−p2(i) that
sequence positioniis paired with a positionj < i, a positionj > i, or that it remains unpaired, resp. The px(i)-values are used as structure annotation. For a pair of annotated input sequencesAandB we define
structural score contributions for positionsiand jby Sstruct(iA, jB) = p p1( iA)·p1(jB) + p p2( iA)·p2(jB) + p p3(
iA)·p3(jB) This rewards bases that share
similar structural properties. The total (mis)match score is the weighted sum of the sequence score and the structure score using the equationSfinal(iA, jB) =ψ·Sseq(iA, jB) + (1−ψ)·Sstruct(iA, jB) with a
balance termψthat measure the relative contribution of sequence and structure similarity. In the case of very similar sequence one should useψ≈1 since inaccuracies in the structure prediction are more harmful than the extra information in this case. Conversely, very dissimilar sequences have to be aligned with a score dominated by the structural component.
3
Results
3.1 Pairwise versus Three-Way Alignments
In order to test whether the additional computational costs of explicit three-way alignments is worth while, we generated sets of artificial sequences using theROSEpackage [Stoyeet al., 1998] and compared the quality of aln3nnalignments to standard progressive alignments of three sequences using t coffee. To
0.00 0.01 0.03 0.05 0.07
indel probability
0.6 0.8 1.0 1.2 1.4 1.6sum of pairs score
three-way (aln3nn) pairwise (t_coffee) 3 Sequences 0.00 0.01 0.03 0.05 0.07
indel probability
0.6 0.8 1.0 1.2 1.4 1.6sum of pairs score
three-way (aln3nn) pairwise (t_coffee)
10 Sequences
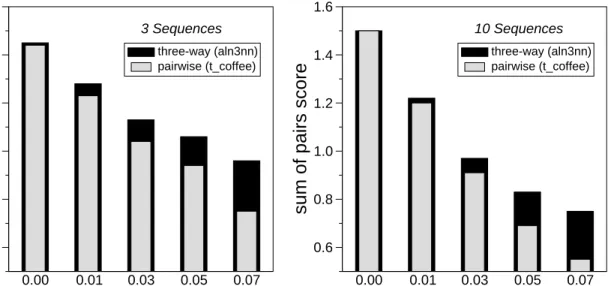
Figure 4: Comparison of alignments scores of aln3nn with progressive pairwise alignments for simulated data sets for different in/del rates. Data are averages over 100 simulated sets of 3 and 10 related nucleotide sequences, resp., with an average length of 100nt. The sequences in each set are derived using ROSEfrom a randomly generated root sequence following the order of a given phylogenetic tree with randomly chosen branch lengths using a constant mean substitution frequency of 0.13 across the dataset. The following scoring model was used: Match score 1.9, mismatch 0.0 (as in the IUB DNA scoring matrix), gap open 2.0, gap extensions 0.5).
this end we used the same scoring model inaln3nnandt coffeeso that the resulting scores can be compared directly. We report the main pairwise alignment score divided by the length of the alignment as “pw-score”. Figure 4 shows that, as expected, the alignment score decrease quickly with increasing in/del probabilities. At the same time, the advantage of the three-way alignments increases both for the
alignment of three and ten sequences. In the case of three sequences,aln3nncomputes the exact solution, whilet coffeeuses multiple pairwise alignments to include more information than a simple pairwise progressive alignment by modifying the pairwise scoring functions base of the consistency of a collection of pairwise alignments. Clearly, these heuristics cannot fully compensate for shortcomings of the initial pairwise alignments. The inclusion of more pairwise alignments int coffeeheuristic does not seem to have a strong effect, at least on artifically generated sequences.
Somewhat surprisingly, three-way alignments also provide a small but significant gain in alignment score even in the cases where the simulated data correspond to a correct alignment that is entirely gap free. This effect is noticable in particular in comparison with “straight” pairwise progressiveclustalwalignments, in which no attempt is made to correct for problems in the initial pairwise alignments (Supplemental Figure
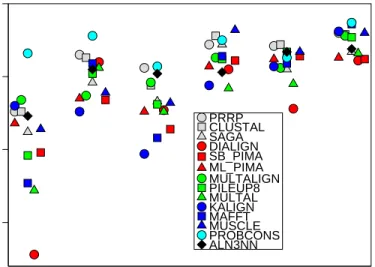
20-40% SHORT 20-40% MEDIUM 20-40% LONG >35% SHORT >35% MEDIUM >35% LONG 0.85 0.90 0.95 1.00
BAli Score
PRRP CLUSTAL SAGA DIALIGN SB_PIMA ML_PIMA MULTALIGN PILEUP8 MULTAL KALIGN MAFFT MUSCLE PROBCONS ALN3NNFigure 5: Comparison of different alignment programs on severalBAliBASEbenchmark data sets. Shown is an example of the Reference 1 set for mean sequence identities of 20−40% as well as>35% encompassing short, medium and long sequences. Other datasets show similar results.
S1). This introduction of spurious gaps is well-known problem with pairwise nucleic acid alignments.
3.2 Protein Alignments
Thealn3nnsoftware is designed for the alignment of both amino acid and nucleic acid sequences. For proteins, the current implementation used three types of substitution matrices: BLOSUM, PAM and GONNET. The algorithm chooses the best suiting matrix of the given type according to sequence identity. The user can also specify a certain substitution matrix explicitly.
We used benchmark data sets and alignments of various alignments tools fromBAliBASE[Thompsonet al., 1999] to asses the quality of thealn3nnalignments. To assure statistical robustness, we utilized the median BAliBASE score for each sequence set as a measurement for alignment quality, Figure 5. Our software does not employ any heuristic rules to alter scoring parameters based on local sequence context or properties of partial profiles. Nevertheless,aln3nncompares well with other common alignment programs, indicating that a simple affine scoring model is sufficient; onlyProbCons[Doet al., 2005], a combination of probabilistic modeling and consistency-based alignment techniques specialized for protein alignments performs systematically better. Elaborate scoring heuristics thus essentially seem to
5S rRNA tRNA U5 gII-Intron miRNA snoRNA 0.0 0.2 0.4 0.6 0.8 1.0 1.2
SCI
reference clustalw MARNA STRAL mafft t_coffee muscle aln3nn5S rRNA tRNA U5 gII-Intron 0.0 0.2 0.4 0.6 0.8 1.0
SPS
referenceclustalw MARNA STRAL mafft t_coffee probcons muscle aln3nnFigure 6: Comparison of alignment accuracies of various multiple sequence alignment tools on BRaliBase
test sets. Both the median structure conservation index, SCI, (l.h.s. panel) and the median BAliBase SP score, SPS, (r.h.s. panel) is shown for Group II introns, 5S rRNA, tRNA, and U5 spliceosomal RNA. For the miRNA and snoRNA data set no reference alignments are available inBRaliBase, hence only the SCI can be evaluated. The relative weight of sequence and structure scores is set toψ= 0.5 for all data sets. 3.3 RNA Alignments
RNA sequences often evolve much faster than their secondary structure. This is true in particular for many of the non-coding RNA genes, including ribosomal RNAs, tRNAs, and spliceosomal RNAs. In these cases, alignment quality can be increased dramatically by including structural information.
In Fig. 6 we compare structure enhancedaln3nnalignments with pure sequence alignments (clustalw,
muscle[Edgar, 2004],t coffee[Notredameet al., 2000], pair-wise structure enhanced alignments (STRAL,
mafft[Katohet al., 2002]) and true structural alignments (MARNA[Siebert & Backofen, 2005]) as well as the manually curated reference alignments forRfam(v.5.0) [Griffiths-Joneset al., 2005]. We use six diverse families of RNA data sets from theBRaliBasethat have been used in an extensive benchmark study of RNA multiple alignment algorithms [Gardneret al., 2005]: Group II introns, 5S rRNA, tRNA, and U5 spliceosomal RNA. In addition, we use the data sets compiled by Jana Hertel for training SVMs that recognize microRNAs [Hertelet al., 2006] and snoRNAs [Hertelet al., 2007]. For each family we selected approximately 100 alignments, each consisting of five sequences encompassing a range of sequence distances.
As in [Gardneret al., 2005], we used the structure conservation index (SCI) [Washietlet al., 2005] to assess the quality of the calculated alignments. The SCI is defined as the ratio of consensus folding energy of a set of aligned sequences (calculated using theRNAalifoldprogram [Hofackeret al., 2002]) and average
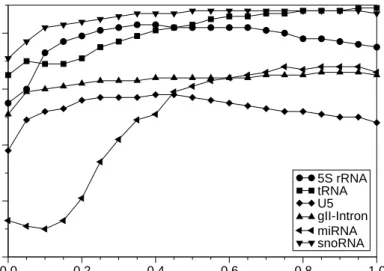
0.0 0.2 0.4 0.6 0.8 1.0
ψ
0.0 0.2 0.4 0.6 0.8SCI
5S rRNA tRNA U5 gII-Intron miRNA snoRNAFigure 7: Impact of the balancing parameter ψ on SCI mean values for different sets of RNA sequences. ψ= 0 fully weights the structure whereasψ= 1 weights the sequence.
unconstrained folding energies of the individual sequences. The SCI is close to 0 for structurally divergent sequences and close to 1 for correctly aligned sequences with a common fold. Values larger than one indicate a perfectly RNA structure which is additionally supported by compensatory as well as consistent mutations that preserve the common structure. The benchmark study [Gardneret al., 2005] established that the SCI is an appropriate measure for RNA alignment quality when the sequences are known to have a common fold, since decreased values of the SCI can be attributed to alignment errors. For the four of the six test sets with reference alignments we also computed theBAliBaseSP score (SPS), which directly measure the similarity of two alignments. For all computations we used a fixed tradeoff between sequence and structure scores ofψ= 0.5.
We find thataln3nnproduces high quality alignments of structured RNAs that are at least competitive with the other methods, including computationally very expensive structure-based methods. In particular, no other program systematically outperformsaln3nnin terms of alignment quality according to either the SCI or the SPS. Interestingly,aln3nnachieves significantly higher SCI values than even the reference alignment on the 5S rRNA data set.
Not surprisingly, the performance of structure enhanced alignments depends on the proper weighting of sequence and structure information. Figure 7 shows the influence of the parameterψon the SCI values for the given RNA sequences. As expected the SCI decreases if structural information is completely ignored (ψ= 1). On the other hand, ignoring the sequence information (ψ= 0) yields even worse results. The
reason is that RNA secondary structure prediction has limited accuracy so that alignments based on predicted structures for individual sequences are based on very noisy data [Bonhoefferet al., 1993, Hofacker
et al., 2002]. The impact of theψ parameter varies between different RNA families. While alignments of group II introns and U5 spliceosomal RNAs are fairly robust against variations inψ, we observe large variations for miRNA and 5S rRNA alignments.
3.4 Gap removals
The possibility to correct gaps that are introduced at early stages was a major motivation for developing
aln3nn. We therefore investigated to what extent the algorithm actually utilizes this feature.
Table 1 shows the frequencyf of gaps that are removed at intermediate division steps and that are not re-introduced at later stages. We find that in some data sets one fifth of the gaps in the early stages of the progressive alignment are later removed again. This observation emphasizes the fact that the “once a gap, always a gap” property of pair-wise progressive alignment algorithms is a major shortcoming.
4
Discussion and Outlook
We have presented here a novel progressive alignment tool,aln3nn, that uses exact dynamic programming to construct three-way alignments of sequences and profiles and that uses a three-to-two aggregation procedure in the spirit of Neighbor-Net. A direct comparison of exact three-way alignments with progressive alignments of the same three sequences shows that the progressive approach leads to
significantly suboptimal scores. The discrepancy increases with sequence diversity and in/del probability. While incurring significant additional computational costs compared to pair-wise, guide-tree based, approaches,aln3nnachieves competitive alignment accuracies on both protein and nucleic acid data on
BAliBASEandBRaliBasebenchmark data set. The software furthermore provides an option to compute
Table 1: Mean frequencyf and standard deviationσf of correctly removed gap columns from the
interme-diate alignments after the division process.
RNA family f σf Group II Intron 0.138 0.268 miRNA 0.126 0.210 5S rRNA 0.265 0.279 snoRNA 0.131 0.230 tRNA 0.197 0.305 U5 0.083 0.114
structure enhanced RNA alignments.
Programs such asclustalwemploy a variety of heuristic rules that introduce local modifications of the scoring scheme to (partially) compensate for problematic sections of intermediate alignments. In contrast,
aln3nnachieves this encouraging performance without any heuristic modifications of the scoring schemes. This indicates that three-way alignments and the more sophisticated aggregation steps provide a significant advantage of pair-wise methods. In particular, the comparison with the performance of t coffeeshows that the shortcoming of initial pairwise alignments cannot be fully overcome even by utilizing consensus information of a collection of pairwise alignments. In particular, we observe that the three-to-two aggregation step, with its division procedure, removed up to one fifth of the previously introduced gap characters, emphasizing that the inability to correct misplaced gaps is major shortcoming of traditional progressive alignment algorithms.
In its present implementation,aln3nndemonstrates that progressive alignment schemes can produce competitive high quality alignments even without sophisticated scoring functions. This leaves ample room for future improvements. In particular, one might want to include gap penalties that depend on local sequence context in particular in the intermediate profile alignment steps. The division-step for the three-way alignments could also be modified in several ways. A possible approach would infer a phylogenetic tree that is is then subdivided at the longest or the most central edge. In its present
implementation,aln3nnis relatively slow compared to many recent multiple alignment methods, although it typically outperforms some of the standard tools. This lack of performance could be alleviated in the future e.g. by improving the branch and bound approach and by anchoring the alignments at very well conserved regions. Overall,aln3nnshows that progressive alignments are a competitive approach that is worth-while to explore.
Acknowledgment. Fruitful discussions with Dirk Drasdo and Ivo L. Hofacker, as well as valuable comments by anonymous referees are gratefully acknowledged. This work was supported in part by the FP-6 EMBIO project, http://www-embio.ch.cam.ac.uk/, the SPP 1174 “Deep Metazoan Phylogeny” and the DFG Bioinformatics Initiative (BIZ-6/1-2).
References
Bandelt & Dress, 1992. Bandelt, H. J. & Dress, A. W. M. (1992). Split decomposition: A new and useful approach to phylogenetic analysis of distance data. Mol. Phyl. Evol., 1, 242–252.
Bonhoefferet al., 1993. Bonhoeffer, L. S., McCaskill, J. S., Stadler, P. F. & Schuster, P. (1993). RNA multi-structure landscapes. a study based on temperature dependent partition functions. Eur. Biophys. J.,22, 13–24.
Bryant & Moulton, 2002. Bryant, D. & Moulton, V. (2002). NeighborNet: An agglomerative method for the construction of planar phylogenetic networks. InWABI ’02: Proceedings of the Second
International Workshop on Algorithms in Bioinformatics. Springer-Verlag, London, UK, pp. 375–391. Bryant & Moulton, 2004. Bryant, D. & Moulton, V. (2004). Neighbor-net: An agglomerative method for
the construction of phylogenetic networks. Mol. Biol. Evol.,21, 255–265.
Bryant & Moulton, 2007. Bryant, D. & Moulton, V. (2007). Consistency of neighbor-net. Alg. Mol. Biol.. Accepted.
Dalliet al., 2006. Dalli, D., Wilm, A., Mainz, I. & Steger, G. (2006). STRAL:progressive alignment of non-coding RNA using base pairing probability vectors in quadratic time. Bioinformatcs, 22, 1593–1599.
Dewey, 2001. Dewey, T. G. (2001). A sequence alignment algorithm with an arbitrary gap penalty function. J. Comp. Biol.,8, 177–190.
Doet al., 2005. Do, C. B., Mahabhashyam, M. S. P., Brudno, M. & Batzoglou, S. (2005). PROBCONS: Probabilistic consistency-based multiple sequence alignment. Genome Research,15, 330–340.
Edgar, 2004. Edgar, R. C. (2004). MUSCLE: a multiple sequence alignment method with reduced time and space complexity. BMC Bioinformatics, 5.
Feng & Doolittle, 1987. Feng, D. & Doolittle, R. (1987). Progressive sequence alignment as a prerequisite to correct phylogenetic trees. J. Mol. Evol., 25, 351–360.
Gardneret al., 2005. Gardner, P. P., Wilm, A. & Washietl, S. (2005). A benchmark of multiple sequence alignment programs upon structural RNAs. Nucleic Acids Research,33, 2433–2439.
Gotoh, 1982. Gotoh, O. (1982). An improved algorithm for matching biological sequences. J. Mol. Biol.,
162, 705–708.
Gotoh, 1986. Gotoh, O. (1986). Alignment of three biological sequences with an efficient traceback procedure. J. theor. Biol.,121, 327–337.
Griffiths-Joneset al., 2005. Griffiths-Jones, S., Moxon, S., Marshall, M., Khanna, A. & Eddy, S.
R.and Bateman, A. (2005). Rfam: annotating noc-coding RNAs in complete genomes. Nucleic Acids Res.,33.
Gupta & Schaffer, 1995. Gupta, S. K.and Kececioglu, J. D. & Schaffer, A. A. (1995). Improving the practical space and time efficiency of the shortest-paths approach to sum-of-pairs multiple sequence alignment. J. Comp. Biol., 2, 459–462.
Havgaardet al., 2005. Havgaard, J. H., Lyngsø, R., Stormo, G. D. & Gorodkin, J. (2005). Pairwise local structural alignment of RNA sequences with sequence similarity less than 40%. Bioinformatics,21, 1815–1824.
Hertelet al., 2007. Hertel, J., Hofacker, I. L. & Stadler, P. F. (2007). snoReport: Computational identification of snoRNAs with unknown targets. Submitted; preprint BIOINF 07-003.
Hertelet al., 2006. Hertel, J., Lindemeyer, M., Missal, K., Fried, C., Tanzer, A., Flamm, C., Hofacker, I. & Stadler, P. (2006). The expansion of the metazoan microrna repertoire. BMC Genomics,7.
H¨ochsmannet al., 2003. H¨ochsmann, M., T¨oller, T., Giegerich, R. & Kurtz, S. (2003). Local similarity in RNA secondary structures. InProc of the Computational Systems Bioinformatics Conference, Stanford, CA, August 2003 (CSB 2003). pp. 159–168.
Hofackeret al., 2002. Hofacker, I. L., Fekete, M. & Stadler, P. F. (2002). Secondary structure prediction for aligned RNA sequences. J. Mol. Evol., 319, 1059–1066.
Hofackeret al., 1994. Hofacker, I. L., Fontana, W., Stadler, P., Bonhoeffer, L., Tacker, M. & Schuster, P. (1994). Fast folding and comparison of RNA secondary structures. Monatshefte f¨ur Chemie,125, 167–188.
Hogeweg & Hesper, 1984. Hogeweg, P. & Hesper, B. (1984). The alignment of sets of sequences and the construction of phylogenetic trees. an integrated method. J. Mol. Evol.,20, 175–186.
Huson, 1998. Huson, D. H. (1998). Splitstree: analyzing and visualizing evolutionary data.
Bioinformatics, 14, 68–73.
Katohet al., 2002. Katoh, K., Misawa, K., Kuma, K. & Miyata, T. (2002). MAFFT: a novel method for rapid multiple sequence alignment based on fast fourier transform. Nucleic Acids Res.,30, 3059–3066.
Konagurthuet al., 2004. Konagurthu, A. S., Whisstock, J. & Stuckey, P. J. (2004). Progressive multiple alignment using sequence triplet optimization and three-residue exchange costs. J. Bioinf. Comp. Biol., 2, 719–745.
Lipmanet al., 1989. Lipman, D., Altschul, S. F. & Kececioglu, J. D. (1989). A tool for multiple sequence alignment. Proceedings of the National Academy of Sciences of the United States of America, 86, 4412–4415.
Mathews & Turner, 2002. Mathews, D. H. & Turner, D. H. (2002). Dynalign: An algorithm for finding secondary structures common to two RNA sequences. J. Mol. Biol.,317, 191–203.
McCaskill, 1990. McCaskill, J. S. (1990). The equilibrium partition function and base pair binding probabilities for RNA secondary structure. Biopolymers, 29, 1105–1119.
Myers & Miller, 1988. Myers, E. W. & Miller, W. (1988). Optimal alignemnts in linear space.
Bioinformatics, 4, 11–17.
Needleman & Wunsch, 1970. Needleman, S. B. & Wunsch, C. D. (1970). A general method applicable to the search for similarities in the aminoacid sequences of two proteins. J. Mol. Biol., 48, 443–452. Notredameet al., 2000. Notredame, C., Higgins, D. & Heringa, J. (2000). T-Coffee: a novel method for
multiple sequence alignments. Journal of Molecular Biology, 302.
Saitou & Nei, 1987. Saitou, N. & Nei, M. (1987). The neighbor-joining method: a new method, for reconstructing phylogenetic trees. Mol. Biol. Evol.,4, 406–425.
Sankoff, 1985. Sankoff, D. (1985). Simultaneous solution of the RNA folding, alignment, and proto-sequence problems. SIAM J. Appl. Math., 45, 810–825.
Siebert & Backofen, 2005. Siebert, S. & Backofen, R. (2005). MARNA: multiple alignment and consensus structure prediction of RNAs based on sequence structure comparisons. Bioinformatics,21, 3352–3359. Sokal & Michner, 1958. Sokal, R. R. & Michner, C. D. (1958). A statistical method for evaluating
systematic relationships. Univ. Kans. Sci. Bull.,38, 1409–1438.
Stoye, 1997. Stoye, J. (1997). Multiple sequence alignment with the divide-and-conquer method. Gene Combis,211, 45–56.
Stoyeet al., 1998. Stoye, J., Evers, D. & Meyer, F. (1998). Rose: generating sequence families.
Bioinformatics, 14, 157–163.
Thompsonet al., 1994. Thompson, J., Higgins, D. & Gibson, T. (1994). CLUSTAL W: improving the
sensitivity of progressive multiple sequence alignment through sequence weighting, position-specific gap penalties and weight matrix choice. Nucleic Acids Research,22, 4673–4680.
Thompsonet al., 1999. Thompson, J., Plewniak, F. & Poch, O. (1999). BAliBASE:a benchmark alignment databse for the evaluation of multiple alignment programs. Bioinformatcs, 15, 78–88. Wang & Jiang, 1994. Wang, L. & Jiang, T. (1994). On the complexity of multiple sequence alignment. J.
Comp. Biol., 1, 337–348.
Washietlet al., 2005. Washietl, S., Hofacker, I. & Stadler, P. (2005). Fast and reliable prediction of noncoding RNAs. PNAS,102, 2454–2459.
Wetzel, 1995. Wetzel, R. (1995). Zur Visualisierung abstrakter ¨Ahnlichkeitsbeziehungen. Ph.D. thesis, Bielefeld University, Germany.
Willet al., 2007. Will, S., Missal, K., Hofacker, I. L., Stadler, P. F. & Backofen, R. (2007). Inferring non-coding RNA families and classes by means of genome-scale structure-based clustering. PLoS Comp. Biol., 3, e65. Doi:10.1371/journal.pcbi.0030065.