Plastic Pipe Crack Detection Using Ultrasonic
Guided Wave Method
Mohd Fairusham Ghazali, Gigih Priyandoko, Wan Sofian Wan Hamat, Tan Wan Ching
Faculty of Mechanical Engineering, Universiti Malaysia Pahang, 26600 Pekan, Pahang, Malaysia.
Abstract—The basic components of a plastic material made it very sensitive to damage, which requires techniques for detecting damage reliable and efficient. Ultrasonic guided wave is a sensitive method for damage detection. It is a method based on propagation of low-frequency excitation in solid structures. Experimental works are performed to investigate the effect of crack to the frequency signal. Ultrasonic guided wave tests are performed for the uncracked and cracked plastic pipes. The study involves the analysis of signal between the uncracked and cracked frequency graph. This paper focuses on the detection of damage by using ultrasonic guided wave method, whose main objective is to determine performance of ultrasonic guided wave method in order to detect crack in pipeline. The frequency signal for an uncracked pipe shows one peak which is the operating frequency by the piezoelectric actuator itself while the frequency signal for single cracked pipe shows two peak which is the operating frequency by the piezoelectric actuator itself and the resultant frequency from the crack. For multi cracked pipe, the frequency signal shows more than two peak depend the number of crack. The experimental results show that this method can enhance the accuracy and precision of pipeline crack detection.
Keywords— Plastic pipe; crack; ultrasonic; guided wave method.
I. INTRODUCTION
Major advances have been made in recent years in pipeline technology. However, worldwide water distribution systems are mostly old. For example, there are over 54% of the pipes are older than 25 years and 24% are older than 50 years in many German systems. As pipes get older, the problems occurred increases in sewer pipes causing potential environmental problems, although in many cases these problems have yet to be quantified [1].
The choice of composite materials is no longer restricted to specific applications. In other fields, using these new materials as innovation tool and performance rising of their products such civil engineering. It is important first to have the best possible knowledge about these materials in somehow to monitor any changes in these properties and consequently their influence on the structure behavior [2,7].
Plastic pipe is a good material resistance light, cheap and longer life span. Therefore, plastic pipes usually are used to transport gas, water and chemicals. In general, plastic pipes are widely used over metal or concrete pipes. Due to the material being immune to water corrosion and highly resistant to fouling, it is also being considered as a replacement for stainless steel in safety-critical applications in nuclear power stations [3].
According to Carvalho et al. (2008), researchers have spent an ample amount of time, investigations and researched on non-destructive test techniques. As much as during the setting up phase during their useful life, these techniques are used as a method to asses engineering structures and system[4].
Crack inspection is a valuable non-destructive test (NDT) method in many industries. Crack inspection method is useful, which often exhibit complex geometries, are exposed to high thermal and mechanical loads and are expected to satisfy strict safety requirements. Lately, there is a need to expand a powerful crack defect detection methods [5].
Early detection of damage is not necessarily visible from the external face and even when it is the case of visual inspection does not realize its case state. In order of reliable and efficient use, these new materials, the development of a measurement system that can answer the following two questions of primary importance is required whether it could be measured directly in NDT and reliable mechanical properties of a composite structure. Is it possible to detect damage as quick as possible in order to monitor, evaluate and repair if necessary the structure [6].
II. EXPERIMENTSETUP
This experiment need to be carried out a few times to make sure a more accurate result is obtained. First, the experiment will be carried out on an undamaged plastic pipe. Data will be collected and analyzed. Next, the experiment will be carried out on a plastic pipe with a single crack. Last but not least, the experiment will be carried out on a plastic pipe with multi-cracks. All the data were collected and analyzed. From the data collected, we can compare the result of all the three specimen.
Piezoelectric stack actuator was used to excite the specimen. By placing the specimen on the foams and using a significantly smaller size of stack actuator, this is the best ompromise method for diagnosing defects. Nonlinear effects and noise effects from the attachment of the mechanical shaker or rigid supports can be prevented by using this method. A comparison was made between this method and the former method that using a mechanical shaker for the excitation. Although the maximum excitation level from the piezoelectric stack actuator is relatively lower than with the mechanical shaker, results from the latter method also showed a good signature of the sidebands effect against the defects [6,8].
The data collected will undergo analysis and converted into time base response in the DASYLab software. The data will also undergo amplification and filtering module. The amplification module is to amplify the data collected and filtering of the data is extremely vital in obtaining an accurate time base response graph. The plastic pipe will be attached the sensors and then it will be connected to a DAQ system. The DAQ system will be synchronized to the DASYLab software using the NI-DAQ software. The system will be configured to analyze the voltage as the sensor medium. The accelerometer will be controlled using the DASYLab software. After collecting the raw data, denoising were done by using MATLAB. Fig. 1 shows the experiment set up for this research.
Fig. 1 : Full view for the experimental setup
III. ULTRASONICGUIDEDWAVETESTING
The results were taken for the frequency of 3000 Hz, 6000 Hz and 9000 Hz. The distance between the sensor and actuator were placed at 30 cm, 60 cm and 90 cm. At each distance, the three frequency need to be tested. The raw data obtained from DASYLab can be denoised using MATLAB.
Fig. 2 : Frequency of 3000 Hz at 30 cm
Fig. 3 : Frequency of 3000 Hz at 60 cm
Fig. 4 : Frequency of 3000 Hz at 90 cm
Fig. 2, Fig. 3 and Fig. 4 show the frequency signal for 3000 Hz at distance 30 cm, 60 cm and 90 cm. The frequency signal amplitude are the highest at the distance 30 cm compare the distance 60 cm and 90 cm because the more capable of travelling at a short distance.
Fig. 5 : Frequency of 6000 Hz at 30 cm
Fig. 6 : Frequency of 6000 Hz at 60 cm
Fig. 7 : Frequency of 6000 Hz at 90 cm
Fig. 5, Fig. 6 and Fig. 7 show the frequency signal for 6000 Hz at different distance. The frequency signal amplitude are the highest at the distance 30 cm compare the distance 60 cm and 90 cm because the more capable of travelling at a short distance.
Fig. 8 : Frequency of 9000 Hz at 30 cm
Fig. 9 : Frequency of 9000 Hz at 60 cm
Fig. 10 : Frequency of 9000 Hz at 90 cm
Fig. 8, Fig. 9 and Fig. 10 show the frequency signal for 9000 Hz at different distance. The frequency signal amplitude are the highest at the distance 30 cm compare the distance 60 cm and 90 cm because the more capable of travelling at a short distance.
Table 1 shows the simplified frequency signal amplitude at different distance obtained from the frequency response graph.
TABLE I. FREQUENCY AMPLITUDE VALUE AT DIFFERENT DISTANCE Frequency (Hz) Amplitude 30 cm 60 cm 90 cm 3000 0.00200 0.00160 0.00050 6000 0.00160 0.00050 0.00004 9000 0.00011 0.00010 0.00009
From the trend of the graph, it could be clearly seen that the amplitude of the frequency response signal decreases as the distance between the piezoelectric actuator and accelerometer increases. For 3000 Hz, the frequency signal response amplitude is 0.00200 at 30 cm followed by 0.00160 at 60 cm and 0.00050 at 90 cm. For 6000 Hz, the frequency signal response amplitude is 0.00160 at 30 cm followed by 0.00050 at 60 cm and 0.00040 at 90 cm. For 9000 Hz, the frequency signal response amplitude is 0.00011 at 30 cm followed by 0.00010 at 60 cm and 0.00009 at 90 cm. All the frequencies show that that the frequency signal amplitude are the highest at the shortest distance. This shows that it is capable of travelling at a short distance.
In general, the frequency signal amplitude decreases in all samples due to the attenuation inside the testing medium as the distance from the source is increased too. It is clear that the attenuation increases with increasing distance. The transmitted signal is attenuated by the transmission medium which is the time required by the signal to reach the sensor point. This transmission makes some turbulence in the transmission medium and such turbulence may remain exist over this period of time. When transmission frequency increases, the transmission medium will contain effects of consecutive signals and constructive and destructive interferences would take place.
Accordingly, the accelerometer would receive transmitted signals at a higher frequency and if the accelerometer needs longer time to distinguish the received signals from each other, then higher frequency may cause destructive interference at the sensor, which in turn affects the final recorded signal amplitude. If the application requires using accelerometer in small samples with high accuracy, then working at small distances and low frequencies is the preferred. However, accelerometer can be used in case of large samples if the fine accuracy is not very important. Samples of chemicals, medicines and laboratory fluids can be considered as small samples. As well, crude oil pools in seas and drinking water reservoirs are large ones.
For cracked experimental investigation, the prepared plastic pipe was saw with an approximate thickness of 1 mm and 1
cm depth. That is to create a single cracked. For cracked testing the distance of the piezoelectric actuator and accelerometer is 90 cm. The distance of the cracked from the actuator was 15 cm. In this experiment, a frequency of 500 Hz was used. After the data was obtained, another 2 cracks were created which total of 3 cracks with the same thickness depth. The distance between the cracks are 15 cm. Same frequency was used for this testing. Joseph L. Rose; A Ultrasonic Guided Waves in Structural Health Monitoring supported this method.
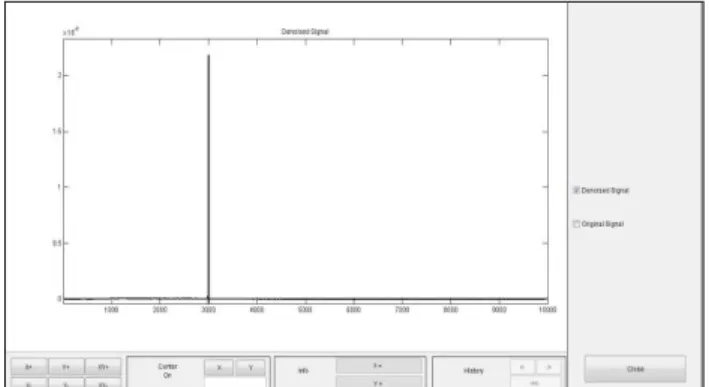
Fig. 11 : Frequency signal of uncracked pipe
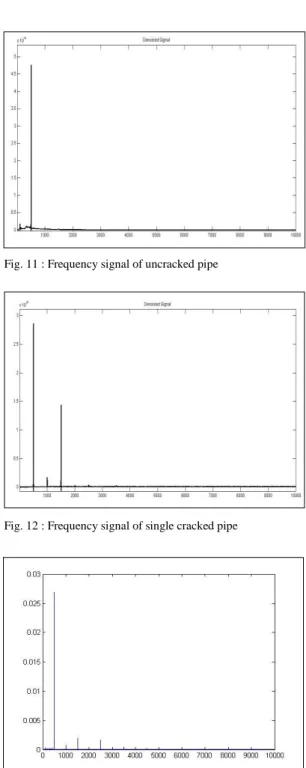
Fig. 12 : Frequency signal of single cracked pipe
Fig. 11 shows the frequency signal for an uncracked pipe. From the frequency signal obtained, the data shows one peak which is the operating frequency by the piezoelectric actuator itself. Fig. 12 shows the frequency signal for single cracked pipe. From the frequency signal obtained, the data shows two peak which is the operating frequency by the piezoelectric actuator itself and the resultant frequency from the crack. Fig. 13 shows the frequency signal for multi cracked pipe. From the frequency signal obtained, the data shows three peaks which one peak is the operating frequency by the piezoelectric actuator itself and two a few peaks is the resultant frequency from the cracks.
Accelerometer has its own area of influence characterized by a sensing radius and the corresponding circle. Damage within the area of influence of the sensor is highly sensitive as it creates higher disturbances than the damage outside the area of influence. An exciting vibration at createsappreciable stress in the material affecting interfaces at all scales ofdamage. An ultrasound probe wave traveling through these interfaces is modulated due to vibration-induced changes in the interface condition and, as a result, additional spectral components appear at the frequencies. These new frequency components indicate that a flaw or crack is present.
IV. CONCLUSION
At the beginning of this research, the main objective is to design an experimental test rig for the plastic pipe crack detection. This objective has been successfully achieved as the experimental test rig is designed. Followed by the second objective, this project is aim to obtain the differences of frequency amplitude of the pipe different condition. With the verification of the experimental result, it is proved that as the distance of the piezoelectric sensor and accelerometer increases, the frequency signal amplitude decreases.
Another objective to carry this project is by means to determine the performance of ultrasonic guided wave method in order to detect crack in pipeline. For this objective, it is proven that the frequency signal peak increases with the number of cracks on the plastic pipe. In short, all the objectives and hypothesis are successfully achieved and proven. This project has been proven that ultrasonic guided wave method shows the differences of result in uncracked and cracked pipe. Therefore, it is firmly to conclude that ultrasonic guided wave method can be able to be used to detect crack in plastic pipes.
ACKNOWLEDGMENT
This research is supported by Universiti Malaysia Pahang (UMP) through the RDU Grant research project (RDU130111) lead by Dr. Mohd Fairusham Bin Ghazali. The authors are
grateful to the Universiti Malaysia Pahang and Education Sponsorship Division, Ministry Of Education Malaysia for supporting the present study.
REFERENCES
[1] Burn, S., DeSilva, D., Eiswirth, M., Hunaidi, O., Speers, A., & Thornton, J. (1999). Pipe leakage – Future challenges and solutions. [2] Lakhdar, M., Mohammed, M., Boudjemâa, L., Rabiâ, A., & Bachir, M.
(2013). Damages detection in a composite structure by vibration
analysis. Energy Procedia, 36, 888 – 897. doi:
10.1016/j.egypro.2013.07.102
[3] Assunção, E., Coutinho, L., Hagglund, F., Troughton, M., & Spicer, M. (n. d.). Advanced NDT techniques for plastic pipeline inspection. Retrieved from http://www.testpep.eu/
publication/files/Advanced-NDT-Techniques-for-Plastic-Pipeline-Inspection.pdf
[4] Zenzinger, G., Bamberg, J., Dumm, M., & Nutz, P. (n. d.). Crack detection using eddytherm. Retrieved from http://www.mtu-rzeszow.com/en/technologies/engineering_news/others/
Bamberg_Crack_detection_using_eddytherm.pdf
[5] Carvalho, A. A., Rebello, J. M. A., Souza, M.P.V., Sagrilo, L. V. S. & Soares, S. D. (2008). Reliability of non-destructive test techniques in the inspection of pipelines used in the oil industry. International Journal of Pressure Vessels and Piping, 85, 745–751.
[6] Ruztareeem, J. (2010). Fatigue crack detection using nonlinear acoustic – analysis of vibro – acoustic modulations. (Unpublished doctoral dissertation). University of Sheffield, U. K.
[7] Hongyuan Li and Hong Xu, (2013). Damage Detection for Structural Health Monitoring Using Ultrasonic Guided Waves, School of Energy, Power and Mechanical Engineering, North China Electric Power University, Beijing, China.
[8] Shi YAN, Ji Qi, Nai-Zhi Zhao, Yang CHENG and Sheng-Wenjun QI, (2014). Multiple Crack Detection of Pipes Using PZT-based Guided Waves, School of Civil Engineering, Shenyang Jianzhu University, Shenyang Liaoning 110168, China; School of Civil and Environmental Engineering, Beijing University of Technology, Beijing 100081, China.