Accurate telemonitoring of Parkinson’s disease
symptom severity using nonlinear speech signal
processing and statistical machine learning
Athanasios Tsanas
University of Oxford, St. Cross College
Thesis in partial fulfillment of the requirements for the degree of
Doctor of Philosophy
Supervisors: Dr. M.A. Little and Dr. P.E. McSharry
To my family, with love
To my teachers, with gratitude
This document has been slightly updated to correct some minor typos and slight inconsistencies found by the author and other researchers since the thesis approval in July 2012.
It is possible that some inaccuracies remain in the text. If you find any, please email me: [email protected]
Athanasios Tsanas
University of Oxford, St. Cross College
Summary of thesis submitted in partial fulfillment of the requirements for the degree of Doctor of Philosophy
This study focuses on the development of an objective, automated method to extract clinically useful information from sustained vowel phonations in the context of Parkinson‘s disease (PD). The aim is twofold: (a) differentiate PD subjects from healthy controls, and (b) replicate the Unified Parkinson‘s Disease Rating Scale (UPDRS) metric which provides a
clinical impression of PD symptom severity. This metric spans the range 0 to 176, where 0 denotes a healthy person and 176 total disability. Currently, UPDRS assessment requires the physical presence of the subject in the clinic, is subjective relying on the clinical rater‘s expertise, and logistically costly for national health systems. Hence, the practical frequency of symptom tracking is typically confined to once every several months, hindering recruitment for large-scale clinical trials and under-representing the true time scale of PD fluctuations.
We develop a comprehensive framework to analyze speech signals by: (1) extracting novel, distinctive signal features, (2) using robust feature selection techniques to obtain a parsimonious subset of those features, and (3a) differentiating PD subjects from healthy controls, or (3b) determining UPDRS using powerful statistical machine learning tools. Towards this aim, we also investigate 10 existing fundamental frequency ( ) estimation algorithms to determine the most useful algorithm for this application, and propose a novel ensemble estimation algorithm which leads to a 10% improvement in accuracy over the best individual approach. Moreover, we propose novel feature selection schemes which are shown to be very competitive against widely-used schemes which are more complex. We demonstrate that we can successfully differentiate PD subjects from healthy controls with 98.5% overall accuracy, and also provide rapid, objective, and remote replication of UPDRS assessment with clinically useful accuracy (approximately 2 UPDRS points from the clinicians‘ estimates), using only simple, self-administered, and non-invasive speech tests.
The findings of this study strongly support the use of speech signal analysis as an objective basis for practical clinical decision support tools in the context of PD assessment.
First and foremost I would like to thank my family whose continuous support for all those years has always been well beyond the call of duty. I would like to extend my thanks to a truly remarkable individual, Angeliki, for making me smile and being a constant source of resourcefulness and inspiration. I was extremely fortunate to have been amongst talented students and inspiring scholars during the course of my previous higher education in Athens, Liverpool, and Newcastle. Although not directly linked to this work, their influence was keenly felt. My previous supervisors, Theofanis Maniatis (Athens) and John Goulermas (Liverpool), had been great mentors and I am indebted to them in more than one way. A special thanks to my colleagues Mohammed Aziz, Trevor Wood, Yiming Zhong, Denis Lapitski, Chris Lustri and Sofia Piltz in DH27 with whom we shared the same office over the past years, and the members of the SAMP group Siddharth Arora, Paul Moore, Shilan Mistry, and Ada Lau from whom I learned so much and often failed to give adequate contribution.
I am grateful to my supervisors Max Little and Patrick McSharry for offering me this CASE studentship, and for their never-ending support, patience, and advice. Max in particular has been an exceptional mentor and we often got engaged in stimulating discussions, not to mention the literally thousands of emails we exchanged. Gari Clifford was an endless source of inspiration, and encouraged me to join his excellent group meetings and interact with many of his colleagues. My college advisor, James Taylor, was particularly helpful in college matters. The staff in the Mathematical Institute has been very kind to me: especially Ruth Preston, Sandy Patel, Val Timms, Keith Gillow, and Waldemar Schacklow. Talks on the phone and over emails with Michael Deisher, Bill Deleeuw and Sangita Sharma from Intel Corporation have helped me keep focused and shaped my research. The data used in this work was collected as part of a large multi-centre study in the US; I am obliged to all those involved. Matias Zañartu generated the speech signals I used to validate the fundamental frequency estimation algorithms in Chapter 5. Peter Robbins and Philip Maini kindly offered advice and pointed out useful references early in my research. I extend my thanks to the many researchers who have replied to my emails explaining concepts, shared source code, provided valuable feedback and made useful suggestions. At the risk of undeservedly leaving someone out, I want to acknowledge: Lorraine Ramig, Jennifer Spielman, Declan Costello, Eric Hunter, Alexander Ihler, Hideki Kawahara, Yijun Sun, Laurens van Maaten and Paul Boersma. Finally, I would like to thank all my examiners for their constructive feedback and valuable suggestions, in particular Philip Maini, Pedro Gomez-Vilda, Gari Clifford, and Steve Roberts.
AHTD Intel‘s At Home Telemonitoring Device
BG Basal Ganglia
CART Classification and Regression Trees EGG Electroglottography
FS Feature Selection GCI Glottal Closure Instance
LASSO Least Absolute Shrinkage and Selection Operator MAE Mean Absolute Error
mRMR Minimum Redundancy Maximum Relevance OAA One Against All
OAO One Against One
PD Parkinson‘s Disease PDA Pitch Detection Algorithm PWP People with Parkinson‘s
RF Random Forests
RRCT Relevance Redundancy and Complementarity Trade-off SVM Support Vector Machine
SPL Sound Pressure Level
Frequently used notation
The following mathematical notational conventions are used throughout this thesis:
Vectors are written in bold lower case letters, for example ; matrices are written in bold capital letters, for example . * + denotes the ith row, jth column matrix entry. The subscript n
in the form indicates the nth element of a vector. The expectation and the conditional expectation operators used are: , -and ,( | )-. Also, ( ) denotes the transpose of a matrix, and represents the differentiation of a function with respect to . The covariance of two random variables is defined by ( ) , - , - , -. The convolution operator is denoted by , and the distance metric is represented by ‖ ‖. Unless otherwise specified, the Euclidean distance is used. In the context of this thesis we work with (a) real numbers (represented with ), (b) natural numbers (represented with ), and (c) integer numbers (represented with ).
List of figures
2.1 Schematic diagram of a neuron, showing its main anatomical parts ... 11 2.2 Schematic diagram of the basal ganglia (BG) architecture, showing the input into the BG from the cortex and the thalamus, the BG processing, the BG output, and the interconnections between the BG nuclei. The abbreviations of the BG nuclei are explained in the text ... 13 2.3 Schematic diagram of the major parts involved in the production of speech ... 17 2.4 (a) Typical sustained vowel /a/ phonation. The overall amplitude decays over the duration of the phonation (usually 10-30 seconds). (b) Magnified version of the same sustained vowel /a/ phonation to illustrate the signal amplitude and the signal period. The magnified signal is not exactly periodic, a concept we revisit later. ... 23 2.5 Life-span changes of the fundamental frequency as a function of gender for the ages
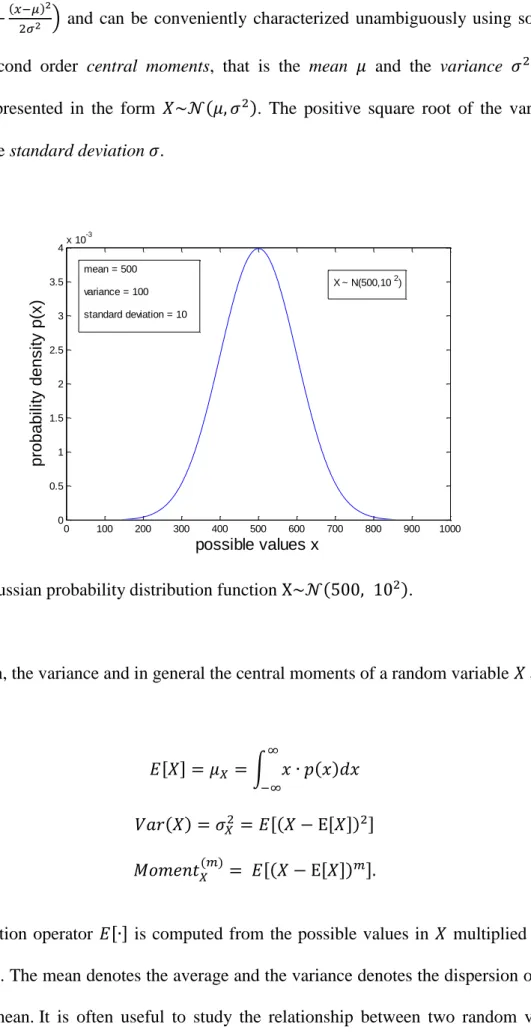
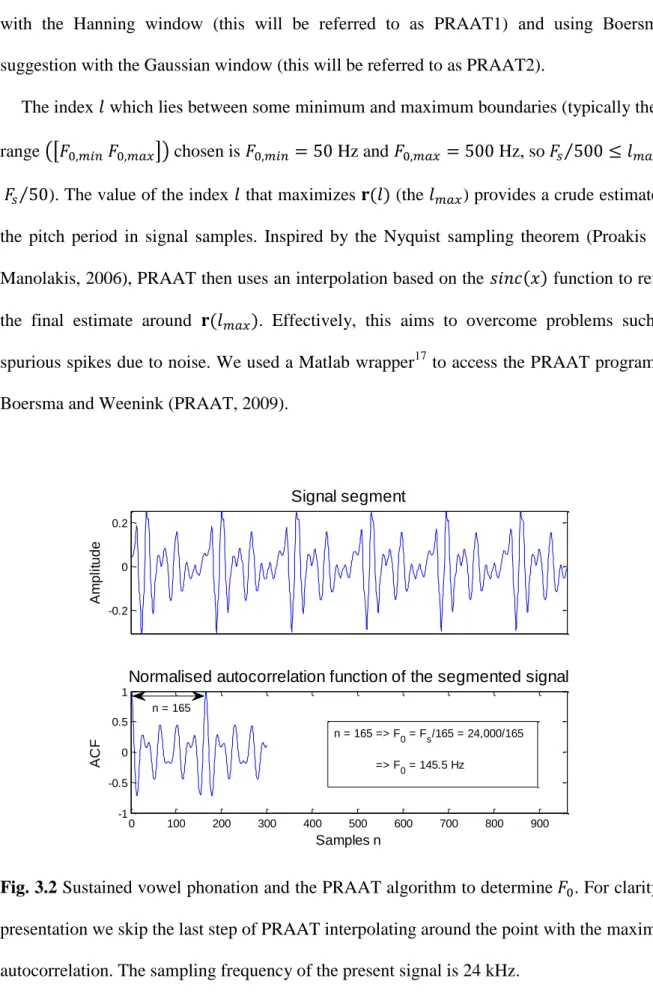
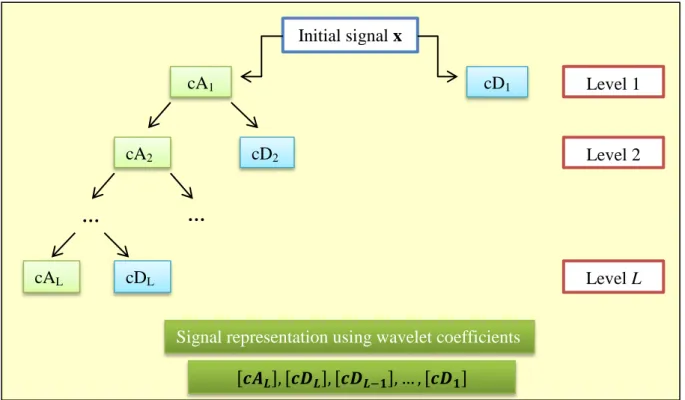
20-90 years old (after Titze, 2000). ... 25 3.1 Gaussian probability distribution function ( )... 32 3.2 Sustained vowel phonation and the PRAAT algorithm to detect . For clarity in presentation we skip the last step of PRAAT interpolating around the point with the maximum autocorrelation. The sampling frequency of the present signal is 24 kHz ... 43 3.3 Schematic diagram of wavelet decomposition. ―A‖ corresponds to approximation coefficients and ―D‖ to detail coefficients. The number in each box denotes the level . 73
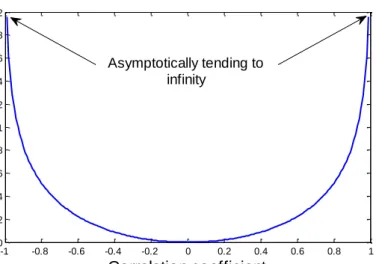
4.1 Information theoretic (IT) quantity (relevance or redundancy) as a function of the rank (Spearman) correlation coefficient , computed as ( ) ( ). Asymptotically, as the absolute value of the correlation coefficient tends to , the IT quantity becomes infinite (in practice we set this to a very large value). We demonstrate
selection... 113 4.2 Graphical representation of the effect of the partial correlation coefficient. The lower case letters represent the shared information between the random variables ... 115 5.1 Summary of ground truth values for the 92 speech signals used in this study. The middle point represents the median and the bars represent the interquartile range. The index refers to the speech signal used in the study. ... 144 5.2 Overview of the tracking errors of the contour (86 reference time instances of
evaluation) for a randomly selected signal (number 33) using the 10 individual PDAs. Some of the PDAs have large spikes, temporarily deviating considerably from the ground truth ... 147 5.3 Comparing the performance of Ensemble 12 with the best individual estimation algorithm, NDF, using (a) MAE, and (b) RMSE. Very similar results are obtained for MRE. For the vast majority of signals used in this study, Ensemble 12 is better than NDF. ... 148 5.4 Comparison of the feature selection algorithms in terms of true feature set recovery. The lower the false discovery rate, the better the feature selection algorithm. The horizontal axis denotes the number of features selected during the incremental process. ... 157 5.5 Comparison of the feature selection algorithms based on learner performance (binary classification datasets) using SVM (left) and RF (right). The horizontal axis denotes the number of features selected in the greedy feature selection process. ... 158 5.6 Comparison of the feature selection algorithms based on learner performance
(multi-class (multi-classification datasets) using SVM (left) and RF (right). The horizontal axis denotes the number of features selected in the greedy feature selection process. ... 159 5.7 Comparison of the feature selection algorithms based on learner performance (‗fat‘ datasets, where the number of features is larger than the number of samples). ... 160
estimate the average Parkinson‘s disease symptom severity expressed using the Unified Parkinson's Disease Rating Scale (UPDRS). The device that collects the data is known as the At-Home-Testing-Device (AHTD). The red box (steps 6-8) is the focus of this study. ... 167 7.1 Comparison of out of sample mean performance results with confidence intervals (one standard deviation around the quoted mean performance) using the features selected by each of the seven feature selection algorithms (for clarity only the first 30 steps are presented). These results are computed using 10-fold cross validation with 100 repetitions. ... 176 7.2 Probability densities of the (a) motor-UPDRS, and (b) total-UPDRS. The probability densities are estimated using kernel density estimation with Gaussian kernels ... 178 7.3 Motor-UPDRS and total-UPDRS tracking over the six month period of the AHTD trial for the subject with the largest and most uncharacteristic UPDRS progression (sharp UPDRS increase three months into the trial, and sharp UPDRS decrease six months into the trial). The computation of the out-of-sample MAE and the confidence intervals were estimated from the average MAE of the six weekly error estimates throughout the six month duration of the trial for the specific individual. Slight deviations from a straight interpolation line are observed because of the subsequent rounding of the interpolated UPDRS values. ... 188 7.4 Empirical cumulative distribution functions of the model (denoted by blue) versus a naïve benchmark (denoted by red) for estimating the total-UPDRS. Similar results are observed for estimating the motor-UPDRS. ... 191
List of tables
3.1 Summary of the estimation algorithms used in this study ... 39
3.2 Summary and key information of the dysphonia measures used in this study ... 81
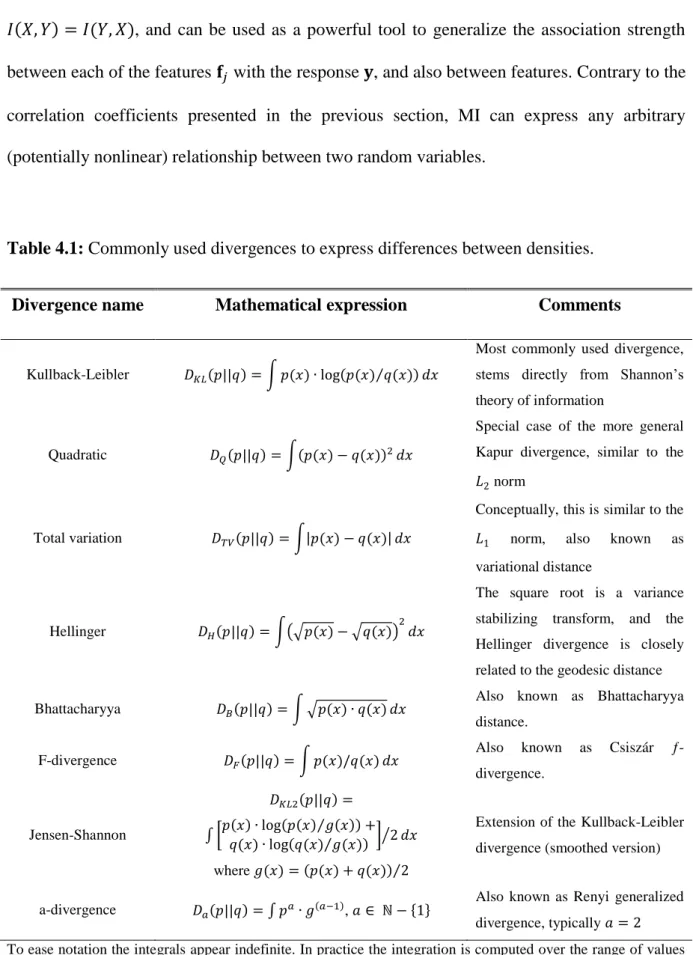
4.1 Commonly used divergences to express differences between densities ... 90
4.2 Incremental feature selection steps suggested by Battiti... 101
4.3 Summary of the properties of the feature selection algorithms used in this study. ... 119
4.4 Proposed methodology for selecting features using the greedy feature selection algorithms ... 120
5.1 Performance of the estimation algorithms ... 146
5.2 Performance of the ensemble estimation algorithms ... 148
5.3 Summary of the datasets ... 154
7.1 Statistical associations of indicative dysphonia measures with the response variable to differentiate people with Parkinson‘s disease and healthy controls... 174
7.2 Summary of the classification results in the literature for the application of discriminating people with Parkinson‘s disease from healthy controls using sustained vowels ... 175
7.3 Selected feature subsets and classification performance differentiating people with Parkinson‘s disease and healthy controls ... 177
7.4 Statistical associations of indicative dysphonia measures with motor-UPDRS and total-UPDRS for the male subset... 182 7.5 Statistical associations of indicative dysphonia measures with motor-UPDRS and total-UPDRS for the female subset ... 183 7.6 Selected dysphonia measures using seven feature selection algorithms and classification performance for motor-UPDRS and total-UPDRS for males. ... 185
7.7 Selected dysphonia measures using seven feature selection algorithms and classification performance for motor-UPDRS and total-UPDRS for females. ... 186
Contents
Summary ... iii
Acknowledgements ... iv
Abbreviations ... v
Frequently used notation ... vi
List of figures ... vii
List of tables ... x
Chapter 1
Introduction
...1
1.1 Historical review of Parkinson‘s disease ... 1
1.2 Statement of the problem ... 2
1.3 First-principles models versus data-driven models ... 5
1.4 Scope and structure of the thesis ... 6
1.5 Summary of contributions ... 8
Chapter 2
Essential physiological background
...10
2.1 Nervous system ... 10
2.1.1 Physiology of the basic functional unit of the brain: the neuron ... 11
management ... 13
2.2 Speech related organs ... 16
2.2.1 Pulmonary system ... 17
2.2.2 Vocal folds ... 18
2.2.3 Vocal tract ... 20
2.2.4 Sustained vowels ... 21
2.3 Life-span changes in physiology ... 24
2.4 Speech and Parkinson‘s disease ... 25
Chapter 3
Clinical speech signal processing algorithms
...28
3.1 Recurring mathematical concepts ... 28
3.1.1 Data discretization ... 28
3.1.2 Linear signal processing tools: autocorrelation and cross-correlation ... 29
3.1.3 Frequency analysis ... 30
3.1.4 Probabilities and probability density estimation ... 31
3.1.5 Uncertainty and entropy ... 35
3.2 Speech signal processing algorithms ... 36
3.2.1 Fundamental frequency estimation ... 37
3.2.1.1 DYPSA ... 40
3.2.1.2 PRAAT ... 42
3.2.1.3 YIN ... 44
3.2.1.4 RAPT ... 45
3.2.1.7 TEMPO ... 50
3.2.1.8 NDF ... 51
3.2.1.9 XSX ... 52
3.2.1.10 A novel ensemble approach ... 53
3.2.2 Classical dysphonia measures and minor algorithmic variants ... 56
3.2.2.1 Jitter variants ... 57
3.2.2.2 Shimmer variants ... 61
3.2.2.3 Harmonics to Noise Ratio (HNR) ... 62
3.2.2.4 Linear Predicting Coding Coefficients (LPCC) ... 63
3.2.2.5 Mel Frequency Cepstral Coefficients (MFCC) ... 64
3.2.3 Modern dysphonia measures ... 66
3.2.3.1 Glottal to Noise Excitation ratio (GNE) ... 67
3.2.3.2 Detrended Fluctuation Analysis (DFA) ... 68
3.2.3.3 Recurrence Periodicity Density Entropy (RPDE) ... 69
3.2.3.4 Pitch Period Entropy (PPE) ... 70
3.2.4 Novel dysphonia measures ... 71
3.2.4.1 Wavelet measures ... 72
3.2.4.2 Empirical Mode Decomposition Excitations Ratios (EMD-ER) ... 74
3.2.4.3 Vocal Fold Excitation Ratios (VFER) ... 77
3.2.4.4 Glottal Quotient (GQ) ... 79
3.3 Overview of the signal processing methods ... 80
Chapter 4
Methodology for data analysis
...82
4.1.1 Density plots and scatter plots ... 84
4.1.2 Correlation analysis ... 85
4.1.3 Statistical hypothesis tests ... 87
4.1.4 Divergences and mutual information ... 89
4.2 Curse of dimensionality and dimensionality reduction techniques ... 92
4.2.1 Feature transformation ... 93
4.2.2 Feature selection: introduction and known approaches ... 95
4.2.2.1 Least Absolute Shrinkage and Selection Operator (LASSO) ... 98
4.2.2.2 Minimum Redundancy Maximum Relevance (mRMR) ... 99
4.2.2.3 Gram-Schmidt Orthogonalization (GSO) ... 103
4.2.2.4 RELIEF ... 104
4.2.2.5 Local Learning Based Feature Selection (LLBFS) ... 105
4.2.3 Novel feature selection algorithms ... 107
4.2.3.1 A minimum redundancy maximum relevance approach for feature selection using alternative criteria to mutual information... 108
4.2.3.2 Extending LLBFS to multi-class classification problems ... 109
4.2.3.3 Relevance Redundancy and Complementarity Trade-off (RRCT) ... 110
4.2.4 Summary of the feature selection schemes and a methodology for selecting features ... 118
4.3 Mapping features to the response ... 121
4.3.1 Overview of classification approaches ... 122
4.3.2 Support vector machines ... 124
4.3.3 Ensembles of decision trees ... 128
4.4 Model evaluation and generalisation ... 132
4.4.3 Statistical hypothesis and surrogate tests to validate models ... 136
4.5 Summary of the proposed methodology for analysing data ... 138
Chapter 5
Applying the signal processing and machine learning tools to data
...141
5.1 Comparing fundamental frequency estimation algorithms ... 142
5.2 Machine learning datasets ... 151
5.3 Feature selection results ... 155
5.3.1 Validating feature selection algorithms based on false discovery rate ... 155
5.3.2 Validating feature selection algorithms based on learner performance ... 157
5.3.3 Summarizing the feature selection results ... 161
Chapter 6
Data acquisition: speech and Parkinson‘s disease
...163
6.1 Speech data collection protocol ... 163
6.2 Speech database used for the discrimination of healthy controls from people with Parkinson‘s disease ... 164
6.3 Speech database used for estimating the Unified Parkinson‘s Disease Rating Scale (UPDRS) ... 165
6.4 Confounding factors when inferring Parkinson‘s disease symptom severity from speech recordings ... 169
Chapter 7
Parkinson‘s disease classification using speech signals
...172
Parkinson‘s disease ... 172
7.2 UPDRS statistics and structure ... 178
7.3 Functional mapping of dysphonia measures to UPDRS ... 180
7.4 Validating the results using statistical hypothesis tests and surrogate hypothesis tests ... 189
Chapter 8
Conclusions and future work
...192
References
...200
Glossary of key terms
...219
Appendices
I. Feature selection results
...223
II. Correlations, statistics and errors
...229
III. UPDRS guide
...232
IV. Courses attended
...236
Chapter 2
Introduction
This study addresses the pertinent problem of monitoring neurological disorders and in particular Parkinson’s disease (PD). Using speech signals as a measurement, we develop clinically useful tools for (a) differentiating healthy controls from people with Parkinson‘s (PWP), and (b) monitoring accurately, and remotely, average PD symptom severity as defined by the clinical metric Unified Parkinson’s Disease Rating Scale (UPDRS).
1.1
Historical overview of Parkinson’s disease
1The oldest description of parkinsonism symptoms goes as far back as 5,000 B.C. in India allegedly described in The Four Vedas. Other possible references to parkinsonian indications include descriptions in the Bible and Iliad of Homer, and later descriptions can be found in the works of Leonardo DaVinci and the plays of William Shakespeare during the 16th century.
However, it was the milestone work of James Parkinson in 1817 reported in ―An essay on the shaking palsy‖, which provided an overview of the disease in its medical context based on
anecdotal observations (Parkinson, 1817). Parkinson himself referred to it as paralysis agitans
and the term Parkinson’s Disease (PD) was coined later by Jean-Martin Charcot in 1876. Charcot was a highly influential PD researcher, adapting the sphygmograph (originally designed for recording arterial pulse) to record tremor at the wrist, prescribing early drugs and
1 This is necessarily kept brief; the interested reader may want to consult Chapter 1 of Pahwa and Lyons (2007)
and the website www.movementdisorders.org for a more detailed historical overview.
developing methods to alleviate symptoms. Attempts to cure PD were conducted by Benjamin Duchenne who used electrotherapy as early as 1855 (Duchenne, 1855).
The cornerstone of contemporary treatment of PD is the manipulation of pharmacological pathways in the form of levodopa (L-dopa), which alleviates some symptoms of the disease. This was based on the work of Nobel Prize winner Arvid Carlsson, who demonstrated in the 1950s that dopamine is a neurotransmitter in the brain, and George Cotzias, who administered L-dopa in patients with successful outcomes (Cotzias, 1968). Numerous developments in pharmaceuticals and surgical techniques have followed in recent years as remedies against PD, but to the present day there is no available cure and PD is eventually fatal.
1.2
Statement of the problem
Neurological disorders affect people profoundly and claim lives at an epidemic rate worldwide, with PD being the second most common neurodegenerative disorder after Alzheimer‘s (de Rijk et al., 2000). Incidence rates and prevalence rates2 of PD in different studies vary, with a large recent study reporting incident rates of 20/100,000 (Rajput et al., 2007). It is believed that there are more than one million PWP in North America alone (Lang and Lozano, 1998), whilst a large meta-analysis study in Europe reported prevalence rates approximately 108-257/100,000 and incidence rates 11-19/100,000 (Campenhausen et al., 2005). Furthermore, Schrag et al. (2002) report that an estimated 20% of PWP go undiagnosed. Most sources claim greater PD prevalence in men than women (Baldereschi et al., 2000; Haaxma et al., 2007) and the lifetime risk, considering current global average life expectancy, is estimated to be 4.4% (men) and 3.7% (women) (Elbaz et al., 2002).
2Incidence rate is the fraction of newly diagnosed patients per year in the population, usually quoted in cases per
100,000 (Rajput et al., 2007). Prevalence rate refers to the fraction of people in the population diagnosed at any given time.
Aging is associated with a number of detrimental effects on a person‘s health impinging on, amongst others, the nervous system. Thus, the aforementioned statistics are bound to increase due to worldwide population aging. In fact, all studies suggest that age is the single most important risk factor for PD onset, which increases steeply after age 50 (Elbaz et al., 2002). The disease is progressive, where symptoms get worse with time and PD progression cannot be stopped; however pharmaceutical and surgical intervention can mitigate the effect of some of the symptoms and prolong the patient‘s life.
Clinicians have devised a number of methods to quantify PD symptom severity, and the most widely used metric is the Unified Parkinson’s Disease Rating Scale (UPDRS) (Ramaker et al., 2002), which reflects the presence and severity of symptoms (but does not measure their underlying causes). Monitoring PD progression is critical because this enables improved patient-directed treatment. At present, PD monitoring has many shortcomings:
1) It requires the patient’s frequent physical presence in the clinic, which may be logistically and financially difficult both for the patients and their carers, especially in the later stages of the disease.
2) It requires the availability of expert clinical staff to do the tests and assess the patient‘s symptoms in order to determine the UPDRS score.
3) The UPDRS assessment is subjective and different expert clinical raters often do not agree on the reported scores (inter-rater variability) (Rajput et al., 1991; Hughes et al., 1993; Ramaker et al., 2002; Post et al., 2005).
4) It is costly for national health systems, which need to provide facilities to accommodate patients and allocate expensive human resources.
5) It is time-consuming, since the UPDRS examination normally lasts more than two hours (when assessing PD severity both ‗off‘ and ‗on‘ medication)
For all these reasons, currently, most PWP will only have UPDRS assessed once every three to six months, if at all, because of the scarcity of resources available to patient, carers, and clinical staff. Therefore, frequent, remote monitoring emerges as a compelling solution to accurately and efficiently follow PD progression at more frequent intervals with less cost and minimal waste of resources. Noninvasive telemonitoring is an emerging option in general medical care, potentially affording reliable, cost-effective screening of PWP, and potentially alleviating the burden of frequent, and often inconvenient, visits to the clinic. This also relieves national health systems from excessive additional workload, decreasing the cost and increasing the accuracy of clinical evaluation of the subject‘s condition.
Speech disorders have been linked to PD (Darley et al., 1969a; Gamboa et al., 1997; Ho et al., 2008), and there is strong supporting evidence of degrading performance in voice with PD progression (Harel et al., 2004; Skodda et al., 2009). Speech signals fit ideally the purpose of telemonitoring, because they are non-invasive, can be self-recorded, and are easy to obtain from a subject who is not expected to perform any special kinds of actions in order to record his voice. Differentiating PWP from healthy controls using speech has attracted interest in the research community (Harel et al., 2004; Sapir et al., 2010; Cnockaert et al., 2008; Little et al., 2009); in this study we also extend this concept to map the severity of voice-based PD symptoms to UPDRS. We also wanted to determine the feasibility of remote PD clinical trials on large scale voice data recorded in typical home acoustic environments, where previous studies have been limited to controlled acoustic environments and relatively small numbers of recordings (Little et al., 2009). Recent studies have raised the important topic of finding a statistical mapping between speech properties and UPDRS as an issue worthy of further investigation, but had not addressed it explicitly (Skodda et al., 2009; Goetz et al., 2009).
In this study, we will focus on both discriminating PWP from healthy controls, and also determining UPDRS using speech signals alone.
1.3
First-principles models versus data-driven models
Approaches to the mathematical modeling of data can be roughly divided into two categories: first-principles and data-driven (Little et al., 2006). Other terms have been introduced which essentially amount to the same thing: system model and signal model in the context of speech synthesis (Sinder, 1999), as well as white-box and black-box (common terminology in control applications)3. In all these cases, the first category employs physical principles that are believed to govern the modelled system, whereas the second develops some mathematical relationship, whose only constraint is that it must approximate as well as possible the measured data, without reference to any physical principles. Mathematical models have been used in practically all disciplines and there is vast literature for both categories; see for example Howison (2005) and Hastie et al. (2009).
First-principle models are increasingly popular in biology and medicine. Modelling specific organs and their interactions has attracted enormous interest aiming to discover the underlying mechanisms of certain physiological functions of the human body. Standard reference works for mathematical modelling in biology and physiology include Keener and Sneyd (1998), Ottesen et al. (2004), and Hoppensteadt and Peskin (2002). In the words of Ottesen: “Statistical analysis may discover correlations but may fail to provide insight into
the mechanisms responsible for these correlations. However, when it is combined with mathematical modelling of the dynamics, new insights into physiological mechanisms may be revealed” (Ottesen et al., 2004). Most importantly, the results of first-principle models can be more easily interpreted and understood by specialists who are not necessarily mathematically oriented and thus provides the means for multi-disciplinary interaction.
Nevertheless, the data-driven approach has its own importance and complements the first-principles approach. Data-driven models do not usually reveal insights into biological causes and functions with quite the same transparency as first-principles modelling, but often, it is the only practical thing that can be done, given the typical level of noise and other unknown sources of physiological and environmental variability that affect data recorded in real-world clinical experiments. Data-driven modelling can infer interesting structure in the data, which can sometimes have a meaningful tentative physiological interpretation. The discipline of data-driven inference is more widely known as statistical machine learning, and has led to many exciting discoveries. Stark and Hardy (2003) in their paper in Science conclude: “By
combining the best features of these two approaches in models that incorporate the main mechanisms underlying specific applications, today’s researchers can make far more
progress with practical problems than was hitherto possible. Perhaps modern biology, which argues about a choice between hypothesis- and data-driven research should heed this lesson. Neither approach provides the complete picture, and only the synergy between them is likely to lead to solutions to real world problems in an increasingly complex world.”
An additional, major point of controversy in statistical machine learning is whether one should be aiming to impose a parametric mathematical structure (e.g. a standard linear/nonlinear model) or simply allow the data itself define the structure (nonparametric). Both approaches are useful: a lively discussion on the topic can be read in Breiman (2001a).
1.4
Scope and structure of the thesis
This study is an investigation of signal processing and machine learning techniques for the extraction of clinically useful information from speech signals. The aim is both to differentiate PWP from healthy controls, and also to map average PD symptom severity to the
standard reference clinical metric UPDRS. We aim to infer properties of the speech signals, extracting useful distinguishing features which are altered as the orchestrated muscle movements involved in voice production become hindered due to the deterioration of neurological control attributed to dopaminergic neuron loss in the basal ganglia. The means by which we achieve this include: (a) developing novel speech signal processing algorithms, (b) the investigation of robust feature selection algorithms to identify the most useful feature subset, and (c) the subsequent exploitation of the feature subset to estimate UPDRS.
The thesis begins, in Chapter 2, with a concise description of the physiology of the nervous system and the systems responsible for the production of speech. It focuses particularly on the essential physiological concepts which are later addressed in the thesis in the data-driven signal processing methods. Chapter 3 provides a comprehensive literature review of the most popular clinical speech signal processing algorithms used in biomedical applications. In this chapter, we also develop novel extensions to known approaches and present some new algorithms to characterize some patterns that were not previously captured with existing methods. Chapter 4 identifies some mathematical and statistical tools widely-used in this context, and provides a short review of the machine learning techniques used later in this study. Moreover, it describes an effective machine learning methodology which is applicable to a wide range of problems dealing with high-dimensional data, the curse of dimensionality,
and the principle of parsimony4. Chapter 5 compares fundamental frequency estimation algorithms, using artificially generated speech signals where the ground truth fundamental frequency is known. Moreover, we demonstrate the potential of a novel ensemble approach which is, on average, 10% more accurate compared to the best individual fundamental frequency estimation algorithm. In addition, this chapter presents a comparison of the feature selection techniques described in Chapter 4 using widely used datasets in the literature.
4
Chapter 6 describes the speech-PD database used in this study, and identifies the most important confounding factors that need to be considered when inferring PD severity from speech signals. Chapter 7 brings together the information from the previous chapters: we use the signal processing algorithms introduced in Chapter 3, the machine learning methodology (presented in Chapter 4), and the findings in Chapter 5 to study the speech-PD databases presented in Chapter 6. The aim is to (a) study the binary discrimination of healthy controls from PWP, and (b) determine a functional relationship between speech and UPDRS. Chapter 8 draws conclusions and suggests areas of potential interest for future work.
1.5
Summary of contributions
This section summarizes the contributions of this study, and refers to the particular sections of the thesis where they can be found:
1. Development of an ensemble fundamental frequency estimation scheme, which gives 10% more accurate estimates compared to the best individual fundamental frequency estimator amongst the ten popular algorithms investigated in this study (§ 3.2.1.10). 2. Development of novel speech signal processing algorithms, which reveal additional
pathophysiological characteristics in the voice of PWP which were not previously captured by the available state of the art algorithms (§ 3.2.4).
3. Development of novel feature selection algorithms (§ 4.2.3). The first of these algorithms, which we refer to as Relevance, Redundancy, and Complementarity Trade-off (RRCT), is a fast correlation-based approach invoking some information theoretic concepts. RRCT is shown to outperform popular feature selection algorithms of comparable complexity in the literature. We also extend known feature
selection algorithms, for example, approaches which were originally proposed for binary classification problems to tackle multi-class classification problems.
4. Empirical evaluation of a wide range of state of the art algorithms for (a) fundamental frequency estimation in sustained vowels (§ 5.1), and (b) feature selection (§ 5.3).
5. This study reports results suggesting that it is possible to discriminate healthy controls from PWP with almost 99% accuracy (the current state of the art results are about 93% accuracy). This improvement is attributed to the novel pool of features proposed in this study (§ 7.1).
6. This study has shown, for the first time, that telemonitoring of average PD symptom severity (quantified using UPDRS) can be achieved remotely, objectively, and
accurately using speech signals (§ 7.3). We demonstrate that we can replicate UPDRS within about 1.6 points from the clinicians‘ estimates.
7. Development of two Matlab toolboxes for: (a) speech signal processing algorithms, and (b) statistical machine learning techniques. The speech signal processing toolbox includes implementations of a wide range of known, and novel, speech signal processing algorithms drawing on the methods described in Chapter 3. These speech signal processing algorithms were previously scattered across the research literature and some algorithms were made available in different software platforms; here they are presented for the first time in Matlab. The machine learning toolbox focuses on the techniques described in Chapter 4, including data visualization, feature selection, and mapping features to the response using an automated process. Both toolboxes are heavily annotated facilitating easy experimentation: good default values are automatically provided, but the annotations suggest a range of parameter values which can be optimized for specific applications.
Chapter 2
Essential physiological background
This chapter presents a concise synopsis of the physiological systems relevant to PD telemonitoring by speech signal processing, exploring the nervous system and speech production mechanisms. It also discusses critical aspects of life-span changes in speech, providing the basis for a fair comparison between age- and gender-matched PWP and healthy controls. Therefore, this chapter provides the critical physiological link between speech and PD, which is used to interpret the results of the later analyses in this study.
2.1
Nervous system
The nervous system consists of a sophisticated network of dedicated cells (neurons) that coordinate actions and transmit signals between different parts of the body. It is exceptionally complicated, and intensive research has revealed only a fraction of its functionality. The abundance of uncharted areas and speculative theories for regions of the brain and its various functional interconnections, suggest that we are still a long way from truly understanding how the nervous system works. The nervous system is responsible for processing sensory input (from the senses), coordinating movements towards the desired goal, and apparently all other cognitive functions.
On a large scale, neurologists often divide the nervous system into two parts, the central nervous system (CNS) and the peripheral nervous system (PNS). The CNS consists of the
brain and the spinal cord, the rest of the neuronal circuitry belongs to the PNS. For the purposes of this thesis we are primarily interested in the brain, since this is the pathophysiological locus of PD. We shall briefly describe the physiology of the basic unit of the brain (the neuron), and the basal ganglia, which is the brain structure believed to be affected in PD; the reader may wish to refer to the textbook of Guyton and Hall (2006) for a more elaborate discussion of nervous system physiology.
2.1.1 Physiology of the basic functional unit of the brain: the neuron
The nervous system comprises two main types of specialized cells, the neurons and the
glia. The neuron consists of the cell body (soma), which contains the nucleus, the axon
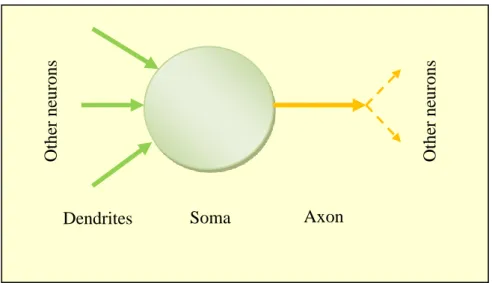
(neuron output) which is an electrically conducting fiber and leads to the nerve terminals, and the dendrites (neuron input) which receive signals from other neurons (see Fig. 2.1). The functionality of the glia is to assist, support, and protect neurons.
Fig. 2.1: Schematic diagram of a neuron, showing its main anatomical parts.
Dendrites Soma Axon
Othe r ne ur ons Othe r ne ur ons
The main communication system between neurons is achieved through electrical impulses (also known as nerve impulses, spikes and more commonly action potentials), which is a small amount of current travelling across the axon. The nerve impulse is the result of electrical discharge due to the sodium-potassium pump, and occurs when the neuron‘s
membrane has been sufficiently depolarised (15 mV above the normal resting voltage level of -70 mV).
2.1.2 The basal ganglia
The brain comprises billions of neurons, which apparently form functional and anatomical structures at various levels of organisation. The inter- and intra-interaction of these structures, as well as their detailed functional capacity is still a controversial subject and much is speculative. The basal ganglia (BG) is a group of highly interconnected anatomical structures positioned approximately in the middle of the brain, and is critically involved in muscle and cognitive control. The BG nuclei appear in two sets, in the left and right cerebral hemispheres. Most BG-directed research effort is motivated by its direct link to a wide range of disorders, including PD, Huntington‘s disease and schizophrenia. In addition, there is the possibility of extracting (invasive) data, known as Local Field Potentials (LFP), which quantify neuronal activity in regions within the brain.
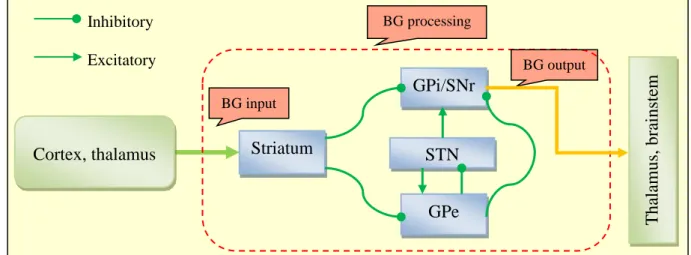
The BG consist of the striatum, the globus pallidus (GP) (subdivided into the internal segment GPi and the external segment GPe), the subthalamic nucleus (STN) and the
substantia nigra (which is further subdivided into the pars compacta (SNc) and pars reticulata (SNr)). The BG receive input into the striatum from the cortex and another brain region called thalamus, and project their output into the thalamus and the brainstem through the SNr and GPi. The interconnections between each pair of these BG nuclei are either
inhibitory or excitatory and are facilitated by the neurotransmitter dopamine, a substance produced by the dopaminergic cells. Fig. 2.2 shows the schematic functional architecture diagram and the interconnections of the BG according to Gurney et al. (2001a).
Fig. 2.2: Schematic diagram of the basal ganglia (BG) architecture, showing the input into the BG from the cortex and the thalamus, the BG processing, the BG output, and the interconnections between the BG nuclei. The abbreviations of the BG nuclei are explained in the text.
2.1.3 Parkinson’s disease: mechanisms, symptoms, diagnosis, and management
The aetiology (underlying cause) of PD is largely unknown (Lang and Lozano, 1998), but the symptoms are caused by substantial dopaminergic neuron reduction, leading to dysfunction of the BG which mediates motor and some cognitive abilities (Singh et al., 2007). The dopaminergic cells assist in neurotransmission (transmission of information between neurons); consequently their decline leads to malfunction of the CNS which can no longer co-ordinate muscle movements appropriately and delicately. The clinically noticeable symptoms appear when the disease has progressed considerably and about 60-80% of the dopaminergic
BG input BG output Striatum Cortex, thalamus BG processing GPi/SNr STN GPe Inhibitory Excitatory Tha lamus, bra inst em
cells have already died (Bernheimer et al., 1973); by that time it is too late to intercept the degradation. The evolution of the disease involves progressive dopaminergic loss which results in gradually more severe symptoms such as tremor and loss of muscle control.
The main symptoms are tremor, rigidity and movement disorders. Vocal impairment is also common (Hanson et al., 1984; Ho et al., 1998) and is met in approximately 70-90% PWP (Logemann, 1978; Hartelius and Svensson, 1994; Ho et al., 1998). Moreover, it may be one of the earliest indicators (Duffy, 2005) and 29% of patients consider it one of their greatest hindrances associated with the disease (Hartelius and Svensson, 1994). Typically, the symptoms initially appear unilaterally (on either the left or right side, indicating that dopaminergic loss is more pronounced in the BG of one of the brain hemispheres) but in time proceed bilaterally.
There is no consensus for diagnosing a patient with PD, which is the cause of many misdiagnoses (Lang and Lozano, 1998; Rajput et al., 2007). According to de Rijk et al. (1997) a patient should be diagnosed with PD if they fulfill at least two of the following three criteria: bradykinesia (slow movement), rigidity, and tremor. Additionally, if the individual is known to suffer from chronic essential tremor (kinetic tremor mostly in the arms, neck and jaw which is apparent during voluntary movement), then a PD diagnosis should be made if all three criteria are present (Rajput et al., 1993). The term idiopathic PD (Rajput et al., 1984), which means that the underlying cause of the observed symptoms is unknown, has been introduced to differentiate PD from other neurological disorders eliciting Parkinsonian characteristics5. These are known as Parkinsonism, and may be due to, for example, drugs or neurotoxins (Rajput et al., 1984; Bower, 1999; Baldereschi et al., 2000). Although accurate
pathophysiological classification (diagnosis of PD or some form of Parkinsonism) of subjects
5 Some studies separate idiopathic PD from the remaining Parkinsonism variants referring to it as IPD. In the
is extremely difficult, it has clinical importance and facilitates better treatment (Rajput et al., 2007).
Thanks to the use of pharmacopathological manipulation (drug treatment of PD), the mean life expectancy of PWP disease has increased significantly over the previous decades. Currently, it is estimated that a patient diagnosed with PD at the age of 62 is expected to live for about 20 more years (Rajput et al., 2007). Pharmaceutical (combinations of levodopa and other agents) and surgical interventions such as Deep Brain Stimulation (DBS) (Benabid et al., 2009) are documented to improve motor functionality and reduce tremor, delaying disease progression and offering reasonably good quality of life (Singh et al., 2007). Of relevance to this study, however, the impact of treatment on speech is inconclusive (Larson et al., 1994; Ho et al., 2008).
Management of PD involves the administration of physical examinations applying tests assessing the subject‘s ability to perform a range of tasks, and these tests are designed to enable the quantification and monitoring of disease progression. The UPDRS is the standard reference scale (Ramaker et al., 2002), approved by the Movement Disorders Society (MDS), and has lately been revised as the MDS-UPDRS scale (Goetz et al., 2008). This revision addresses some deficiencies of the current version, which were previously discussed in Goetz et al. (2003). UPDRS tests along with the indications the medical rater will use to score the subject‘s symptoms appear in Appendix II. The UPDRS metric consists of 44 sections6, where each section addresses different symptoms in different parts of the body and spans the range 0-4, with 0 denoting no symptoms and 4 severe impairment or problem. Summing up these 44 sections gives rise to the total-UPDRS score, which spans the range 0-176, with 0 representing perfectly healthy individual and 176 total disability.
6 Note that the UPDRS scale discussed in this thesis is for untreated patients because that is the kind of data used
The UPDRS metric can be divided in three major parts, which we will henceforth refer to as components: (1) Mentation, Behavior and Mood (MBM); (2) Activities of daily living (ADL); (3) Motor. The motor component (we will refer to it as motor-UPDRS) is comprised of sections 18-44 and ranges from 0-108, with 0 denoting symptom free and 108 severe motor impairment, and encompasses tasks such as speech, facial expression, tremor and rigidity. This component contributes most of the points in the UPDRS scale and many studies focus exclusively on that, because motor symptoms are often the most problematic and the most prominent aspect of PD. In this study we deal with both ‗motor-UPDRS‘ and ‗total-UPDRS‘. Alternative metrics monitoring PD progression may also be used, such as the Hoehn-Yahr
(H&Y) stage (Hoehn and Yahr, 1967), and recent studies have shown that it is possible to map UPDRS onto H&Y (Tsanas et al., 2012c).
As discussed above, dopaminergic depletion within the BG is the hallmark of PD, and clinicians often rely on brain scans in order to noninvasively reveal the subject‘s brain pathophysiology (structural and functional operational condition) so that they can augment their PD diagnosis. For a recent review of the current imaging methods refer to Brooks (2007). Nevertheless, although imaging biomarkers are measuring the relevant physiological process, they do not measure dopamine density, and therefore cannot be used as a monitoring tool (Ravina et al., 2005).
2.2
Speech related organs
Before proceeding with the discussion of the organs either directly or indirectly involved with the production of speech, it is appropriate to clarify some recurring concepts. Two terms which regularly occur in this thesis are speech and voice. They are often used interchangeably and in fact I. Titze asserts ―in the broader sense voice is synonymous with speech‖. However,
he also mentions that there is in fact a subtle difference and the term voice in its narrow definition refers only to the sound produced by the vocal organs (Titze, 2000). For the purposes of this thesis, they will be considered synonymous. Fig. 2.3 displays a simple schematic diagram of the major anatomical parts involved in the production of speech. The following sections described these anatomical parts in some detail.
2.2.1 Pulmonary system
The pulmonary system comprises the lungs and the respiratory airways (tubes which allow the passage of air from the atmosphere to the lungs and vice-versa). The lungs consist of millions of alveoli (air sacks connected together) and their primary role is to assist metabolism through respiration, i.e. the exchange of oxygen and carbon dioxide for the oxygenation of cells in the whole body. The lungs also provide the driving energy for the speech production system, the lung pressure, which is between 0.3-1.2 KPa in conversational speech (Titze, 2000). Speech production is dependent on air flow along the respiratory tract, originating in the lungs and travelling along the trachea.
Fig. 2.3: Schematic diagram of the major parts involved in the production of speech.
Origin of air flow
Lungs Trachea
F0 vibration
Vocal folds Vocal Tract
Nose Mouth Speec h si g nal
During inhalation (the inspiration phase) the lungs expand and air flows into the lungs; during exhalation (the expiration phase) the lungs collapse and the air flows out. These delicate movements of the inspiration and expiration phases are controlled by the diaphragm muscles (muscle structure at the lower part of the thorax, underneath the lungs), which expand and collapse7. Of direct relevance to this study, respiratory muscle control is known to be compromised in PWP (Apps et al., 1985), which partly explains why those subjects often fail to be able to produce prolonged vocal effort, by comparison to age- and gender-matched healthy speakers.
2.2.2 Vocal folds
The vocal folds (also known as vocal cords) are located above the trachea and across the larynx. The vagus nerve innervates (controls) the larynx muscles, and this nerve originates in the brain structure called the brainstem that is itself connected to the BG (Guyton and Hall, 2006). The vocal folds move backward and forward forming a self-sustained oscillator and thereby modulate the airflow from the lungs in the process of phonation as it travels through the glottis (airspace between the vocal folds). For a detailed explanation of the self-sustained vocal fold oscillation mechanism we refer to Titze (2000). We can examine vocal fold movement using electroglottography (EGG): this provides a signal recorded from a device that is placed externally to the larynx and detects glottal cycles while the subject is speaking.
Men and women have different vocal fold size, which causes different patterns of vibration, in particular the number of times the vocal folds vibrate during a second, i.e. the
frequency (in Hertz) of oscillation (Titze, 2000). The time taken for the vocal folds to complete one oscillation (cycle) is known as pitch period T, and the fundamental
7
frequency ⁄ . We will see that it is not possible to have an entirely rigorous definition of T because voice signals are never exactly periodic8, when we revisit the vocal fold vibration pattern in sustained vowels (see § 2.2.4). The time varying motion of the vocal folds can be described in the frequency domain, and consists of many harmonics in addition to . Sub-multiples of the true are known as sub-harmonics, and in healthy voices are kept to a minimum. The signal is often represented in the frequency domain to identify its main frequency components; the following chapter presents approaches to exploiting these. For now, we define two additional commonly occurring terms in the speech science discipline:
semitone difference and octave. The semitone difference between two arbitrary frequencies and is ( ⁄ ), and doubling the frequency is equivalent to rising by 12
semitones, where 12 semitones make up one octave (Baken and Orlikoff, 2000).
Research has shown that some PWP exhibit incomplete vocal fold closure and increased
breathiness during phonation (that is, their voice becomes dominated by noticeable breath noise) (Ho et al., 1998). The incomplete closure causes airflow vortex shedding to occur throughout the entire vocal fold vibration cycle, rather than just after the moment of vocal fold closure, causing increased turbulent noise. However, incomplete vocal fold closure and breath noise are not necessarily caused by some neurological deficit: they could be, for example, the result of a vocal fold tissue problem (such as a nodule). Vocal fold closure, which is required for normal phonation, is more complete in patients with PD symptoms confined to one side of the body only (Hanson et al., 1984). This may be one of the reasons why speech symptoms are less prominent in the earlier stages of the disease than in later stages. As we will see in the following chapter, most algorithms focus on the analysis of vocal fold-related problems because mathematically, algorithmically and computationally it is easier to extract signal characteristics related to the vocal fold vibration pattern.
8
2.2.3 Vocal Tract
The nose, mouth, tongue and lips are collectively referred to as the vocal tract. Whereas the vocal folds can be viewed as an oscillator, the vocal tract can be described as a resonator
that amplifies certain acoustic frequencies and attenuates others. Depending on its shape, the vocal tract enhances certain harmonics in the oscillation of the vocal folds which are known as formants, and these can be seen in a spectral analysis of voice recordings (Titze, 2000). The vocal fold-vocal tract interaction has often been referred to as the source-filter coupling in phonation (Titze, 2008), where the sound source is the vocal folds and the filter is the vocal tract. At least since the important work of Fant (1960), and probably even earlier, the source-filter relationship was assumed to be linear, i.e. the resulting speech signal was considered to be the result of the convolution of the vocal folds signal and the vocal tract signal. The linear source-filter theory gives interesting insights and is the basis for the vast majority of speech signal processing algorithms (see Chapter 3). However, relatively recently the linear assumption of the source-filter theory has been challenged, and these days research is focused on the nonlinear interaction between the vocal folds and the vocal tract (Titze, 2008). During phonation, for example, a portion of the air in the vocal tract is reflected back to the vocal folds when the vocal folds collide, due to the sudden supraglottal pressure (pressure just above the glottis) drop. The reflected air towards the vocal folds depends on the vocal tract shape; for further details we refer to the theory of acoustic wave propagation (Titze, 2000). Nevertheless, particularly for sustained vowels (see the following section) the source-filter theory may often be adequate (at least in healthy voices), which partly explains the widespread use of this theory in vocal quality assessment (Titze, 2000).
Although the correlation of vocal tract changes with PD has already been reported (Hanson et al., 1984; Logemann, 1978), evidence is fairly scarce compared to the investigation of the
effect of PD on the vocal folds. As we will see in Chapter 7, analysing vocal tract-related signal characteristics provides clinically useful information about PD status.
2.2.4 Sustained vowels
The use of sustained vowel phonations to assess the extent of vocal symptoms, where the subject is requested to hold the frequency of phonation steady for as long as possible, is common in general speech clinical practice (Titze, 2000) and has shown promising results in separating healthy controls from PWP (Cnockaert et al., 2008; Little et al., 2009, Tsanas et al., 2012b), and PD monitoring (Tsanas et al., 2010a; Tsanas et al., 2011a). Maximum phonation duration carries clinically useful information, and a healthy adult should be able to sustain his voice for about 20 seconds on average, although this depends on factors such as age, gender, body stature and general health condition (McNeil, 1997). Sustaining vowels builds on the idea that a healthy subject can elicit a stationary phonation, whereas a subject with some form of vocal impairment cannot (Titze, 2000). Informally, a stationary process does not change when shifted in time or place, and implies periodicity. In addition, using sustained vowels circumvents some of the confounding articulatory effects and linguistic components of
running speech (Schoentgen and Guchteneere, 1995), i.e. the recording of standard phrases. We adopt the typical convention in the speech science literature to represent sustained vowels using the vowel between slashes, e.g. for the sustained vowel ‗ahh…‘ we write /a/.
The sustained vowels /a/, /i/ and /u/9 are used in some clinical applications to assess vocal performance; however, most studies focus solely on the sustained vowel /a/ because this is the simplest sound to produce, and empirically has been found to convey the most clinically useful information (Titze, 2000). Physiologically, /a/ involves the delicate combination of a
9 These three vowels are known as corner vowels because of the extreme placements of the tongue; the reader is
variety of muscles in the vocal folds and the vocal tract, so it increases the probability that a neurological problem can be identified. Also, in /a/ the mouth is maximally open compared to other vowels, which minimizes the reflected air pulse back to the vocal folds; therefore the recorded SPL at the lips is maximized (Titze, 2000). Vowel sounds in speech have particular formant patterns, and are typically characterised by the two lowest frequency formants labeled and , which can be plotted on an chart. In particular for the vowel /a/, ranges between 600-1,300 Hz and between 900-1,600 Hz, but this is somewhat subject-dependent (Peterson and Barney, 1952).
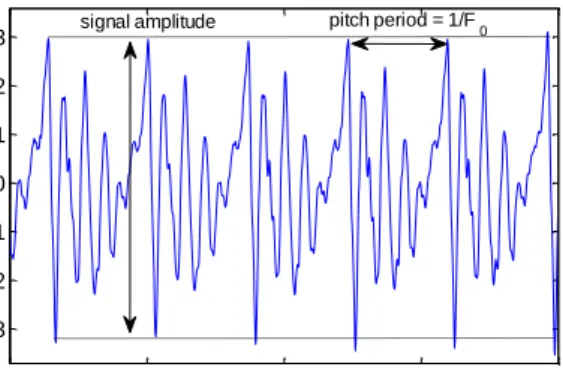
As an illustration of the concepts introduced above, Fig. 2.4 shows a typical sustained vowel /a/ phonation. Qualitatively, we note that the overall speech signal amplitude (difference of maximum and minimum values of the signal during a pitch period) is decaying towards zero (Fig. 2.4a). During the last seconds of the phonation, the amplitude tends to shrink, which is the result of lung collapse. Zooming in on the signal (Fig. 2.4b), we can extract the pitch period and the by observing the peaks between cycles (repetitions of the same pattern in the signal). This makes the tacit assumption that we can define T as the cycle-to-cycle interval, which corresponds to the exactperiodicity of the signal. But periodicity is a formal mathematical concept, and if we represent the speech signal as ( ), where is time, T should satisfy ( ) ( ) for all . In fact, periodicity does not actually apply to any real speech signal (Titze, 2000) since successive cycles are never exactly the same (Fig 2.4b), but this terminology pervades the speech science literature and will be used throughout this thesis. Slight disturbances in the pitch period are attributed to physiologic tremor in the laryngeal muscles, and are known as (smooth) vocal vibrato, suggesting that even speech signals from healthy people are not exactly periodic. We introduce the commonly used terms nearly periodic, to describe signals that deviate slightly from periodicity, and
Three additional, regularly recurring terms in the thesis are variability, perturbation and
fluctuation. These are general terms and apply in various fields, but in the context of this study they are typically used to describe the signal amplitude and . Variability is the ability of a quantity to vary, which in this study is used to discuss amplitude variation and
variation, and is usually considered between successive cycles. Perturbation is a minor disturbance or deviation from the expected norm (behavior) of a system, where the expected norm is typically considered to be the mean of some quantity. Fluctuation is a more severe disturbance than perturbation, and reflects an inherent instability in a system.
The and amplitude perturbations quantify departure from periodicity, and give rise to some of the most important methods for extracting clinically relevant information from speech signals, which are called dysphonia measures in the literature (or simply measures). However, since there is sufficient evidence suggesting that speech disorders are commonplace in PWP, caution should be exercised in assuming vocal cycle periodicity. As we shall see in Chapter 3, the most successful measures are those which do not assume periodic signals.
Fig. 2.4 (a) Typical sustained vowel /a/ phonation. The overall amplitude decays over the duration of the phonation (usually 10-30 seconds). (b) Magnified version of the same sustained vowel /a/ phonation to illustrate the signal amplitude and the signal period. The magnified signal is not exactly periodic, a concept we revisit later.
0 5 10 15 19 -0.3 -0.2 -0.1 0 0.1 0.2 0.3 Time (seconds) Amp lit u d e a 1 1.01 1.02 1.03 1.04 -0.3 -0.2 -0.1 0 0.1 0.2 0.3 Time (seconds) Amp lit u d e b
signal amplitude pitch period = 1/F
2.3
Life-span changes in physiology
A rigorous assessment of any kind of medical disorder will entail comparing a pathological group of patients with a control group that will typically be age- and gender-matched. Other factors such as subject profession and demographics may also be relevant. Aging is associated with a number of physiological changes of the major organs and organ systems, including the nervous system (Fearnley and Lees, 1991) and the speech production system (Titze, 2000).
Fearnley and Lees (1991) reviewed the physiological changes in neuronal loss with age, and compared healthy subjects and PWP examining the regional substantia nigra of the BG. They confirmed previous findings of neuronal loss in healthy controls with advancing age, and also found that PWP exhibited further decreased neural population numbers compared to their matched controls. These findings were later verified in neuro-imaging studies (Pirker et al., 2002). In addition, loss of muscle control in advanced age is very well documented (Laughton et al., 2003; Lewis, 2006).
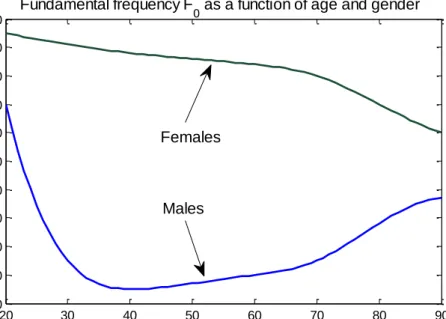
Our voices also tend to alter with age due to changes in laryngeal and vocal tract size, muscles which tend to ossify (turn to bone), various hormonal changes, and reduced nervous system control (Titze, 2000). Probably the most characteristic change of acoustic variable with age is in the . Fig. 2.5 shows the changes in with respect to gender for the ages 20-90 years. The trend is different in males and females, with monotonically decreasing in women, whereas decreases approximately until age 40 and subsequently increases for men. A recent paper confirms these findings, and stresses that reference intervals could be useful markers of laryngeal malfunction (Nishio and Niimi, 2008).
It is sensible to assume that the combination of neuronal and muscle control loss with age explains many of the general speech changes observed in the elderly, as suggested by Titze (2000). Furthermore, since control loss is exacerbated in PD due to dopaminergic neuron