Open Peer Review
Any reports and responses or comments on the article can be found at the end of the article.
RESEARCH NOTE
Evaluation of the scholastic performance of students in 12
programs from a private university in the south-west geopolitical
zone in Nigeria [version 1; peer review: 3 approved with
reservations]
Roseline O. Ogundokun
,
Marion O. Adebiyi
, Oluwakemi C. Abikoye
,
Tinuke O. Oladele , Adewale F. Lukman
, Abidemi E. Adeniyi
,
Adekanmi A. Adegun
, Babatunde Gbadamosi , Noah O. Akande
1Department of Computer Science, Landmark University, Omu-Aran, Kwara State, Nigeria Department of Computer Science, Covenant University, Ota, Ogun State, Nigeria Department of Computer science, University of Ilorin, Ilorin, Kwara State, Nigeria Abstract Cumulative grade point average (CGPA) is a system for calculation of GPA scores and is one way to determine a student's academic performance in a university setting. In Nigeria, an employer evaluates a student's academic performance using their CGPA score. For this study, data were collected from a student database of a private school in the south-west geopolitical zone in Nigeria. Regression analysis, correlation analysis, and analysis of variance (F-test) were employed to determine the study year that students perform better based on CGPA. According to the results, it was observed that students perform much better in year three (300 Level) and year four (400 Level) compared to other levels. In conclusion, we strongly recommend the private university to introduce program that will improve the academic performance of students from year one (100 level). Keywords Academics, Performance, Students, Science and Engineering, Private University, Programmes 1 1,2 3 3 1 1 1 1 1 1 2 3 Reviewer Status Invited Reviewers version 1 published 05 Feb 2019 1 2 3
report report report
, East Carolina University, Robert G. Carroll Greenville, USA 1 , North Dakota State Semiu Akanmu University, Fargo, USA Augustine University, Ilara_Epe, Nigeria 2 , N.E.D University of Engineering & Raheela Asif Technology, Karachi, Pakistan 3 05 Feb 2019, :154 ( First published: 8 ) https://doi.org/10.12688/f1000research.16762.1 05 Feb 2019, :154 ( Latest published: 8 ) https://doi.org/10.12688/f1000research.16762.1
v1
Page 1 of 11
Roseline O. Ogundokun ( )
Corresponding author: [email protected]
: Conceptualization, Investigation, Writing – Original Draft Preparation; : Conceptualization,
Author roles: Ogundokun RO Adebiyi MO
Investigation, Writing – Original Draft Preparation; Abikoye OC: Conceptualization, Methodology, Project Administration, Supervision; Oladele TO
: Conceptualization, Methodology, Project Administration, Supervision; Lukman AF: Investigation, Validation; Adeniyi AE: Data Curation, Software, Validation; Adegun AA: Writing – Review & Editing; Gbadamosi B: Writing – Review & Editing; Akande NO: Data Curation, Software, Validation
No competing interests were disclosed.
Competing interests:
This research received funding from Landmark University, Omu-Aran, Kwara State, Nigeria.
Grant information:
The funders had no role in study design, data collection and analysis, decision to publish, or preparation of the manuscript.
© 2019 Ogundokun RO . This is an open access article distributed under the terms of the ,
Copyright: et al Creative Commons Attribution Licence which permits unrestricted use, distribution, and reproduction in any medium, provided the original work is properly cited.
Ogundokun RO, Adebiyi MO, Abikoye OC
How to cite this article: et al.Evaluation of the scholastic performance of students in 12 programs from a private university in the south-west geopolitical zone in Nigeria [version 1; peer review: 3 approved with
F1000Research 2019, :154 ( )
reservations] 8 https://doi.org/10.12688/f1000research.16762.1
05 Feb 2019, :154 ( )
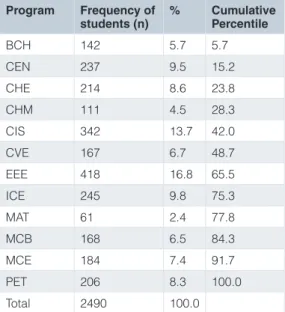
Table 1. Number of students who attended 12 programs at a private university in Nigeria.
Program Frequency of
students (n) % Cumulative Percentile
BCH 142 5.7 5.7 CEN 237 9.5 15.2 CHE 214 8.6 23.8 CHM 111 4.5 28.3 CIS 342 13.7 42.0 CVE 167 6.7 48.7 EEE 418 16.8 65.5 ICE 245 9.8 75.3 MAT 61 2.4 77.8 MCB 168 6.5 84.3 MCE 184 7.4 91.7 PET 206 8.3 100.0 Total 2490 100.0 Introduction
In the white-collar job market now, there is high competition among young graduates. Academic performance is one indi-cator that highlights university students’ qualification and this is mostly measured using the cumulative grade point average (CGPA). Most employers use CGPA to screen out candidates searching for jobs, and candidates with a higher CGPA are selected (Yogendra & Andrew, 2017). Therefore, the perform-ance of students in universities should be a concern not only to administrators and educators but also to corporations in the labor market.
Students have to place greater effort in their study to obtain a good grade in order to fulfil the demands of an employer and this makes academic achievement the main factor considered by employers in the recruitment of workers, especially newly grad-uated students (Yogendra & Andrew, 2017). The objective of the present study is to determine the study year that students perform better academically across 12 programs in a private university in the south-west geopolitical zone in Nigeria.
Methods
Primary data was extracted from Covenant University’s student database (John et al., 2018). The dataset contains the cumulative grade point averages (CGPA) from the first to the fourth year of study and the overall CGPA of students.
IBM Statistical Package for Social Sciences (IBM 20) was used to analyze the data of the scholastic performance of students in 12 programs at the College of Science and Engineering within the year 2010 to 2014. The statistical methodology includes regression analysis, analysis of variance (ANOVA), and descriptive statistics (Lukman et al., 2018).
Approval to use the data was obtained from the Ethical Commit-tee of Landmark University, which is affiliated with Covenant University.
Results
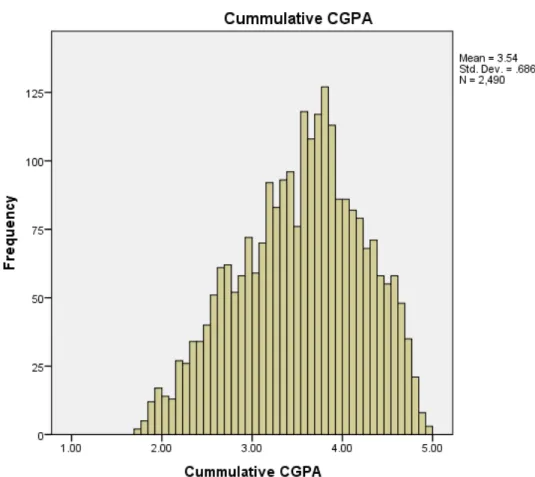
A total of 12 programs were assessed, which included 2490 students. The frequency distribution of the number of students who attended the twelve (12) programs and their graduation years are depicted in Table 1 and Table 2, respectively. The descrip-tive statistics are provided in Table 3. The results show that the mean performance of all the students at each of the level is not too different from each other. Figure 1 shows a histogram of the cumulative CGPA of students for the years 2010–2014. The dis-tribution of the data is skewed to the right which shows that a high number of the students have a CGPA that is between 2 and 5. The number of students with a CGPA that is less than 2 is low.
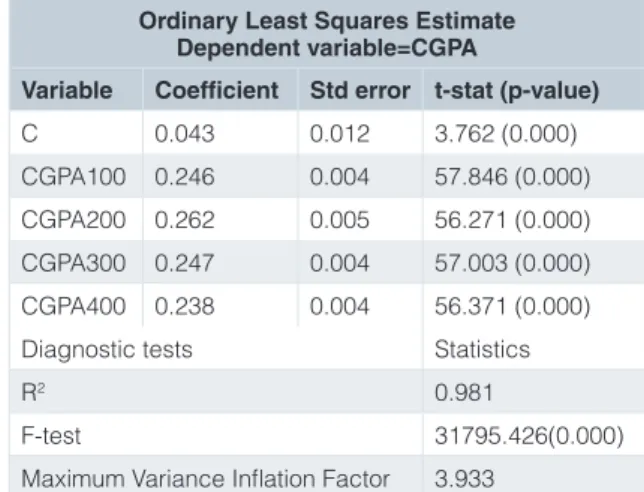
Table 4 shows the correlation matrix of the variables. The vari-ables include CGPA 100 level, CGPA 200 level, CGPA 300 level, CGPA 400 level, CGPA 500 level and the overall CGPA. A strong positive and significant relationships exist between CGPA in the different level and the overall CGPA. The coeffi-cient of determination (R2) in Table 5 shows that the cumulative grade point average in each level explained about 98.1% of the variations in the response variable (the overall CGPA). The F-test shows that the overall regression model is significant (P-value=0.000<0.05). It was also observed that each of the variables has a positive and significant impact on the overall CGPA. The performance of the students in 200 level is more significant (See Table 5). The maximum variance inflation fac-tor shows that none of the variables is correlated (See Table 5). Results show that overall performance of each student depends on their academic performance in each level.
Table 3. Descriptive Statistical Table for Program of Study, Graduation Year, Level CGPA and the Cumulative CGPA for 2010–2014.
N Minimum Maximum Mean Std.
Deviation Statistic Statistic Statistic Statistic Std. Error Statistic
CGPA100 2490 1.59 5.00 3.7390 .01299 .64831
CGPA200 2490 1.21 5.00 3.3448 .01545 .77112
CGPA300 2490 .63 5.00 3.4353 .01749 .87290
CGPA400 2490 .00 5.00 3.5713 .01594 .79547
CGPA500 2490 1.73 4.99 3.5379 .01374 .68576
Figure 1. Histogram for students’ cumulative grade point averages between 2010 and 2014 at a private university in Nigeria. Table 2. Number of students who graduated
from a private university in Nigeria between 2010–2014.
Year Frequency of
students (n) % Cumulative Percent
2010 439 17.6 17.6 2011 362 14.5 32.2 2012 576 23.1 55.3 2013 636 25.5 80.8 2014 477 19.2 100.0 Total 2490 100.0
Table 4. Correlation Analysis output.
GPA100 GPA200 GPA300 GPA400 CGPA
CGPA100 Pearson Correlation 1 .718** .605** .583** .795** Sig. (2-tailed) .000 .000 .000 .000 N 2490 2490 2490 2490 2490 CGPA200 Pearson Correlation .718** 1 .788** .718** .907** Sig. (2-tailed) .000 .000 .000 .000 N 2490 2490 2490 2490 2490 CGPA300 Pearson Correlation .605** .788** 1 .812** .911** Sig. (2-tailed) .000 .000 .000 .000 N 2490 2490 2490 2490 2490 CGPA400 Pearson Correlation .583** .718** .812** 1 .878** Sig. (2-tailed) .000 .000 .000 .000 N 2490 2490 2490 2490 2490 CGPA Pearson Correlation .795** .907** .911** .878** 1 Sig. (2-tailed) .000 .000 .000 .000 N 2490 2490 2490 2490 2490
**.Correlation is significant at the 0.01 level (2-tailed).
Table 5. Regression Analysis results. Ordinary Least Squares Estimate
Dependent variable=CGPA
Variable Coefficient Std error t-stat (p-value)
C 0.043 0.012 3.762 (0.000)
CGPA100 0.246 0.004 57.846 (0.000)
CGPA200 0.262 0.005 56.271 (0.000)
CGPA300 0.247 0.004 57.003 (0.000)
CGPA400 0.238 0.004 56.371 (0.000)
Diagnostic tests Statistics
R2 0.981
F-test 31795.426(0.000)
Maximum Variance Inflation Factor 3.933
*P-value in the parenthesis.
Conclusion
In this report, we have analyzed the performance of students in 12 programs at a private university in Nigeria. From the vari-ous analysis carried out, it was observed that a large number of students graduated in 2013, and from the 12 programs students of electrical and electronic engineering have the high-est percentage of graduate students. The descriptive statistics show that the mean performance of all the students at each of the level is not too different from each other. The performance of the student at each level is pivotal to their overall CGPA. In conclusion, we strongly recommend the private university to introduce program that will improve the academic performance of students from year one (100 level).
Data availability
Zenodo: Dataset on the academic performance of students in 12 programmes from a private university, http://doi.org/10.5281/ zenodo.1482513 (Oluwaseun et al., 2018).
Grant information
This research received funding from Landmark University, Omu-Aran, Kwara State, Nigeria.
The funders had no role in study design, data collection and analysis, decision to publish, or preparation of the manuscript.
References
John TM, Badejo JA, Popoola SI, et al.: The role of gender on academic performance in STEM-related disciplines: Data from a tertiary institution. Data Brief. 2018; 18: 360–374.
PubMed Abstract |Publisher Full Text |Free Full Text
Lukman AF, Adebimpe O, Onate CA, et al.: Data on expenditure, revenue, and economic growth in Nigeria. Data Brief. 2018; 20: 1704–1709.
PubMed Abstract |Publisher Full Text |Free Full Text
Oluwaseun OR, Oluwabunmi AM, Abikoye CO, et al.: Dataset on the academic
performance of students in 12 programmes from a private university [Data set]. Zenodo. 2018.
http://www.doi.org/10.5281/zenodo.1482513
Yogendra N, Andrew A: A Study on The Factors Influencing on Grade Point Average (GPA) With Special Reference to Third Year Commerce and Management Students of Eastern University, Sri Lanka. J Stud Man Plann. 2017; 3(8): 409–425.
Open Peer Review
Current Peer Review Status:
Version 1
09 August 2019 Reviewer Report
https://doi.org/10.5256/f1000research.18322.r44048
© 2019 Asif R. This is an open access peer review report distributed under the terms of the Creative Commons Attribution
, which permits unrestricted use, distribution, and reproduction in any medium, provided the original work is Licence properly cited. Raheela Asif Department of Computer Science & Software Engineering, N.E.D University of Engineering & Technology, Karachi, Pakistan
Is the work clearly and accurately presented and does it cite the current literature?
Literature review doesn't (directly) lead to the work of this study. Authors should provide an extensive and detailed literature review, which demonstrates their extensive knowledge in the research field and the recognition of the existing achievements in the area.
Is the study design appropriate and is the work technically sound?
The authors should also explain the main differences between their research and the previous achievements.
The final conclusions provided in the paper are not clearly formulated and correspond to the presented research results. Further steps of the performed research should also be identified by the authors.
Is the work clearly and accurately presented and does it cite the current literature?
Partly
Is the study design appropriate and is the work technically sound?
Partly
Are sufficient details of methods and analysis provided to allow replication by others?
Yes
If applicable, is the statistical analysis and its interpretation appropriate?
Yes
Are all the source data underlying the results available to ensure full reproducibility?
Yes
Are the conclusions drawn adequately supported by the results?
Are the conclusions drawn adequately supported by the results?
Yes
No competing interests were disclosed.
Competing Interests:
Reviewer Expertise: Educational Data Mining
I confirm that I have read this submission and believe that I have an appropriate level of expertise to confirm that it is of an acceptable scientific standard, however I have significant reservations, as outlined above.
05 July 2019 Reviewer Report
https://doi.org/10.5256/f1000research.18322.r50772
© 2019 Akanmu S. This is an open access peer review report distributed under the terms of the Creative Commons
, which permits unrestricted use, distribution, and reproduction in any medium, provided the original Attribution Licence work is properly cited. Semiu Akanmu School of Computing, University Utara Malaysia, Sintok, Malaysia
Citing relevant literature:
I find the in-text citations extremely scanty. The introduction which should weave the justification(s) of the study in specific terms and how it intends to attend to either a practical problem or/and a theoretical problem is inadequate. Explanations provided in the Introduction section generally addressed why "the performance of students should be of concern", not specifically why an investigation of the relationship between the study year and student grade should be conducted. Perhaps, and this should be justified in the literature, it is (a) to be able to design a level-specific intervention program that would support academic performance, (b) to serve as foundation for future studies that would identify factors that contribute to the positive or negative influence of a study level on the student grade. There is a slight mention of this in the concluding sentence, but more emphasis on the "why this study?" should be made known at the Introduction section. In the same vein, there should be clearer definitions of GPA and CGPA (on level basis and as overall), their relationship, probably in mathematical terms.
Design of the study, methodology and data analysis:
The concluding part of the Introduction section reads that " The objective of the present study is to determine the study year that students perform better academically across 12 programs" which best informs the choice of descriptive and the correlation analysis. Regression is therefore unnecessary because it accounts for influence of a variable on the other, and it must be with adequate attention to all latent and confounding variables. I also did not see ANOVA, though mentioned in the methods, in the data analysis. If it would be needed, there should thorough reading of its justification and how best it suits this work. I will suggest reading Julie
1. 2. there should thorough reading of its justification and how best it suits this work. I will suggest reading Julie Pallant's Guide to Using SPSS for further insights. Also, Variance Inflation Factor (VIF) is wrongly interpreted. Therefore, this statement "The maximum variance inflation factor shows that none of the variables is correlated" cannot be correct because (a) it contradicts an earlier statement that "A strong positive and significant relationships exist between CGPA in the different level and the overall CGPA", and (b) does not explain variance, which is square of the standard deviation, in view of understanding the variables' multi-collinearity. Note that correlation is synonymous to relationship, and it does not mean Variance in statistical terms.
Discussion and Conclusion:
The conclusion, since it ordinarily relied heavily on the data analysis and literature cannot be said to be adequate. There are no past related studies to situate the findings of this study and establish the fresh insights it attempts bring forth. This requires a Discussion section. A better analysis and inferences would then address the concluding section. Required corrections: Review 5 -10 past related studies to partly support your introduction, especially the justification of the study in specific terms, and as literature to situate your findings in a discussion section. Stick to "finding relationship", thus, descriptive correlation analyses would be sufficient. These, however, must be done thoroughly with report on data treatment and cleansing, and justification of the suitability of the statistical method.
Is the work clearly and accurately presented and does it cite the current literature?
Partly
Is the study design appropriate and is the work technically sound?
Partly
Are sufficient details of methods and analysis provided to allow replication by others?
Partly
If applicable, is the statistical analysis and its interpretation appropriate?
Partly
Are all the source data underlying the results available to ensure full reproducibility?
Yes
Are the conclusions drawn adequately supported by the results?
Partly
No competing interests were disclosed.
Competing Interests:
Reviewer Expertise: Empirical methods in software engineering and information systems.
I confirm that I have read this submission and believe that I have an appropriate level of
I confirm that I have read this submission and believe that I have an appropriate level of expertise to confirm that it is of an acceptable scientific standard, however I have significant reservations, as outlined above.
01 May 2019 Reviewer Report
https://doi.org/10.5256/f1000research.18322.r47348
© 2019 Carroll R. This is an open access peer review report distributed under the terms of the Creative Commons
, which permits unrestricted use, distribution, and reproduction in any medium, provided the original Attribution Licence work is properly cited. Robert G. Carroll Brody School of Medicine, East Carolina University, Greenville, NC, USA This paper describes the grade point average variances in students enrolled in a private university during a 5 year period. Analysis revealed that grade point averages were not significantly different based on program of study. The cumulative grade point average, a number derived from the grade point average in each year, was significantly correlated with each of the component year grade point averages. Tables 1 and 2 include a column for cumulative percent, which does not add any useful information, and can be deleted. The rightward shift in figure 1 may be explained by dismissal of students with low GPAs -but no indication of dismissal/attrition is indicated in the manuscript. The conclusion in the abstract that students perform much better in level 3 and 4 do not appear supported by table 3, and is not mentioned in the Conclusion section of the paper .
Is the work clearly and accurately presented and does it cite the current literature?
Yes
Is the study design appropriate and is the work technically sound?
Partly
Are sufficient details of methods and analysis provided to allow replication by others?
Yes
If applicable, is the statistical analysis and its interpretation appropriate?
Partly
Are all the source data underlying the results available to ensure full reproducibility?
Yes
Are the conclusions drawn adequately supported by the results?
Partly
No competing interests were disclosed.
Competing Interests:
I confirm that I have read this submission and believe that I have an appropriate level of expertise to confirm that it is of an acceptable scientific standard, however I have significant reservations, as outlined above.
The benefits of publishing with F1000Research: Your article is published within days, with no editorial bias You can publish traditional articles, null/negative results, case reports, data notes and more The peer review process is transparent and collaborative Your article is indexed in PubMed after passing peer review Dedicated customer support at every stage For pre-submission enquiries, contact [email protected] Page 11 of 11