Developing Tools for Determination of Parameters Involved
in CO
2Based EOR Methods
by © Mohammad Ali Ahmadi
Thesis Submitted to the School of Graduate Studies in partial fulfillment of the requirements for the degree of
Master of Engineering in Oil and Gas Engineering/Faculty of Engineering and Applied Science
Memorial University of Newfoundland
September 2017
II
Table of Contents
Acknowledgment ... VII Nomenclatures ... VIII List of Tables ... XII List of Figures ... XIII
Chapter one: Introduction ... 1
1.1. Background ... 1
1.2. Research Objective and Scope ... 3
1.3. Thesis Organization ... 3
References ... 5
Chapter Two: Literature Review ... 7
Abstract ... 7
2.1. Introduction ... 7
2.2. A review on CO2 injection processes/operations across the world ... 11
2.3. Field experience of CO2 injection processes for underground formations ... 19
2.4. CO2 injection into underground formations: Description and Mechanisms ... 23
2.4.1. Miscible CO2 Injection ... 23
2.4.1.1. First Contact Miscibility... 24
2.4.1.2. Multiple Contact Miscibility ... 24
2.4.1.2.1. Vaporizing Gas Drive Mechanism ... 25
2.4.1.2.2. Condensing Gas Drive Mechanism ... 25
2.4.2. Immiscible CO2 Injection ... 26
2.5. Theoretical and practical Challenges of Experimental works/tests related to CO2 injection ... 28
2.6. Theoretical challenges of modeling works to simulate CO2 injection into underground formation ... 32
III
2.7. Practical Challenges for implementation of CO2 injection into underground
formations... 40
2.8. Economic prospects of CO2 injection into underground formations ... 42
2.9. Environmental aspects of CO2 injection into underground formations ... 44
2.10. Conclusions ... 46
References ... 47
Chapter Three: Equilibrium Ratio of Hydrocarbons and Non-Hydrocarbons at Reservoir Conditions ... 68
Abstract ... 68
3.1. Introduction ... 69
3.2. Experimental Methodology ... 71
3.3. Theory ... 72
3.3.1. Least Square Support Vector Machine (LSSVM) ... 72
3.3.2. Genetic Algorithm (GA) ... 74
3.4. Modeling Methodology ... 74
3.5. Results and Discussion ... 78
3.5.1. Experimental Results ... 78
3.5.2. Modeling Results ... 83
References ... 97
Chapter Four: Minimum Miscibility Pressure of CO2-Oil System in Miscible Gas Flooding Processes... 100
Abstract ... 100
4.1. Introduction ... 100
4.2. Methodology ... 102
4.2.1. Genetic Programming ... 102
4.2.2. Gene Expression Programming (GEP) ... 104
IV
References ... 118
Chapter Five: Hybrid Connectionist Model Determines CO2-Oil Swelling Factor .. 127
Abstract ... 127
5.1. Introduction ... 127
5.2. Theory ... 131
5.2.1. Least-squares support vector machine (LSSVM) ... 131
5.2.2. Genetic Algorithm ... 133
5.2.3. Data Gathering ... 134
5.2.4. Methodology ... 134
5.3. Results and Discussion ... 136
References ... 151
Chapter Six: Developing a Robust Proxy Model of CO2 Injection ... 160
Abstract ... 160
6.1. Introduction ... 161
6.2. Methodology ... 163
6.2.1. Characterization of the Reservoir Model ... 163
6.2.2. Least Square Support Vector Machine (LSSVM) ... 165
6.2.3. Genetic Algorithm (GA) ... 167
6.3. Proxy Model Development ... 170
6.4. Results and Discussion ... 173
6.4.1. Proxy Model ... 173
6.4.2. Validity of the Proxy Model ... 184
6.4.3. Limitations of the Proxy Model... 185
References ... 186
Chapter Seven: Conclusions and Recommendations ... 193
7.1. Conclusions ... 193
V
7.1.2. Equilibrium Ration Determination ... 195
7.1.3. Determining CO2-Oil Swelling Factor ... 196
7.1.4. Proxy Model Development ... 197
VI Abstract
To mitigate the effects of climate change, CO2 reduction strategies are suggested to lower anthropogenic emissions of greenhouse gasses owing to the use of fossil fuels. Consequently, the application of CO2 based enhanced oil recovery methods (EORs) through petroleum reservoirs turn into the hot topic among the oil and gas researchers. This thesis includes two sections. In the first section, we developed deterministic tools for determination of three parameters which are important in CO2 injection performance including minimum miscible pressure (MMP), equilibrium ratio (Ki), and a swelling factor of oil in the presence of CO2. For this purposes, we employed two inverse based methods including gene expression programming (GEP), and least square support vector machine (LSSVM). In the second part, we developed an easy-to-use, cheap, and robust data-driven based proxy model to determine the performance of CO2 based EOR methods. In this section, we have to determine the input parameters and perform sensitivity analysis on them. Next step is designing the simulation runs and determining the performance of CO2 injection in terms of technical viewpoint (recovery factor, RF). Finally, using the outputs gained from reservoir simulators and applying LSSVM method, we are going to develop the data-driven based proxy model. The proxy model can be considered as an alternative model to determine the efficiency of CO2 based EOR methods in oil reservoir when the required experimental data are not available or accessible.
VII Acknowledgment
My deepest gratitude is to my supervisors, Dr. Sohrab Zendehboudi and Dr. Lesley James, for holding me to a high research standard and teaching me how to conduct successful research. I am especially thankful to Dr. Sohrab Zendehboudi for his friendship and for sharing his vast experience and knowledge over the past year.
I would like to acknowledge the financial support provided by Memorial University of Newfoundland, Statoil Company of Canada, and Natural Sciences and Engineering Research Council (NSERC) of Canada.
Most importantly, none of this would have been possible without the love and patience of my family, especially my mother and father.
VIII Nomenclatures
Abbreviations
AARD = average absolute relative deviation ACE = Alternating conditional expectations ARD = Average Relative Deviation
BBU = Bubble Break-Up BOP = Break-Over Pressure BRH = Bubble-Rising Height BRV = Bubble-Rising Velocity
CCE = Constant Composition Experiment CIT = Critical Interfacial Thickness CPU = Central Process Unit
EOR = Enhanced Oil Recovery EOS = Equation of State ET = Expression Tree
FID = flame ionization detector GA = Genetic algorithm
GC = gas chromatography
GEMC = Gibbs Ensemble Monte Carlo GEP = Gene Expression Programming GOR = Gas to Oil Ratio
GP = Genetic Programming IFT = Interfacial Tension
LCC = Linear Correlation Coefficient LM = Levenberg–Marquardt
IX
LPG = Liquefied Petroleum Gas LPG = Liquefied Petroleum Gas
LSSVM = Least Squares Support Vector Machine MAE = Maximum Absolute Error
MM = Million
MMP = Minimum Miscibility Pressure MRI = Magnetic Resonance Imaging MMSCF = Million Standard Cubic Feet MSE = Mean Squared Error
M-SIMPSA = Simplex Simulated Annealing Algorithm NMR = Nuclear Magnetic Resonance
NPV = Net Present Value OOIP = Original Oil in Place ORF = Oil Recovery Factor QP = Quadratic programming RBA = Rising bubble apparatus RBF = Radial basis function RF = Recovery Factor SCF = Standard Cubic Feet
SLT = Statistical Learning Theory SR = Standardized Residual STB = Stock Tank Barrel SVM = Support vector machine SVR = Support Vector Regression
X
TCD = thermal conductivity detector VIT = Vanishing interfacial tension VIT = Vanishing Interfacial Tension WAG = Water Alternating Gas
Variables
ci
P
= critical pressure of ith component (psi) Pk = convergence pressure (psi)
i
= acentric factor ith component
ci
T
= critical temperature ith component (oR) Tb = boiling point temperature (oR)
𝑒𝑘 = the regression error
𝑥𝑘 = kth input data in the input space
𝛼𝑘 = Lagrange multipliers n = space’s dimension P = Pressure (psia) T = Temperature (oR)
T = Temperature, (F) (For Swelling Factor)
yk = output value for a specified input variable (i.e. 𝑥𝑘)
𝑏 = a term of bias
𝓌 = the vector of weight
𝛾 = the regularization parameter σ2 = kernel sample variance
XI
MMP = minimum miscible pressure in MPa
T = the reservoir temperature in o F
Tcm = the pseudo-critical temperature
Mw = the molecular weight of C5+ crude
R2 = Coefficient of determination
XII List of Tables
Table 1-1: Organization of the thesis ... 4
Table 3-1: Performance of GA-LSSVM method with optimized parameters for prediction of equilibrium ratio (Ki) of hydrocarbons and non-hydrocarbons in terms of statistical parameters ... 83
Table 4-1: Statistical parameters of the utilized minimum miscible pressure (MMP) data ... 108 Table 4-2: The Gene Expression Programming (GEP) parameters utilized in computational steps ... 114
Table 5-1: Correlations and models for calculating CO2-oil swelling factor ... 130 Table 5-2: Statistical parameters of the data points [43, 59-62] used for developing LSSVM model ... 134 Table 5-3: Performance of GA-LSSVM method with optimized parameters for prediction swelling factor in terms of statistical parameters. ... 139
Table 6-1: Ranges of the proxy model input parameters ... 171 Table 6-2: Box–Behnken designs for CO2 injection... 172 Table 6-3: Simulation results, proxy model outputs, and errors of the predicted RF 183 Table 6-4: Statistical parameters of the outputs gained from the proxy model developed in this study for miscible CO2 injection ... 184
XIII List of Figures
Figure 1-1: EOR classification [5] ... 2
Figure 2-1: Schematic of visual phase behavior experiment[37] ... 12 Figure 2-2: Schematic of micromodel visualization apparatus for EOR purposes [38] ... 14 Figure 2-3: Schematic of slim tube experiment [47] ... 15 Figure 2-4: Schematic of core displacement test [17] ... 17 Figure 2-5: Effect of reservoir temperature and pressure on CO2—enhanced oil recovery [101] ... 28
Figure 3-1: Flowchart of hyper parameters selection based on GA ... 76 Figure 3-2: Measuredequilibrium ratio (Ki) for hydrocarbon gases versus pressure at T= 663 oR and GOR = 293 SCF/STB ... 79 Figure 3-3: Measuredequilibrium ratio (Ki) for hydrocarbon gases versus pressure at T= 672 oR and GOR = 321 SCF/STB ... 79 Figure 3-4: Measuredequilibrium ratio (Ki) for hydrocarbon gases versus pressure at T= 735 oR and GOR = 1217 SCF/STB ... 80 Figure 3-5: Measuredequilibrium ratio (Ki) for H2S versus pressure at different GORs ... 81 Figure 3-6: Measuredequilibrium ratio (Ki) for N2 versus pressure at different GORs ... 82 Figure 3-7: Measuredequilibrium ratio (Ki) for CO2 versus pressure at different GORs ... 82
XIV
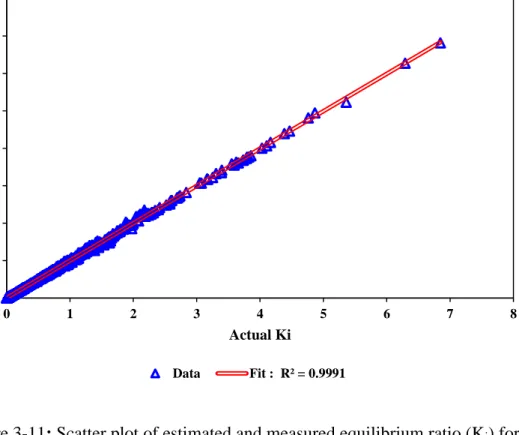
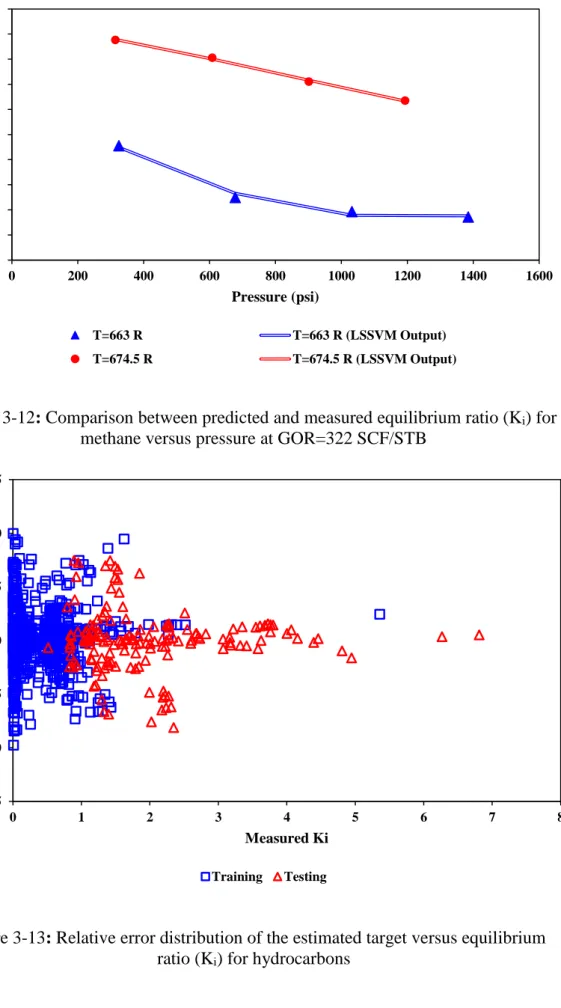
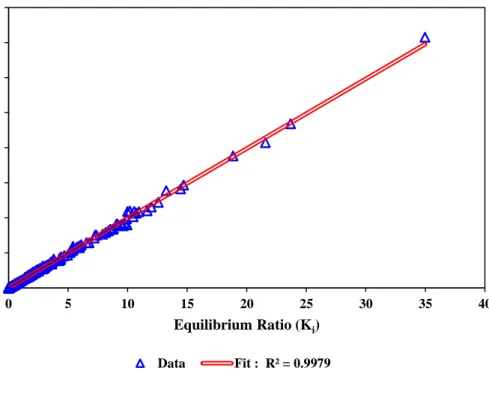
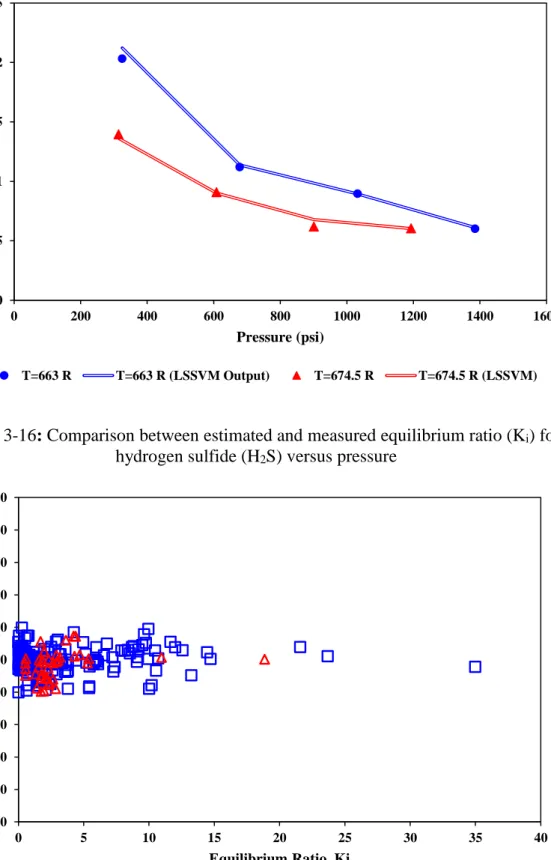
Figure 3-8: Measuredequilibrium ratio (Ki) for methane versus pressure at GOR=322 SCF/STB ... 84 Figure 3-9: Measured equilibrium ratio (Ki) for methane versus pressure at T=663 oR ... 84 Figure 3-10: Comparison between estimated and measured equilibrium ratio (Ki) for hydrocarbons versus data index ... 85 Figure 3-11: Scatter plot of estimated and measured equilibrium ratio (Ki) for hydrocarbons ... 86 Figure 3-12: Comparison between predicted and measured equilibrium ratio (Ki) for methane versus pressure at GOR=322 SCF/STB ... 87 Figure 3-13: Relative error distribution of the estimated target versus equilibrium ratio (Ki) for hydrocarbons ... 87 Figure 3-14: Comparison between estimated and measured equilibrium ratio (Ki) for non-hydrocarbons versus data index ... 88 Figure 3-15: Scatter plot of estimated and measured equilibrium ratio (Ki) for non-hydrocarbons ... 89 Figure 3-16: Comparison between estimated and measured equilibrium ratio (Ki) for hydrogen sulfide (H2S) versus pressure ... 90 Figure 3-17: Relative error distribution of the estimated target versus equilibrium ratio (Ki) for non-hydrocarbons ... 90 Figure 3-18: Scatter plot of estimated and measured equilibrium ratio (Ki) via Wilson model for a) non-hydrocarbons and b) hydrocarbons ... 92 Figure 3-19: Scatter plot of estimated and measured equilibrium ratio (Ki) while using standing model for a) non-hydrocarbons and b) hydrocarbons ... 93
XV
Figure 3-20: Comparison between the mean squared errors of used models for prediction of equilibrium ratio (Ki) for a) non-hydrocarbons and b) hydrocarbons .... 94 Figure 3-21: Comparison between the mean absolute errors of used models for prediction of equilibrium ratio (Ki) for a) non-hydrocarbons and b) hydrocarbons .... 95 Figure 3-22: Comparison between the relative importance of the parameters on the equilibrium ratio (Ki) of both hydrocarbon and non-hydrocarbons ... 96
Figure 4-1: A typical parse tree that demonstrates an algebraic expression formed by a two-gene chromosome [(X/Y)*(XY)]. ... 104 Figure 4-2: A typical algebraic equation [(X-Y)+(XY)] represented in a Karva Language program. This operation conducted through a two-gene chromosome demonstrates the GEP strategy. ... 106 Figure 4-3: Graphical demonstration of GEP method ... 107 Figure 4-4: Input variables used for development of a new MMP correlation through implementation of the GEP ... 109 Figure 4-5: Comparison of experimental and predicted MMP by a) Lee’s model b) Yelling & Metcalfe model c) Orr & Jensen model d) Glaso’s model e) Alston et al. model... 112 Figure 4-6: Comparison between modeling results obtained from the proposed tool and actual MMP ... 115 Figure 4-7: Effectiveness of the GEP strategy in determining MMP in terms of R2. 116 Figure 4-8: Models’ performance: Effect of temperature on MMP ... 116 Figure 4-9: Models’ performance: Effect of volatile-to-intermediate ratio on MMP117 Figure 4-10: Mean squared error while estimating MMP by all models ... 117
XVI
Figure 5-1: The flowchart of hyperparameters selection based on GA ... 136 Figure 5-2: Swelling factor of CO2-light oil system versus corresponding pressure at different temperatures [43, 59-62] ... 137 Figure 5-3: Swelling factor of CO2-intermediate oil system versus corresponding pressure at different temperatures [43, 59-62] a) API=33.3 b) API=29.4 ... 138 Figure 5-4: Swelling factor of CO2-heavy oil system versus corresponding pressure at different temperatures [43, 59-62] ... 138 Figure 5-5: Comparison between estimated and measured Swelling factor versus data index a) Training data b) Testing data ... 140 Figure 5-6: Scatter plot of estimated and measured Swelling factor a) training data b) testing data c) whole data ... 142 Figure 5-7: Comparison between calculated and measured Swelling factor versus corresponding pressure at different temperatures ... 143 Figure 5-8: Relative error distribution of the estimated target versus Swelling factor ... 144 Figure 5-9: Scatter plot of estimated data using Simon-Graue [42] method and measured Swelling factor ... 145 Figure 5-10: Scatter plot of estimated data using Emera and Sarma [44] correlation and measured Swelling factor ... 146 Figure 5-11: Comparison between maximum absolute error between the predicted values and experimental ones ... 147 Figure 5-12: Comparison between average absolute relative deviation between the predicted values and experimental ones ... 148
XVII
Figure 5-13: Detection of the possible doubtful measured Swelling factor and the applicability domain of the suggested approach for the CO2-oil swelling factor. The H* value is 0.0555 ... 149 Figure 5-14: Relative importance of the independent variables affecting swelling factor ... 150
Figure 6-1: 3D view of distribution for the a) oil saturation b) porosity c) permeability d) reservoir pressure for the synthetic reservoir used in this study ... 165 Figure 6-2: Schematic of the hyper-parameters optimization using genetic algorithm ... 169 Figure 6-3: Schematic of the proxy model development strategy ... 172 Figure 6-4: Recovery factor of miscible CO2 injection versus the corresponding BHP of injection well ... 174 Figure 6-5: Recovery factor of miscible CO2 injection versus the corresponding BHP of production well ... 175 Figure 6-6: Recovery factor of miscible CO2 injection versus the corresponding oil production rate ... 176 Figure 6-7: Recovery factor of miscible CO2 injection versus the corresponding CO2 injection rate... 177 Figure 6-8: Scatter plot of the outputs of the proxy model versus the corresponding recovery factor gained from CMG software for a) training data points b) testing data points c) overall data points ... 179
XVIII
Figure 6-9: Relative deviation of the outputs of the proxy model from recovery factor of miscible CO2 injection gained from CMG software versus corresponding values of the CO2 injection rate ... 180 Figure 6-10: Relative deviation of the outputs of the proxy model from recovery factor of miscible CO2 injection gained from CMG software versus corresponding values of the oil production rate ... 181 Figure 6-11: Relative deviation of the outputs of the proxy model from recovery factor of miscible CO2 injection gained from CMG software versus corresponding values of the BHP of injection well ... 182 Figure 6-12: Relative deviation of the outputs of the proxy model from recovery factor of miscible CO2 injection gained from CMG software versus corresponding values of the BHP of production well ... 182 Figure 6-13: William plot for the results gained from the proposed proxy model for CO2 miscible injection ... 185
Chapter one: Introduction
1.1. Background
The oil demand is increasing progressively, mainly in the developing and developed countries for acquiring better living standards. Conversely, crude oil production is steadily decreasing as the reservoirs depletion. After primary production stage practically seventy percent of the initial oil in place in a reservoir is not produced [1-2]. To produce this considerable amount of oil, different Enhanced Oil Recovery (EOR) methods should be applied. There are various methods which are employed for EOR as per the compatibility of the reservoirs and the performance of the method [3-4]. Figure 1-1 depicts the classification of available EOR methods for mature oil reservoirs. Before applying each of EOR methods for increasing the oil production, several studies should be performed. One of these studies is phase behavior investigation which focuses on the behavior of the system including reservoir oil and injected fluid. This investigation helps us to figure out the contribution of different oil production mechanisms and decide which one should be applied. Also, the results from phase behavior study is one of the essential parts for dynamic reservoir simulations [3,5]. CO2 injection is one of the interesting EOR methods for improving oil production from the matured and depleted oil reservoirs due to promising microscopic sweep through the fine pores of the reservoir and reducing greenhouse gas, especially carbon dioxide, emission into the atmosphere. These characteristics make CO2 injection as good EOR option, especially in United States [1-5].
1.2. Research Objective and Scope
This thesis includes two sections. In the first section, we developed deterministic tools for determination of three parameters which are important in CO2 injection performance including minimum miscible pressure (MMP), equilibrium ratio (Ki), and a swelling factor of oil in the presence of CO2. For this purposes, we employed two inverse based methods including gene expression programming (GEP), and least square support vector machine (LSSVM). In the second part, we developed an easy-to-use, cheap, and robust data-driven based proxy model to determine the performance of CO2 based EOR methods. In this section, we have to determine the input parameters and perform sensitivity analysis on them. Next step is designing the simulation runs and determining the performance of CO2 injection in terms of technical viewpoint (recovery factor, RF). Finally, using the outputs gained from reservoir simulators and applying LSSVM method, we are going to develop the data-driven based proxy model. The proxy model can be considered as an alternative model to determine the efficiency of CO2 based EOR methods in oil reservoir when the required experimental data are not available or accessible.
1.3. Thesis Organization
This thesis is written in manuscript-based format, including five journal papers. Table 1-1 reports the papers published and unpublished during the course of this research. Chapter 2 reviews the previous works done on the CO2 based EOR methods and the parameters involved in these methods. Besides these parameters, Chapter 2 delve into the proxy model development for EOR purposes.
4
Table 1-1: Organization of the thesis
Chapter Title Supporting Paper Title
Chapter 1: Introduction Not Applicable (NA)
Chapter 2: Literature Review Worldwide CO2 injection into underground formations: Technical status and Challenges,
Submitted to Journal of Petroleum Science Chapter 3: Equilibrium Ratio of
Hydrocarbons and Non-Hydrocarbons at Reservoir Conditions
Equilibrium Ratio of Hydrocarbons and Non-Hydrocarbons at Reservoir Conditions: Experimental and Modeling Study, Fuel (2017),
210, 315-328 Chapter 4: Minimum Miscibility
Pressure of CO2-Oil System in Miscible Gas Flooding Processes
A Reliable Strategy to Calculate Minimum Miscible Pressure of CO2-Oil System in Miscible
Gas Flooding Processes, Fuel (2017), 208, 117-126
Chapter 5: Hybrid Connectionist Model Determines CO2-Oil Swelling
Factor
Hybrid Connectionist Model Determines CO2 -Oil Swelling Factor, Submitted to Journal of
Petroleum Science Chapter 6: Developing a Robust Proxy
Model of CO2 Injection
Developing a Robust Proxy Model of CO2 Injection: Coupling Box–Behnken design and a
Connectionist Method, Fuel (2018), 215, 904-914
Chapter 7: Conclusions and Recommendations
NA
Chapter 3 discusses an easy-to-use and reliable method for calculation equilibrium ratio for both hydrocarbon and non-hydrocarbons, i.e., carbon dioxide, nitrogen, and
5
hydrogen sulfide. The outputs of the proposed connectionist method were compared to the previously developed models.
Chapter 4 proposes a new method for determination of minimum miscibility pressure (MMP) of the CO2 injection process using a connections method which is called “ Gene Expression Programming (GEP)”. The results of the proposed model were compared with well-known empirical correlations.
Chapter 5 presents a novel intelligent based method for predicting CO2-oil swelling factor using least square support vector machine (LSSVM). To validate the developed connectionist method, an extensive data sample from literature were used and performance of this method were compared with other conventional correlations.
Chapter 6 proposes a proxy model for performance prediction of CO2 injection process using hybrid of experimental design and LSSVM method.
Chapter 7 reports the main conclusions can be drawn from this thesis as well as recommendations for future works.
References
[1] V. Alvarado, E. Manrique, Enhanced oil recovery: an update review, Energies, 3 (2010) 1529-1575.
[2] M. Blunt, F.J. Fayers, F.M. Orr, Carbon dioxide in enhanced oil recovery, Energy Conversion and Management, 34 (1993) 1197-1204.
[3] S. Kumar, A. Mandal, A comprehensive review on chemically enhanced water alternating gas/CO 2 (CEWAG) injection for enhanced oil recovery, Journal of Petroleum Science and Engineering, (2017).
6
[4] L.W. Lake, Enhanced oil recovery, Society of Petroleum Engineers (SPE), (1989). [5] S. Thomas, Enhanced oil recovery-an overview, Oil & Gas Science and Technology-Revue de l'IFP, 63 (2008) 9-19.
7
Chapter Two: Literature Review
Abstract
After primary production stage practically seventy percent of the initial oil in place in a reservoir is not produced. Producing this huge volume of oil requires to apply different Enhanced Oil Recovery (EOR) methods. There are various methods which are employed for EOR as per the compatibility of the reservoirs and the performance of the method. Carbon dioxide injection is one of the interesting EOR methods for improving oil production from the matured and depleted oil reservoirs due to promising microscopic sweep through the fine pores of the reservoir and reducing greenhouse gas, especially carbon dioxide, emission into the atmosphere. These characteristics make CO2 injection as good EOR option, especially in United States. There are various phenomena involved in oil production under carbon dioxide injection process including CO2-oil swelling factor, reduction in oil viscosity, and vaporization and condensation drive mechanisms. The paper discusses the process of CO2 injection in lab scale, pilot scale, and field scale throughout the world. This paper evaluates the contributor mechanisms in the oil production through carbon dioxide injection as well as assessment of the experimental and numerical works, from pore scale to field scale, and case studies. Besides, this paper provides economic and environmental aspects of carbon dioxide injection. Finally, conclusions have been drawn based on the discussed topics.
2.1. Introduction
One of the main concerns of a human being today is increasing the concentration of greenhouse gases, especially carbon dioxide. Increasing this toxic gas concentration in
8
the atmosphere affects the life style drastically and results in global warming[1, 2]. There are numerous studies regarding the effect of greenhouse gas on global warming. Unfortunately, most of the carbon dioxide emitted from anthropogenic sources. There are different solutions for this problematic issue including replacing fossil fuels with renewable or sustainable energies, i.e., wind, solar, ocean, and capturing carbon dioxide and sequestering in a geological formation[3-6]. Moreover, the number of the depleted oil fields throughout the world is constantly increasing. In most of these oil fields, the oil recovery factor is lower than 30 percent of the oil in place. Producing such significant volume of oil in these oil fields needs applying enhanced oil recovery (EOR) methods. These EOR methods might be water flooding, gas injection, chemical flooding, and so forth [7].One of the promising and efficient mechanisms for producing the remaining oil is a CO2 injection. One of the main advantages of this method is a reduction of greenhouse gas emission into the atmosphere; this advantage drives oil companies to apply this method due to worldwide environmental concerns[8-12]. This driving force resulted in running more than 153 CO2 based EOR projects in worldwide in recent years. The United States employed 139 miscible CO2 EOR projects which contribute 41% of oil production from EOR methods in this country; this contribution is higher than any other EOR method [13, 14]. However, other countries also motivated to apply CO2 based EOR techniques to fulfill environmental considerations of governments as well as increasing oil production after primary production stage. For instance, several projects in Brazil, China, Korea, Mexico, Saudi Arabia, United Emirates, and the United Kingdom have planned to start since 5 years ago. It is worth to mention that due to a sharp drop in oil prices since 2014, some of the CO2 based EOR projects have held on or cancelled. Also, to make such projects affordable and
9
resistive to lower oil prices, technologies of carbon dioxide capturing and transportation should be developed considerably [1-3, 15-21].
CO2 based EOR method has different pros for improving oil recovery including improvement sweep efficiency, reducing oil viscosity, oil swelling, development of miscibility at lower pressures and high incremental recovery [22]. To evaluate the performance of CO2 injection in reservoir scale, compositional reservoir simulation studies are necessary; a comprehensive reservoir fluid model is a crucial section in compositional reservoir simulation. The accuracy of results from the reservoir fluid modeling depends on the precision and reliability of rock and fluid properties determination as well capability of reservoir simulation to regenerate the phase behavior during carbon dioxide injection [13]. There are various challenges in numerical reservoir simulation of CO2 injection process including hysteresis effect on the relative permeability, three phase relative permeability, dynamic change in oil composition, and consideration of reactive flow; reactive solver should be used in a case of carbon dioxide injection in deep saline aquifer or depleted oil reservoir with high water saturation. Numerical reservoir simulation with reactive geotechnical solver helps us to improve the safety and reliability of the CO2 injection process; however, doing such a work is very time consuming practice because numerous equations have to solve simultaneously for each grid cell; the number of grid cells for modeling of petroleum reservoirs is typically equal to 2-5 million grid cells. As a result, a compromise between budget, time, and safety concerns is needed [23-25].
Besides the advantages of the carbon dioxide injection, there are different technical and operational issues which might be occurred during the process of carbon dioxide flooding. Changing the oil fluid properties after CO2 injection could affect the process
10
of miscibility because the oil composition continuously changes during the carbon dioxide injection. This means that after a given time from starting CO2 injection, new samples should be gathered to update the whole process of CO2 flooding. For instance, Weyburn oil field in Canada is a good example of this issue [26]. Another probable issue in CO2 injection is changing the rock properties in terms of mineralogy; however, this issue occurs in a case of CO2 injection in deep saline aquifers. According to Jensen, there is no significant change in rock properties of Weyburn oil field after a long time of carbon dioxide injection[27, 28]. Khather et al. [29] determined experimentally the effect of carbon dioxide injection in petrophysical properties of dolomites including porosity and permeability of the rock samples. They argued that carbon dioxide injection in aquifer section with dolomite medium could damage severely the rock in terms of flow conductivity. In their results, CO2 injection could reduce the porosity and permeability by 12% and 57% of original values, correspondingly. However, they pointed out that this damage caused by domination of mineral precipitation versus mineral dissolution process[29]. Another concern regarding carbon dioxide injection is the drastic effect of carbon dioxide on the environment, especially plants and microorganisms, due to probable leakage during the injection process. However, there are two different viewpoints regarding this issue; some scholars pointed out further investigations are required to determine side effects of CO2 contaminants; on the other hand, several researchers discussed CO2 contaminants have a severe damaging effect on plants and microorganisms if CO2 leakage occurs [30-32].
The main aim of this paper is to review and discuss the existing and up-to-date research advances in grasping the various mechanisms which are contributed in oil production during CO2 based EOR methods, particularly simultaneous water alternating gas (SWAG) injection, continuous CO2 injection, and water alternating gas (WAG)
11
injection processes. A comprehensive review for carbon dioxide injection from pore scale to field scale is provided in the following sections. In view of the status of the CO2 based EOR methods, this paper discussed and reviewed some of the recent developments and chances accomplished by the use of the CO2 based EOR methods in oil recovery and their limitations to execute in both offshore and onshore oil fields. Also, practical issues associated with the process of carbon dioxide injection are explained, and several recommended solutions have provided. Finally, different issues, especially environmental and economic concerns, associated with these EOR methods have been reviewed.
2.2. A review on CO2 injection processes/operations across the world
To specify the performance of CO2 injection different apparatuses can be employed; these devices determine various mechanisms of oil production from pore scale to core scale. Ning et al. [33] carried out several multiple contact experiment (MCE) to figure out the contribution of oil swelling as well as reduction in oil viscosity on oil production from Alaska North Slope viscous oil. Heidaryan and Moghadasi [34] investigated the effect of swelling and viscosity reduction on the oil production using both experimental and theoretical methods. Based on the results, they concluded that the optimum value of CO2-oil swelling factor should be 1.7 to reach maximum oil production from the reservoir[34]. Or et al. [35] investigated experimentally the contribution of CO2-oil swelling and viscosity reduction using CO2 gas foaming in heavy oil reservoirs. According to the experimental results, they concluded that CO2 foam swelling increases with increasing the pressure drawdown of the well. Also, higher swelling of foamy oil could mobilize the residual oil to the producer well, especially in the immobilized
12
zone[35]. Habibi et al. [36] carried out experiments on CO2-oil system in a tight formation to figure out the interaction between CO2 and oil in a tight rock samples. They conducted constant composition experiment (CCE) to determine the CO2-oil swelling factor and other measureable data. Also, they performed CO2 cyclic injection experiments to determine the amount of oil recovery factor. In their experiments, increasing CO2 concentration from 48.36% to 71.06% resulted in increasing in CO2-oil swelling factor from 1.211 to 1.390, respectively. According to the experimental data, they concluded that different mechanisms contributing in oil production including oil swelling and expansion, CO2 dissolution into the oil, and CO2 diffusion into core sample[36].
Figure 2-1: Schematic of visual phase behavior experiment[37]
Dehghan et al. [38] employed micro-model visualization method to find the effect of fracture network on the performance of WAG injection. They also studied the effect of
13
WAG ratio, slug size, and injection rate on the performance of WAG injection process. They provided a correlation for capillary number in a fractured porous media. They used oil wet micro-models in all the experiments[38]. Robin et al. [39] carried out several tests on high pressure-high temperature micromodels to determine the possible mechanisms of production during CO2 injection process. Experimental data revealed that interaction between carbon dioxide and oil could destabilize asphaltene phase in oil as well as this interaction might results in foam formation[39]. Sugai et al. [40] conducted systematic experimental study on oil swelling factor determination in porous media using two different types of micromodels. They employed two micro models including fine beads and coarse beads micro-models to figure out the effect interfacial area on oil swelling and CO2-oil swelling factor. They employed glass beads with two different diameters to figure out interfacial area effect on oil swelling factor. To find the amount of oil volume at different time they employed digital camera and taken images was processed using image processing software. They evaluated the steadiness of oil saturation in their micromodels to validate that they can calculate swelling factor from their experiments. Also, they carried out oil-CO2 simple contact model in a visual cell to determine CO2-oil swelling factor at different pressure using digital camera and image processing method. They compared CO2-oil swelling factor from both experiments to determine which extra parameters should be taken into account for further works. According to the experimental results, they concluded that increasing in the interfacial area results in increasing swelling of oil. In other words, the swelling factor in a case of fine beads micro-model was larger than this value in a coarse beads micro-model due to increasing in the interfacial area[40]. Seyyedsar and Sohrabi [41, 42] studied experimentally the microscopic oil displacement mechanisms of immiscible carbon dioxide flooding using high pressure- high temperature micro-model. They
14
concluded that displacement of carbon dioxide rich phase is much easier than those ones in oil rich phases[41, 42]. Also, they discussed the extraction process occurs in a near wellbore, particularly injection wells. Cui et al. [43] carried out various experiments to figure out the mechanism involved in oil production through CO2 injection in microscopic scale. They employed micro models at reservoir pressure and temperature. They concluded that presence of water could delay the time required for CO2 dissolution into oil and higher pressure facilitated the process of CO2 dissolution mechanism. Figure 2-2 depicts the schematic of micro-model setup for EOR purposes.
Figure 2-2: Schematic of micromodel visualization apparatus for EOR purposes [38]
One of the most common experiments to figure out the performance of CO2 injection as well as the value of MMP is slim tube test. Slim tube test provides useful information regarding gas enrichment effect of oil recovery factor and MMP value; however, this
15
test is too expensive and time-consuming[44-46]. Figure 2-3 shows a graphical demonstration of slim tube apparatus.
Figure 2-3: Schematic of slim tube experiment [47]
2
3
5
Density Meter6
7
8
9
1
1- Pump 2- Oil Accumulator 3- Gas Accumulator 4- Packed Tube 5- Sight Glass6- Back Pressure Regulator 7- Separator
8- Gas Chromatograph 9- Gas Meter
16
Monger et al. [48] conducted both laboratory and field study of the CO2 huff ‘n’ puff process to improve oil recovery from light oil reservoirs. They carried out CO2 cyclic core flooding experiments with both live and dead oil samples on the Berea Sandstone core. They determined CO2-oil swelling factor in their experiments. Based on the experimental results, they concluded that the main mechanism contributing in oil production was oil swelling; however, the amount of CO2-oil swelling factor was not too high. Also, they studied 65 single well CO2 injection and determined the contribution of oil swelling and solution gas drive mechanisms in oil production. Based on the field observations and experimental data, they concluded that the main oil production mechanism was oil swelling alone[48]. Thomas and Monger [49] studied on the effect of CO2-oil swelling factor in oil recovery from light-oil reservoirs using core displacement experiment. They correlated the oil incremental value from cyclic CO2 injection to the oil swelling factor. Based on the results, increasing in CO2-oil swelling factor resulted in increasing in the amount of produced CO2-oil[49]. Srivastava et al. [50] carried out an experimental study on CO2 flooding in Weyburn core samples and they concluded that two main factors contributing in oil production were oil swelling and reduction in oil viscosity. Yongmao et al. [51] investigated systematical experiments to figure out which parameters involved in the oil production of CO2 flooding. Based on the experimental results, they concluded that the main factor contributing in the incremental oil production was oil swelling and the degree of swelling presented by swelling factor. Swelling factor in their experiments was 1.4 and they pointed out this value means high contribution of oil swelling mechanism in the oil production. Kamali et al. [52] carried out several CO2 injection experiments on the sandstone core samples at different miscibility condition. Based on the results, they concluded that the oil recovery factor in both near miscible and miscible condition is
17
almost the same; however, lower oil recovery factor can be gained in immiscible flooding. Also, in immiscible CO2 injection lower heavy component, especially decane, can be produced. Kamali et al. [53] investigated experimentally both continuous CO2 injection, WAG, and SWAG injection at different miscibility condition on sandstone core samples. They concluded that based on the experimental results oil recovery factor of WAG injection process was greater than those in SWAG and continuous CO2 injection[53]. Figure 4 illustrates the schematic of core displacement test for EOR purposes.
Figure 2-4: Schematic of core displacement test [17]
CO2 injection can be applied in different ways either as continuous CO2 flooding, CO2 foam or WAG/SWAG injection[54]. In a case of WAG/SWAG injection, the amount of water/gas ratio and frequency should be determined prior to field test. Frequency
18
defines as the number of cycles required for CO2 and water injection. Moreover, the water/gas ratio is defined as the volume of the injected water to the volume of the injected CO2 in each cycle[54]. To determine these parameters two main options are available including experimental tests and reservoir simulation which are discussed in the following sections.
Carbon dioxide injection can be executed in different configurations including single well, huff n puff injection, and multi-wells injection. In a case of standard single well CO2 injection, particularly in immiscible carbon dioxide flooding, carbon dioxide is injected through injection well and oil produces from a production well or wells. In some cases, carbon dioxide is flooded via injection well and produced from four production wells; this configuration is called five spot pattern[44, 55]. In a case of huff-n-puff CO2 injection, the injection well and production well is the same. In this process, a candidate production well is shut-in and then, carbon dioxide is injected for a given time. In the next step, again the production well maintains zero production; this time is called soaking time. After a specific soaking time, oil production from the producer well is started; the process of huff n puff injection also called cyclic CO2 flooding. In this case, the amount of required carbon dioxide, and soaking time should be optimized. Cyclic carbon dioxide injection is a good option for heavy oil reservoirs[44, 56-62]. The more frequent CO2 injection pattern for EOR purposes is multi-wells injection. In this configuration there are different injection wells and different processes including continuous CO2 flooding, WAG, and SWAG injection can be applied simultaneously. For example, in one injection well CO2 is injected continuously; however, in other injection well WAG process has been employed. In a case of WAG and SWAG
19
injection different parameters including WAG ratio, the number of cycles and the amount of required carbon dioxide should be optimized[44, 63].
2.3. Field experience of CO2 injection processes for underground formations
CO2 injection process was firstly applied in 1972 in the Sacroc oil field located in Permian basin, Texas[64]. This oil field was discovered in 1948 and crude oils of this field have 42-degree API. In this field five spot pattern was employed as well configuration for this EOR scheme. The estimated oil reserve of this field is 951 million barrels of oil. Since 1972 miscible and near miscible CO2 injection the oil recovery factor improved by 3% of oil in place up to 1978[13, 44, 65-68].
Another field pilot application of immiscible continuous carbon dioxide injection in two oil fields in Trinidad and Tobago. These oil fields are Forest reserve and Oropouche. Oil gravity of the crude oils from these fields vary between 17 to 29 o degree API. In these oil fields four different immiscible CO2 injection projects have been done since 1974. First CO2 injection in Trinidad and Tobago was initiated in 1974 through upper Forest sands. The estimated volume of oil in this reservoir is equal to 1.874 million barrels of oil. This EOR scheme improved oil recovery performance by 7.6% of original oil in place (OOIP); this pilot is called EOR 33. Upper cruse sands in Forest reserve field contains 36.4 million barrels of oil and CO2 injection in this reservoir resulted in 4.7 % incremental oil recovery factor. This project is known as EOR 4 in this oil field. Another reservoir under immiscible CO2 flooding is lower Forest sands which contains 16.194 million barrels of oil. CO2 flooding in this section improved the oil recovery factor by 9% of oil in place since 1976 and this project is known as EOR 33. Sandstone reservoir of Oropouche oil field is another pilot for immiscible CO2
20
injection in Trinidad and Tobago and the process of CO2 flooding was initiated in 1990. The estimated recoverable oil from this reservoir is equal to 8.728 million barrels of oil and CO2 flooding yielded 3.9 % additional oil production; this project is known as EOR 44[44, 69, 70].
Little Creek field is a sandstone oil field located in Mississippi, United State; this oil field was explored in 1958 by Shell company. The estimated oil reserve of this oil field is equal to 102 million barrels of oil. The oil samples from this field have 39-degree of API. The process of miscible carbon dioxide injection in this field was initiated in 1985. Miscible CO2 injection improved the performance of oil recovery factor by 18.4 % of oil in place[69, 71, 72].
Bati Rahman oil field located in southeast Turkey was found in 1961. This oil field contains heavy oils with 11-degree API and the amount of in place oil is approximately 1.85 billion barrels of oil. Immiscible CO2 injection was selected for enhancing oil production from this oil field and this process was started in 1986 through impure CO2 injection. It should be noted that this oil field was under water flooding from 1975 to 1985. Since 1986 more than 6 percent of the in place oil was produced[73].
Another field experience was done in East Ford oil field which located in Texas, United States; this oil field comprises sandstone rock. Oil gravity of this field is equal to 40-degree API and the predicted volume of the recoverable oil from this field is equal to 18.4 million barrels of oil. The process of miscible CO2 injection in this oil field was started in 1995. Miscible carbon dioxide flooding in East Ford oil field enhanced the oil production rate; this EOR scheme increased oil recovery factor by 1% of oil in place[69, 74].
21
CO2 injection process was started in Weyburn oilfield located Saskatchewan, Canada, since 2000. This project is one of the largest carbon dioxide sequestration as well as EOR projects in the world. This oil field has 180 square kilometer area which discovered in 1954. This oil field comprises both low permeable chalky dolomite and fractured limestone. API degree of the reservoir oil fluid varies between 25 to 34 degree of API[75]. Source of CO2 supply is a coal gasification plant in Beulah, North Dakota [76].
Another field application of miscible carbon dioxide flooding in north of America is miscible WAG injection in Cogdell Canyon Reef oil filed which is located in Texas, United States. This oil field is mainly limestone and crude oil of this reservoir has 40-degree API. The recoverable oil reserve from this oil field is equal to 117 million barrels of oil. The process of miscible WAG injection in this field was initiated in 2001. This process improved the oil recovery factor from this field by 11% of original oil in place[69, 77].
Dulang oil field located in Malaysia was selected to apply immiscible WAG injection. The process of immiscible WAG injection in this field was started since 2002 in three reservoirs including E12, E13, and E14. Injecting immiscible WAG resulted in 5 to 7 % additional oil recovery as well as high produced gas with high CO2 concentration, near 50%. It is worth to mention that this oil field has a waxy oil; to enhance the performance of WAG injection a down-dip scheme along with lateral water injection was used [78-80].
Chihuido-de-la-Sierra-Negra is an under-saturated sandstone oil field located in Argentina. The crude oil of this oil field has 33-degree API. Unfortunately, several operational problems reported during WAG injection process including early
22
breakthrough of CO2, problem in CO2 supply pipelines, as well as failure in the casing of injection well. However, immiscible WAG injection in this reservoir yielded 3 to 8 % of additional oil recovery is reported for this EOR scheme[78, 81].
Lockhart Crossing field is a sandstone oil field located in Louisiana, United states; This oil field was discovered in 1982. Produced oil from this oil field has 42-degree of API and the amount of oil in place in this field is equal to 56 million barrels of oil. Miscible CO2 injection process in this oil field was initiated in 2007. Miscible carbon dioxide injection in this oil field improved oil recovery factor by 2.7 % of in place oil[69].
Katz Strawn oil field is located in Stonewall County, Texas; this field was found in1951. This field comprises sand stone and reservoir oil fluid has 38-degree API and 2.3 cP viscosity. The estimated oil reserve for this oil field is equal to 206 million barrels of oil. In this oil field both continuous CO2 flooding and WAG injection were started in 2010. Both injection processes were applied in miscible condition. Miscible CO2 injection in this oil field resulted in 0.3% improvement in oil recovery factor [69, 82].
Lula oil field in Santos Basin, Brazil, was discovered in 2006. The crude oils from this oil field have 28 to 30 degree of API. The estimated oil in place for this oil field is 5 billion barrels of oil. In 2011 CO2 injection in a pilot scale was successfully initiated. Due to the promising outcomes from pilot scale tests, Petro Bras started CO2 injection process in a field scale in 2013. Petro Bras employed both miscible CO2 flooding and WAG injection in this oil field[83].
CO2 injection process in Bell Creek oil field located in Fremont County, Wyoming, United States, was started in 2013 using anthropogenic CO2 source provided by capture plant at ConocoPhillips Lost Cabin in a center of Wyoming. This CO2 capturing plant delivers near 50 million cubic feet of carbon dioxide per day. The Bell Creek oil field
23
was found in 1967 and the amount oil in place for this field estimated 350 million barrel of oil. Before starting CO2 injection process the cumulative oil production was near 133 million barrels of oil. It is expected via CO2 injection method an additional 35 million barrels of oil can be produced[84, 85].
2.4. CO2 injection into underground formations: Description and Mechanisms
From a miscibility viewpoint, CO2 based EOR methods could be applied in miscible and immiscible conditions [15]. Miscibility phenomenon occurs in the miscible CO2 injection, and solubility phenomenon occurs in the immiscible CO2 injection [12, 86, 87]. As a rule of thumb for selection which reservoir is appropriate for applying CO2 injection, a miscible CO2 injection might be a good candidate for oil reservoirs located at more than 915 m depths and with more than 25o API oil gravity. So, miscibility between CO2 and oil can only be accomplished under certain temperature and pressure [86]. On the other hand, for immiscible CO2 injection, there is no requirement for miscibility; immiscible CO2 injection can be used in heavy oil reservoir or shallow light oil reservoirs [12, 13, 87].
2.4.1. Miscible CO2 Injection
After a certain injection pressure, there is no significant change in oil recovery value; this certain injection pressure is called “minimum miscibility pressure” which can be predicted using empirical correlations and/or experimental methods [88-90]. So, to reach maximum oil recovery in CO2 injection in oil reservoirs, the pressure in the injection facilities, as well as reservoir pressure, should be greater than the CO2-oil minimum miscible pressure [91]. One of the interesting and promising pros of CO2 in
24
comparison with the other types of gases, i.e., nitrogen or methane, is low minimum miscibility pressure. This advantage makes CO2 as an attractive EOR agent which is capable of using in the broad range of the oil reservoirs throughout the world [13, 91]. Two main mechanisms in miscible flooding processes are multiple contact miscibility and first contact miscibility. Jarrell et al. [44] described the process of CO2 miscibility using the transition zone between the production and injection wells. Jarrell et al. [44] pointed out that there is mass transfer between oil phase and injected CO2 and this mass transfer produces a transition zone which is miscible with the CO2 in the back and with oil bank in the front [13].
2.4.1.1. First Contact Miscibility
First contact miscibility defines as a solvent injection process that the solvent and oil become miscible when they first make contact[44]. The mechanism of oil production using liquefied petroleum gas (LPG) and propane injection in light oil reservoir could be first contact miscibility phenomenon. In other words, first contact miscibility occurs at a given pressure and temperature of the reservoir and the solvent and oil make a single phase fluid at any portion of the solvent and oil [44].
2.4.1.2. Multiple Contact Miscibility
Multiple contact miscibility defines as a solvent injection process which miscibility occurs after several different contacts. The oil production mechanism behind most of the miscible gas injection process can be multiple contact miscibility phenomenon [13, 92]. Also, in most oil reservoirs, CO2 cannot reach first contact miscibility within a practical range of pressures and needs multiple contacts, in which components of the
25
oil and CO2 transfer between the phases until the formation of a homogeneous phase using the processes of condensation/ vaporization [13, 91, 93].
2.4.1.2.1. Vaporizing Gas Drive Mechanism
Based on the oil composition and thermodynamic conditions, i.e., pressure and temperature, carbon dioxide is capable of extracting or vaporizing some intermediate oil components. Vaporizing gas drive mechanism defined as a process in which at contact point of an injected lean gas and reservoir oil rich in intermediate components, some intermediate components vaporize from oil phase into gas phase. During vaporizing gas drive mechanism, a miscible transition zone is created and moves toward the production well and the oil bank behind it. However, several unflavor conditions might affect this process which includes reservoir heterogeneity and limited contact area during injection due to channels and fractures. This vaporization phenomenon facilitates miscibility process at displacement front [44, 89]. The vaporizing gas drive mechanism occurs in a case of a multiple contact miscibility process. It is worth to point out that for occurring this mechanism the pressure at the interface between injected gas and oil phase should be high enough, and oil phase should be enriched with intermediate components C2-C6. Carbon dioxide has very low dynamic miscibility pressure in comparison with other gases used as EOR agent. Using carbon dioxide as an injection gas results in vaporization of more intermediate components compared to other gases; this is one of the main pros of CO2 injection process.
2.4.1.2.2. Condensing Gas Drive Mechanism
Condensing gas drive mechanism defined as a process in which at contact point of enriched injection gas and intermediate lean reservoir oil, some intermediate
26
components condensing from injection gas into the reservoir oil. In miscible CO2 injection, condensing gas drive mechanism occurs after stripping intermediate oil components when the enriched injection gas encounters fresh oil bank toward production well [44, 89]. A miscible transition zone develops owing to condensing some intermediate components from injected gas phase into oil phase. At that point a mechanism like the vaporizing gas drive mechanism will be established, and the reservoir oil behind the injection front becomes gradually lighter. Due to the oil swelling phenomenon the oil bank behind the injection front will occupy a greater pore volume than the fresh reservoir oil. Based on this mechanism the oil bank stripped of intermediate components behind the injection front will create a mobile zone and this process is continuous until the conditions of miscibility encountered. As described previously, carbon dioxide cannot reach first contact miscibility; however, via a vaporizing gas drive mechanism CO2 enriched with some intermediate component of oil which vaporized from the oil phase. These are consequently re-condensed at the injection front forming an enriched region with satisfactory mobility properties, denoted as a combined condensing and vaporizing drive mechanisms [94].
2.4.2. Immiscible CO2 Injection
Immiscible CO2 injection might be a good candidate in some cases in which the reservoir pressure is low compared to MMP value, or oil composition is not appropriate for miscible injection. In these cases, immiscible CO2 injection could be one of the options as an EOR method. In a case of immiscible CO2 flooding there is no single phase creation between oil phase and injected carbon dioxide; however, some carbon dioxide dissolved in oil phase. Two concurrent phenomena including reducing oil viscosity and swelling oil with contact CO2 are the dominate mechanisms which
27
contribute to the oil production using immiscible CO2 flooding[44, 90, 94-98]. Dissolving carbon dioxide into oil results in swelling oil and at the same time the oil viscosity reduces. As a result of these mechanisms, clearly the oil production facilitates and improves; however, the amount of oil incremental value highly depends of the amount of viscosity reduction as well as CO2-oil swelling factor[95].
Comprehensive understanding regarding the phenomena and mechanisms behind the CO2 based EOR methods is important for effective field application. Besides the reservoir pressure maintenance as a main goal of the gas injection processes, which supports the “artificial drive” for enhancing the oil production, CO2 based EOR methods employ other mechanisms to improve the oil recovery factor. According to Jarrell et al.[44], Rojas and Ali [99], and Kulkarni [100], different mechanisms contributing in oil production in a reservoir under CO2-based EOR method; these mechanisms are reduction of oil viscosity, oil swelling, and vaporization and extraction of some intermediate components in oil phase. Oil swelling and reduction in oil viscosity occur at the same time; this means that some carbon dioxide diffuses into oil phase then oil swells and viscosity reduced [12, 13, 44, 89]. However, the significance of the each of these processes depends on the reservoir temperature and pressure, as illustrated in Figure 2-5 [101]. As depicted in Figure 2-5, the area between immiscible and miscible injection process is distinguishable; the immiscible process occurs at lower reservoir pressure and temperature conditions; however, the miscible process taking place at high temperatures and pressures. Comprehensive explanation regarding the effect of the operational and reservoir parameters on the oil production mechanisms in reservoirs under CO2 injection process can be found in Jarrell et al. [44]. Based on their descriptions, continuous CO2 injection, slug CO2 injection, conventional
water-28
alternating gas (WAG), and simultaneous water-alternating gas (SWAG) are the main CO2 based EOR methods. Different parameters should be taken into account before considering each of these CO2 based EOR methods which include fluid and rock properties, the reservoir geology, slug size, schedule after water injection and well-pattern configuration[44, 92].
Figure 2-5: Effect of reservoir temperature and pressure on CO2—enhanced oil recovery [101]
2.5. Theoretical and practical Challenges of Experimental works/tests related to CO2 injection
Various theoretical and practical challenges associated with carbon dioxide injection process have been figured out in experimental works. In this section these challenges, which have experimentally investigated, have been discussed. Mohamed and Naser-El-Din [102] carried out several experiments to determine the permeability damage during
29
WAG injection process. They mainly focused on the sulfate based scales. They employed two different carbonate core samples from Austin chalk and Pink Desert limestone; these rock samples mainly comprised by calcite. Based on the experimental results, they concluded that WAG injection in carbonate reservoirs containing sulfur-bearing brines might results in precipitation of sulfur based scales; severity of this type of damage also increases by capillary forces in the low permeability porous media[102]. Wang et al. [17] experimentally studied the effect of asphaltene precipitation during carbon dioxide injection on the efficiency of such a process in low permeability sandstone reservoirs. They employed nuclear magnetic resonance (NMR) core displacement experiment to figure out asphaltene precipitation in pore scale. Experimental results showed that in a case of immiscible CO2 injection the larger pores have major contribution in oil production; however, in a case miscible injection smaller pores contributed in oil production. Also, asphaltene precipitated in larger pore spaces and this precipitation did not have damage effect on the oil production; however, in few small pores asphaltene precipitation was observed[17]. Another challenge associated with CO2 injection is fine migration during carbon dioxide injection. Xie et al. [103] experimentally investigated fine migration process during carbon dioxide flooding. They used NMR core displacement experiment to determine permeability impairment owing to fine migration during CO2 flooding. They concluded that the major portion of permeability reduction during carbon dioxide injection caused by fine migration[103].
Zheng and Yang [104] investigated experimentally two different scenarios for WAG injection to find the suitability of this method in heavy oil recovery. They employed 3D physical model with different configurations of injector and producer wells. Based on the experimental results, they concluded that in a case of horizontal injector and
30
producer wells, maximum heavy oil recovery could achieve; well configuration has a dominant impact on the ultimate heavy oil recovery[104].
Eide et al. [105] conducted several miscible CO2 injection experiments in a fractured core samples using both magnetic resonance imaging (MRI) and CT core displacement methods to find out which mechanism contributes in oil production from fractured reservoir in a case of miscible CO2 injection. Based on the experimental results, they pointed out that diffusion is a main oil production mechanism from core samples with high fracture permeability; however, in a case of low fracture permeability, the dominant oil recovery mechanism is viscos displacement and late time diffusion process. Also, they concluded that tortuosity affects the oil recovery rate in a case of diffusion dominant mechanism; high tortuosity lower oil recovery[105].
Eide et al. [106] employed CT core displacement experiments to find the contribution of diffusion mechanism in CO2 flooding through fractured reservoir. Based on the experimental data, they concluded that diffusion mechanism could contribute to oil recovery in CO2 flooding process in fractured reservoir, and diffusion mechanism depends on the fracture distances and carbon dioxide distribution throughout the fracture network.
Liu et al.[107] carried out several CO2 flooding tests in a synthetic sandstone core samples to figure out the CO2-oil displacement front quality using MRI method; MRI provides high quality images of the CO2 flooding process . They employed decane as an oil phase in the core flooding experiments. They analyzed two parameters as indicator of displacement front characteristics; these parameters are the ratio between the length of the front to the front width, and velocity of the displacement front. Based
31
on the experimental results, they concluded that in case on CO2 injection at above MMP, the vertical upward CO2-oil displacement was instable[107].
Wang et al.[108] conducted long-core displacement experiments to evaluate the performance of both miscible CO2 injection and WAG injection processes as well as permeability reduction owing to asphaltene deposition. They concluded that asphaltene deposition has a waive-like trend and to overcome this obstacle injection of chemical inhibitors is highly recommended.
Al-Ryami et al. [109] studied experimentally the effect of gravity force on the ultimate oil recovery factor and carbon dioxide sequestration performance of miscible and near miscible CO2 injection on sandstone core samples. The experimental results revealed that in vertical continuous CO2 injection the ultimate oil recovery factor is much higher those ones in horizontal CO2 displacement due to considering gravity effect. The most produced components in vertical displacement were light components; however, those ones in horizontal flooding were heavy components, i.e. decane.
Zhang and Gu [110] proposed two quantitative indexes for determining MMP value CO2 and oil system. These indexes are break-over pressure (BOP), and oil recovery factor (ORF). They conducted five slim tube experiments with the live oil samples as well as five core displacement experiments with dead oil samples. They employed both linear and quadratic interpolation methods for a case of ORF criterion. Also, they used cubic regression method to calculate MMP value based on the measured ORF versus corresponding injection pressure. They concluded that different MMP values can be determined from the plot of ORF against corresponding injection pressure. Mogensen [111] proposed a new protocol for MMP determination using slim-tube experiment. He employed C1/C3 ratio as a function of pressure to determine MMP. If the slim-tube
32
experiment conducts at a pressure lower than MMP, an iterative method can be used to figure out how many steps will be enough to reach MMP. The main drawback of this method is added cost of the produced gas compositional analysis.
Zhang and Gu [112] suggested two quantitative indexes and one qualitative criterion for calculating MMP using the method proposed by Dong et al. [113]; rising bubble apparatus (RBA) technique. These criteria are rising velocity (BRV), bubble-rising height (BRH), and bubble break-up (BBU), correspondingly. They carried out two rising bubble experiments for both impure and pre CO2 cases. They concluded that MMP value for the case of light oil sample and pure CO2 is lower than the value obtained from core displacement experiment. Zhang and Gu [114] proposed two new criteria for MMP determination using vanishing interfacial tension (VIT) method. These criteria are the critical interfacial thickness (CIT), and the linear correlation coefficient (LCC). They carried out six dynamic IFT measurements for both live and dead oil samples under different thermodynamic conditions. They pointed out that the corresponding value of pressure when the LCC is lower than 0.990 or CIT is lower 1.0 nm at the first, is MMP. Based on the experimental results, they concluded that MMP value for live oil samples is slightly higher than MMP value for the dead oil samples; however, the effect of composition in VIT method is minimum but it can be measured for oil samples with high gas-to-oil ratio (GOR).
2.6. Theoretical challenges of modeling works to simulate CO2 injection into
underground formation
Sobers et al. [115] proposed a strategy for CO2 injection in an field located in the Gulf of Paria using compositional reservoir simulation. Their strategy was based on the both carbon dioxide sequestration and heavy oil recovery. They considered both vertical and
![Figure 2-5: Effect of reservoir temperature and pressure on CO2—enhanced oil recovery [101]](https://thumb-us.123doks.com/thumbv2/123dok_us/10961127.2984448/46.892.209.717.346.740/figure-effect-reservoir-temperature-pressure-co-enhanced-recovery.webp)