Standards Development
For Differential Scanning Calorimetry
Volume 91 Number 3 May-June 1986
Jane E. Callanan, Sandra A. Sullivan, and Dominic F. Vecchia National Bureau of Standards Boulder, CO 80303
This article summarizes two studies made in preparation for standards devel-opment, by differential scanning calorimetry. for instruments such as scanning calorimeters. differential ther-mal analyzers, differential mechanical analyzers, and related thermal analysis devices. The first was an extensive
mended by the American Society of Testing and Materials. These studies are described in detail in National Bureau of Standards Special Publication 26()..99.
Key words: differential scanning calori-metry; fusion enthalpy; fusion tempera-ture; pilot study; standards; thermal analysis; transition enthalpy; transition temperature.
study of the variability of differential scanning calorimeters when used for de-termining transition temperatures and enthalpies. The second was an
evalua-tion of calibraevalua-tion procedures recoro- Accepted: August 27, 1985.
Introduction
A need exists for a number of transition tempera-ture standards for use with differential scanning calorimeters (DSCs), differential thermal analyzers (DTAs), and differential mechanical analyzers (DMAs). In addition, transition enthalpy standards are required for the DSC and DT A. Conventional calorimeters are absolute measuring instruments. Once such a calorimeter has been calibrated, the results obtained with it are thermodynamic values and remain so until the measuring system is altered. A repair to wiring within the measuring circuit, a change in the masses of various components of the calorimeter, or long-term aging and use effects
About the Authors: Jane E. Callanan and Sandra A. Sullivan are with the Center for Chemical Engi-neering in NBS' National EngiEngi-neering Laboratory (NEL), while Dominic F. Vecchia is with NEL's Center for Applied Mathematics.
necessitate recalibration. While the required time for the approach to equilibrium or shield behavior characteristics may depend on the nature of the specimen, the numerical results obtained do not as the system is an absolute measuring one.
On the other hand, most DSCs are not absolute measuring instruments; they require the use of stan-dard substances to evaluate the correction factors, for both temperature and enthalpy, which must be applied in order to obtain corrected values for ther-mal properties.
The American Society for Testing and Materials (ASTM) recently issued revised calibration proce-dures for DSCs and DTAs [1,2]'. Preliminary eval-uations of these procedures in our laboratory showed them to be promising, particular! y if the melting points of the fusion standards were spaced at 50-60 K intervals.
Existing temperature and enthalpy of fusion stan-dards include six standard substances developed by the National Physical Laboratory (NPL). U.K. [3]. For these. temperatures have been determined in a triple-point cell; the enthalpies of fusion. in an adia-batic calorimeter.
A second group of substances. sponsored by the International Conference of Thermal Analysis (ICTA) in 1971. is available through the Office of Standard Reference Materials (OSRM) [4]. Theseare standards for temperature only; enthalpy values have not been reported. In addition. the un-certainty in the nominal values for the melting points cited for these latter substances is more than an order of magnitude greater than would be ex-pected with more recent instrumentation. The cause of this uncertainty may lie in the substances themselves or it may be in techniques and
instru-mental factors associated with the initial
measure-ments. Those measurements were intended for comparisons among instruments rather than for use
as calibration standards.
A third set of reference materials. again only temperature standards. is also available from NPL. This consists of 10 organic compounds whose melt-ing temperatures have been obtained in glass capil-laries. at a heating rate of 2 K/min. The enthalpy of fusion standards have been selected from among these materials but were developed for different lots of material; thus the enthalpy values are not transferable.
For most reliable work with thermal analysis in· struments it is desirable to have standards available that cover a range of temperatures. enthalpies and materials) e.g., metals, organic solids, inorganic solids. liquids. polymers. etc. [5].
Experience in our laboratory led us to believe that we might be able to develop satisfactory tem-perature and enthalpy standard reference materials for DSCs with a DSC. Accordingly. a variability study and a calibration study to evaluate the feasi-bility of such work were designed and undertaken. A brief description of these studies. and the results obtained. is presented here. These results indicate that the proposed procedures do allow for certifi-cation of standards satisfactory for use with DSCs. DT As. and other thermal analysis instruments. A program of development of snch standards has been undertaken at NBS-Boulder.
This article is intended to acquaint users of these instruments with the certification procedure. Full documentation and all data will be found in a cited NBS Special Publication [6].
Variability Study
To judge the suitability of a DSC for the devel-opment of standards. it is necessary to identify and evaluate the various sources of experimenta1 vari-ability in temperature and enthalpy measurements. In general. such variability could arise from the DSC. from the procedures and laboratory condi-tions for working with the DSC. or from inhomo-geneity among specimens of the reference material. Studies to evaluate the effects of these sources of experimental error on the precision of DSC mea-surements are described in this section.
lhree forms of indium (grauules. rod. foil) were selected for this study. In the initial variability study, five specimens of each form were prepared and each specimen was run four times, remounting the specimens in the calorimeter between repeat
measurements. The 20 measurements of
tempera-ture and enthalpy of transition on each form were obtained in random order over a long enough time period to include the effects of variations in line voltage. or other diurnal perturbations. on the re-sults. Specimen masses varied from 0.93-3.49 mg; temperature and enthalpy of transition did not ex-hibit mass dependence in this range.
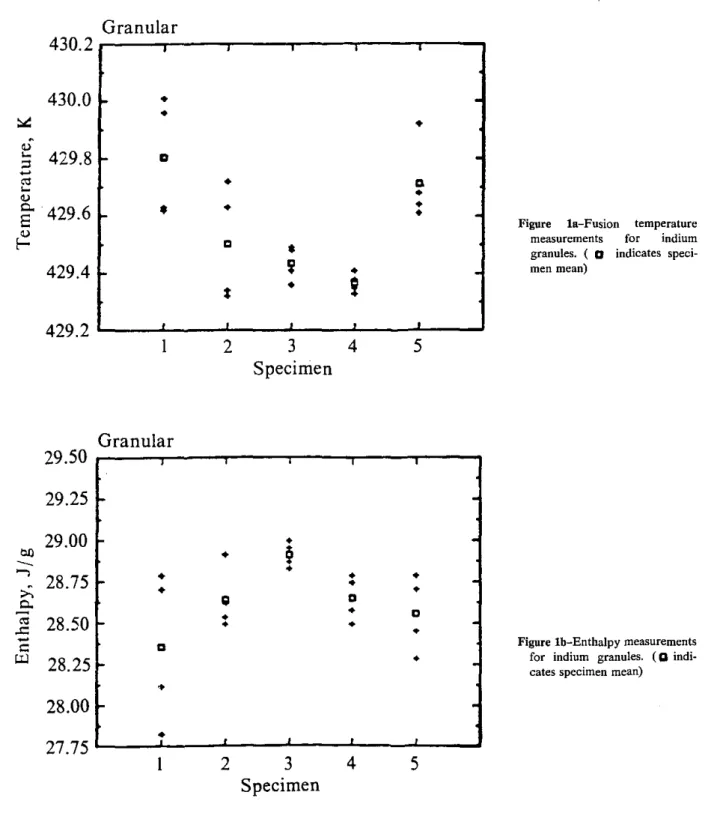
A statistical analysis was done (separately) on both temperature and enthalpy data for each form of indium. The analysis allowed for the possibility that large differences could exist between different specimens of the same indium form. Figures la and Ib illustrate the specimen-to-specimen (and within specimen) variability that can be seen in the data for granolar indium. Variance calculations on the indium data describe both the internal variability of the measurements on a given specimen and the variability between sets of measurements on differ-ent specimens.
Both between-specimen and within-specimen components of variance were calculated in each analysis. The between-specimen component of variance is primarily associated with material vari-ability of a given indium form. Hence. it provides a quantitative measure of inhomogeneity in the speci· mens with respect to temperature or enthalpy of
transition. The within-specimen variance is that
which occurs in the absence of sample inhomo· geneity or when measuring a single specimen reo peatedly. It contains contributions to overall variability other than specimen-related ones. With the present experimental design, these include in-strumental factors and the effects of remounting the specimens. of operating procedures. and of am-bient conditions.
Granular
430.2
••
430.0
~•
•
::.::
<U....
429.8
; l-
D-
ro....
•
<Uc..
429.6
E
•
•
<U f-"
•
429.4
.
~•
429.2
~•
I
2
3
Specimen
Granular
29.50
•
29.25
-29.00
•
Oll•
§
~-,
•
28.75
•
;;;
-
•
c..
; ro28.50
f-•
•
..c:
-.: Q UJ28.25
f-•
28.00
•
27.75
•
12
3
Specimen
For measurements on a given form of indium, the within-specimen component of variance, S2, and between-specimen component of variance, Sb 2
,
are calculated as follows:
and Sb'
=~
(4SA ' _S2) I'4
-S'=- ~ ~ (Xij-Xil' 15i=lj=I (I) ••
i
4
•
•
"
•
•
•
4
•
·
•
·
Q•
•
•
·
Figure la-Fusion temperaturemeasurements for indium
granules. ( D indicates
speci-·
men mean)•
5
••
•
"
•
Figure Ib-Enthalpy measurements
•
-
for indium granules. (Qindi-cates specimen mean)
·
•
5
where
In these formulae, Xij denotes the j-th m~asured temperature (or enthalpy) on specimen i, Xi is the average of four values On specimen i, and
X,
is the grand average of all 20 values from 5 specimens.Note that 82 (15 degrees of freedom) is, in fact, the
pooled within-specimen variance, commonly used
by chemists,
where 8,2
is the usual estimated variance of the four repeat measurements on the i -th specimen. Thus, 82
is a proper estimate for the (internal) variability
of repeat measurements on a given specimen when
there may be large differences between different
specimens of an indium form. Also, SA2 is the
esti-mated variance of specimen means, and in effect,
reflects both between specimen variability and within specimen experimental errors. The formula for the between specimen component of variability, 8b2, is obtained from standard statistical theory [7].
To obtain a realistic estimate of the standard er-ror in the grand average X, of all measurements on
a given form of indium, the within specimen and between specimen components of variance are
combined in the formula: 82(X) 82
+
48b220 (2)
The average value,
X,
is an estimate of the averagemelting temperature (or enthalpy) of all specimens of a given form of indium, and eq (2) is the correct estimate of the standard error that should be used to assess the uncertainty in the average value. There are four degrees of freedom for 82(1')
in this analysis [7]. The average value, with its associated uncertainty, defines the limits within which
investi-gators using the same material should expect their values to fall.
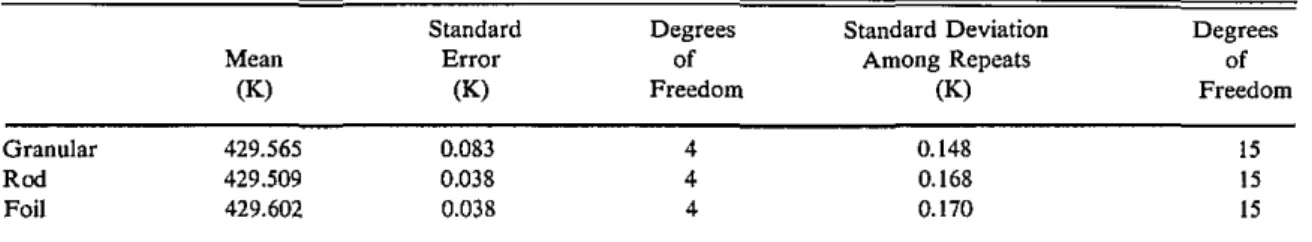
Estimates from this study of the average melting temperature and enthalpy of transition for each form of indium are given in table I and 2, respec-tively. Standard errors for these values were calcu-lated using eq (2). Estimated standard deviations of
repeat measurements on a single indium specimen
are also given in the tables. These reported values were computed from the pooled within specimen variability using eq (I), because the usual formula for the standard deviation of all 20 measurements is inappropriate when there may be differences be-tween sets of values from different specimens.
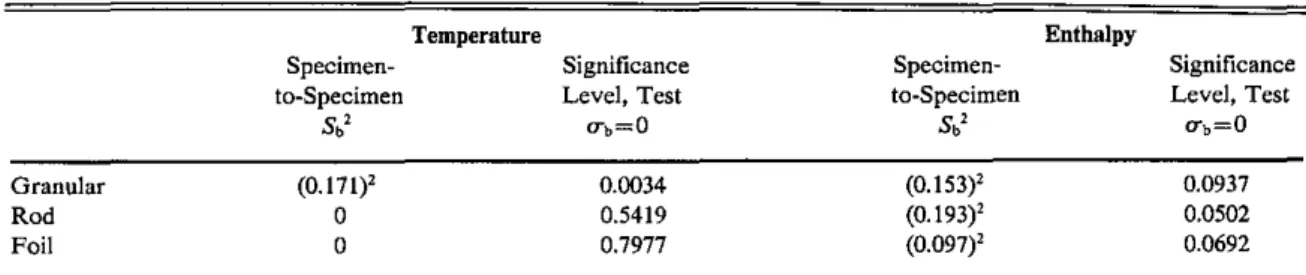
Estimates of the between-specimen component of variability of indium forms are given in table 3. A statistical test of the hypothesis of no specimen-to-specimen variability was computed in each anal-ysis. Significance levels for the tests are reported in table 3. The levels that were attained show
evi-dence of variation in melting temperature among specimens of granular indium, but no evidence of
significant variation for either rod or foil. How-ever, all three forms of indium exhibited possible inhomogeneity among specimens with respect to enthalpies of transition. Reasons for the apparent difference in properties of indium with respect to the two measured quantities are currently being in-vestigated.
Because the initial study could not distinguish re-mount variability from variation due to the instru ment itself, an additional six specimens (two of
each form) were run three times in succession, with
Table 1. Mean temperatures obtained in indium standards studyl.
Standard Degrees Mean Error of (K) (K) Freedom Granular 429.565 0.083 4 Rod 429.509 0.038 4 Foil 429.602 0.038 4
1 See footnote, table I.
Table 2. Mean enthalpies Obtained in indium standards study1.
Standard Degrees
Mean Error of
(Jig) (Jig) Freedom
Granular 28.623 0.089 4
Rod 28.761 0.105 4
Foil 28.936 0.055 4
I See footnote, table I.
Standard Deviation Among Repeats (K) 0.148 0.168 0.170 Standard Deviation Among Repeats (Jig) 0.256 0.270 0.148 Degrees of Freedom 15 15 15 Degrees of Freedom 15 15 15
Table 3. Estimated specimen-ta-specimen variation. Granular Rod Foil Specimen-to-Specimen Sb' (0.l7l)'
o
o Temperature Significance Level, Test CTb=O 0.0034 0.5419 0.7977no operator interference, to quantify the latter-source of experimental error. Additional studies
al-lowed the evaluation of weighing error variation,
effects of the computer analysis routine, and differ-ences between operators. Estimates of the contri-butions to overall variability in DSC measurements
from various sources of experimental variability
are shown in table 4. (Only results for foil are given because the previous analysis shows foil measure-ments to be the preferred (Le., less variable) form of indium for standards development.)
The results in table 4 were calculated in an ad hoc fashion from the combined results of the initial study and the additional data that were obtained later. Variation between operators is omitted from the table because operator differences were negligi-ble. Errors introduced by the analytic procedure and specimen differences were negligible for tem-perature. They were not for enthalpy; in fact, spec-imen differences were the second most important component of the variance of the enthalpy. Vari-ability introduced by the instrument itself, without
contribution from remounting the specimen, was
small in both instances. The most serious contribu-tions to the variance of both temperature and en-thalpy occurred as a result of replacing the
specimens in the calorimeter.
Calibration Study
The second part of the study provided an evalua-tion of the temperature and enthalpy. calibraevalua-tion
Table 4. Contributions to experimental variability (foil).
Temperature Enthalpy
Estimated Estimated
Variance Variance
Source Component Component
[K'J [(J/g)'J Specimen 0 (0.097)' Analytic Procedure 0 (0.055)' Instrument (0.016)' (0.023)2 Remount (0.169)' (0.136)' Total (0.170)' (0.177)' Specimen-to-Specimen Sb' (0.153)' (0.193)' (0.097)' Enthalpy Significance Level, Test Ub=O 0.0937 0.0502 0.0692
procedures for DSC which have been recom-mended recently by the ASTM [1,2].
For temperature, the fusion temperatures for two well-characterized materials which bracket the temperature of interest were determined. The calculation of the observed transition temperature was obtained from
T=(TOXS)+I, (4)
where T is the corrected specimen temperature, TO is the observed temperature, S is the sJope and
I, the intercept. The slope and intercept are calcu-lated from eqs (5) and (6).
The TS; are the literature values for the transition
temperatures.
The associated enthalpies are corrected as fol-lows. The transition enthalpy of a reference
stan-dard, usually indium, is measured and a calibration
factor for the instrument determined at the transi-tion temperature of this substance. The enthalpy correction is extended to other temperatures through use of a ratio of the heat capacity of a second standard, determined by the enthalpic method, at the reference temperature and at the temperature of interest. Sapphire is usually chosen for the second, heat capacity, standard because of its well-documented specific heat. The calibration coefficient (E) is obtained from the ratio of the lit-erature value of the enthalpy of transition (/lifUt) to the observed value (/lif,.J,
(7) Then the corrected enthalpy of fusion /lif(corr) of
measured specimens is obtained from
where W(meas) is the measured enthalpy of fu-sion for that specimen;...For extenfu-sion to other tem-peratures a correction factor, F, is obtained from the results for the heat capacity of sapphire, Cp.
F=Cp(lit)/Cp(obs) (9) The W(corr) from eq (8) is multiplied by the ratio of the F -factor at the temperature of interest to the F-factor at the reference temperature. The
F-fac-tor normally changes somewhat with temperature; for that reason an F -factor specific to the tempera-ture of interest is used.
The test materials selected were from the group of melting point standards certified by the NPL. The materials used and their reference tempera-tures are given in table 5.
Table 5, Melting points of test materials (K),
Substance NPL Certificate Values [8] Literature Values
Napthalene Acetanilide Diphenylacetic Acid Anisic Acid 2-Chloroanthra-quinone 353.J7±0.05' 387.51 ±0.05 420.41±0.05 456.45±0.2 482.75±0.3 353.37 [9] 387.51 [9] 420.41 [9] 456.14 [10] 482.20 [10]
• Uncertainties represent one standard deviation.
Table 6, Summary of transition temperatures and enthalpies.
INITIAL RUN ALL RUNS LITERATURE Substance Naphthalene Acetanilide Diphenylacetic Acid Anisic Acid 2-Chloroanthraquinone Naphthalene Acetanilide Diphenylacetic Acid Anisic Acid 2-Chloroanthraquinone Naphthalene Acetanilide Diphenylacetic Acid Anisic Acid 2-Chloroanthraquinone
The certificates for these materials indicate that these reference temperatures refer to a specific heating regime, heating at 2 K/min with the speci-men contained in a glass capillary tube. Where other definitive work has been done, the values are listed in column 3 of table 5.
Five specimens of each of the five test materials were prepared; each was run four times. Randomly selected sets of the five substances were used and run in order of increasing temperature. Substances I and 3 were used, as bracketing substances, to cal-ibrate the DSC and the transition properties of sub-stance 2 were obtained. Then subsub-stances 2 and 4 were used for bracketing and the properties of sub-stance 3 obtained. This procedure, followed through the selected list, would allow us to deter-mine I) whether the DSC would produce the ac-cepted temperatures satisfactorily and 2) what error is to be expected in various temperature ranges.
The results, as given in table 6, separate the first run from the average of all four. Whether particu-lar standards can be reused is always a question. Table 6 shows that, for the substances used here, differences between the first and the subsequent runs are of no practical significance. In those in-stances in which sample deterioration occurs, usu-ally manifested by peak distortion, standard specimens cannot be reused .
Transition Temperature (K) 387.35±0.28j 420.22±0.16 456.18±0.41 387.38±0.37 420.23±0.39 456.50±0.43 353.37 [9] 387.51 (9] 420.41 [9] 456.14 [8] 482.20 [8] Enthalpy of Transition (JIg)· 149.35±0.85j 163.65± 1.26 148.67± 1.32 195.49±0.76 148.15±0.76 149.01±1.18 163.40± 1.34 148.16± 1.28 195.31±1.53 146.81±1.20 148.6 [9] 160.2 [9] 147.3 [9] 207.91 [8] 135.35 [8]
NOTE: Naphthalene and 2-chloroanthraquinone have no temperatures listed since they were the outer bracketing substances .
• The enthalpies of transition given are those that have been corrected by the fusion correction only (eqs. 4&5).
The literature values quoted are for different lots of purified material from those used in this study or for results obtained by DSC in the early 1970s. Both DSC instruments and measuring techniques have improved greatly in the intervening years. Therefore, these results quoted here as literature values do not provide reliable criteria for compari-son, but none more reliable are available currently.
Summary
The work reported here demonstrates that new standard reference materials for thermoanalytical instruments can be developed using the ASTM Recommended Practices [1,2]' The certified values for these materials will carry uncertainties in tem-perature an order of magnitude less than the ICT A standards presently in use. In addition they will be certified simultaneously for transition enthalpies. The best results are obtained when like substances are used for the calibrations and when the tempera-ture difference between calibrants does not exceed 50 K. No blanket statement can be made about reusing standard specimens. If the fusion curves are not distorted, the specimen should be used again; if the curves are misshapen the specimen may not be reused.
It is anticipated that some of the materials that will be developed as standards, e.g., powders or crystals, will be readily homogenized. For these materials statistics which are appropriate for homo-geneous materials, ungrouped data, will be applied. For materials which exhibit some inhomogeneity, as did some of the metallic samples used in this study, a statistical model which can separate the effects of inhomogeneity from other factors will be applied.
The results of this study, summarized here, make the use of a DSC for the development of fusion standards for the broad class of thermal analytical
instruments creditable. A long-range program for the development of such standards is underway in this laboratory.
The authors thank Keith R. Eberhardt of the Cen-ter of Applied Mathematics, National Bureau of Standards-Gaithersburg for helpful advice and dis-cussion concerning this study and the manuscript.
References
[I] ASTM Standard Practice for temperature calibration of differential scanning calorimeters and differential thermal analyzers E967-83. Annual Book of Standards. 14.02: 782-787 (1984).
[2] ASTM Standard Practice for heat flow calibration of dif-ferential scanning calorimeters E968-83. Annual Book of Standards. 14.02, 788-794 (1984).
[3] NPL Certified Reference Materials and Transfer Stan-dards. National Physical Laboratory, Teddington, U.K. (1982 July).
[4] Office of Standard Reference Materials, National Bureau of Standards, Gaithersburg, MD 20899.
[5] Flynn, J. H., Theory of differential scanning calorimetry coupling of electronic and thermal steps, in Analytical Calorimetry, Vol. 3, R. S. Porter and J. F. Johnson, eds. New York, NY: Plenum Press, 17-44 (1974).
[6] Callanan, J. E.; S. A. Sullivan, and D. F. Vecchia, Feasi-bility study for the development of standards using differ-ential scanning calorimetry. National Bureau of Standards (U.S.) Spec. PubL 260·99 (1985 May).
[7] Box, G. E. P.; W. G. Hunter, and J. S. Hunter, Statistics for Experimenters, New York: John Wiley, 571-583
(1978).
[81 NPL Certificate of measurement CRM No. MI4-11. Set of ten melting point standards. National Physical Labora-tory, Teddington, U.K. (1980 November).
[9] Andon, R. J. L., and J. E. Connett, Calibrants for thermal analysis. Measurement of their enthalpies of fusion by adi-abatic calorimetry. Thermochimica Acta 42: 241-247 (1980).
[IOJ Pella, E., and M. Nebuloni, Temperature measurements with a differential calorimeter. Journal ofTherm. Anal. 3: 229-246 (1971).