Abusaad, Samieh, Gu, Fengshou, Zhang, R. and Ball, Andrew
Observer-based Fault Detection and Diagnosis for Mechanical Transmission Systems with
Sensorless Variable Speed Drives
Original Citation
Abusaad, Samieh, Gu, Fengshou, Zhang, R. and Ball, Andrew (2015) Observer-based Fault
Detection and Diagnosis for Mechanical Transmission Systems with Sensorless Variable Speed
Drives. In: 28th International Congress of Condition Monitoring and Diagnostic Engineering
Management (COMADEM 2015), 1st - 4th December 2015, Buenos Aires, Argentina.
This version is available at http://eprints.hud.ac.uk/26686/
The University Repository is a digital collection of the research output of the
University, available on Open Access. Copyright and Moral Rights for the items
on this site are retained by the individual author and/or other copyright owners.
Users may access full items free of charge; copies of full text items generally
can be reproduced, displayed or performed and given to third parties in any
format or medium for personal research or study, educational or not-for-profit
purposes without prior permission or charge, provided:
•
The authors, title and full bibliographic details is credited in any copy;
•
A hyperlink and/or URL is included for the original metadata page; and
•
The content is not changed in any way.
For more information, including our policy and submission procedure, please
contact the Repository Team at: [email protected].
Observer-based fault detection and diagnosis for mechanical transmission
systems with sensorless variable speed drives
Samieh Abusaad
a, Riliang Zhang
b, Fengshou Gu
a,b,*, and Andrew D. Ball
c aCentre for Efficiency and Performance Engineering, University of Huddersfield, Huddersfield, U.Kb
Department of Vehicle Engineering, Taiyuan University of Technology, Shanxi, P.R. China
Keywords: Observerbased fault detection, Lubricant quality, Motor electrical signature analysis, Sensorless VSD, Gearbox
1. Introduction
Sensorless variable speed drives (VSDs) are widely used for efficient and effective variable speed and torque control processes. Induction motors driven by sensorless VSDs have better dynamic response to fast load changes and variable speed demands without speed or flux sensors (1). Sensorless VSDs normally utilise terminal power supply parameters to estimate both flux and speed. Most estimation schemes are basically relying on the state parameters observers. The observer estimates system variables to produce errors or residual signals in conjunction with corresponding measurements. The residual signals then are relied to tune control parameters to maintain operational performance even if there are considerable disturbances such as noises and component faults.
Obviously, this control strategy outcomes robust control performances. However, it may result in adverse consequences to the system when component faults progress to high severity. To prevent the occurrences of such consequences, different schemes have been suggested to incorporate residuals from observers in the fault detection and diagnosis tasks. For instance, the state observer (2) is used to generate a vector of specific residuals for the detection of induction motor stator faults. The residuals are decompensated to obtain the negative sequence component which is then used as fault indicator. Similarly as represented in (3) observer based algorithm has used for induction motor electrical faults detection, i.e. inter-turn short circuit in the stator. However, this algorithm was sensitive to motor parameters and needs to be adjusted for each motor condition and type. In (4) an induction motor parameter observer was developed fault detection and localization based on the changes on the estimated parameters. This method is used particularly for stator and rotor faults detection. Observer based fault detection has been also widely used for current and speed sensors fault detection as proposed in (5-7).
However, review the literature shows that faults in the driven mechanical systems are not yet well discovered. For example, in (8) the estimated electromagnetic torque is filtered using first-order low-pass filter (PLPF) in order to keep the features high frequency features from the gearbox to be used for fault detection and diagnosis. However, the approach was not experimentally tested on faulty gearboxes. The study in (9) has also proposed a motor speed and load torque observer. The proposed observer is then employed to detect the gearbox features. Though, the proposed observed was not yet experimentally tested on a real applications faulty gearbox.
Therefore, this study proposes the utilisation of residual signals from sensorless VSDs observers used for detecting mechanical faults. The developed scheme generates residuals based on the observer outputs and raises alerts for incipient faults. Based on 10kW gear transmission system with VSD, observers for speed, flux and torque are developed for examining their residuals under different fault conditions. Two types of common gearbox faults: tooth breakage with different degrees of severities and shortage of lubricant at
∗ Corresponding author e-mail: [email protected]
ABSTRACT-Observer based approaches are commonly embedded in sensorless variable speed drives for the purpose of speed control. It estimates system variables to produce errors or residual signals in conjunction with corresponding measurements. The residual signals then are relied to tune control parameters to maintain operational performance even if there are considerable disturbances such as noises and component faults. Obviously, this control strategy outcomes robust control performances. However, it may produce adverse consequences to the system when faults progress to high severity. To prevent the occurrences of such consequences, this research proposes the utilisation of residual signals as detection features to raise alerts for incipient faults. Based on a gear transmission system with a sensorless variable speed drive (VSD), observers for speed, flux and torque are developed for examining their residuals under two mechanical faults: tooth breakage with different degrees of severities and shortage of lubricant at different levels are investigated. It shows that power residual signals can be based on to indicate different faults, showing that the observer based approaches are effective for monitoring VSD based mechanical systems. Moreover, it also shows that these two types fault can be separated based on the dynamic components in the voltage signals.
different levels are investigated. It shows that residual signals can be generated to indicate different faults; showing that the observer based approaches are effective for monitoring VSD based mechanical systems.
2. Observer design
2.1 Induction motor model
The squirrel cage IM model is obtained by describing the stator and rotor electrical circuits’ equations based on stator voltage vectors and stator and rotor currents victors , as follows (10):
��� �� =��− ���� ... (1) ��� �� =−���� ... (2) �� =����+���� =�� ����+����� ... (3) ���=��ωr �� +����� ... (4)
Where, us and�s are stator voltage and current respectively, Rs and Rr represent stator and rotor resistances
respectively, Lm, Ls, and Lr are the mutual, stator and rotor inductances respectively, σ is the motor leakage
coefficient, ��� and ����� depicts the electromagnetic and load torques respectively, j is the motor inertia, and �� and �� are stator and rotor fluxes respectively.
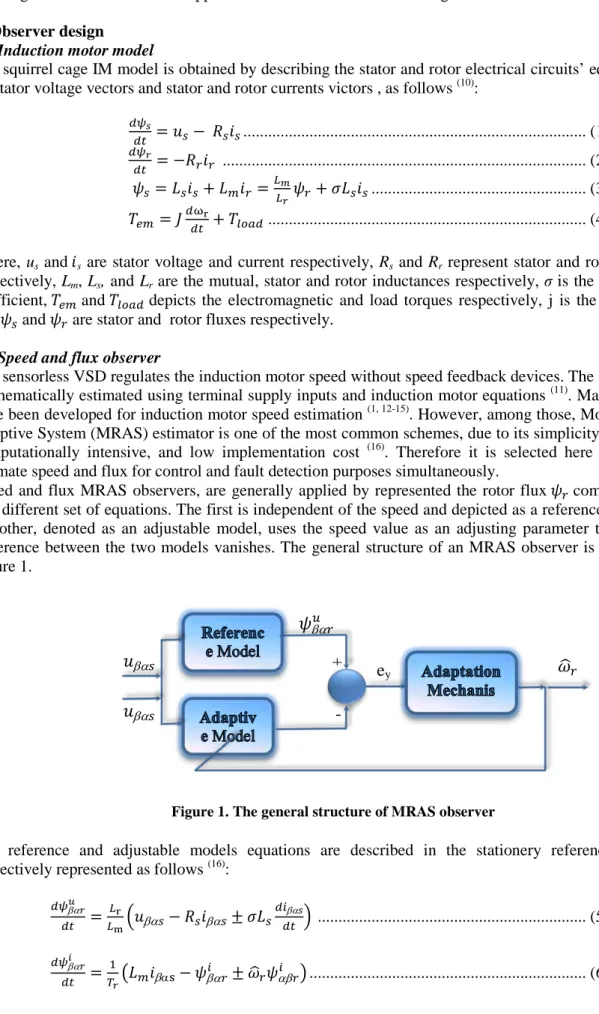
2.2 Speed and flux observer
The sensorless VSD regulates the induction motor speed without speed feedback devices. The motor speed is mathematically estimated using terminal supply inputs and induction motor equations (11). Many approaches have been developed for induction motor speed estimation (1, 12-15). However, among those, Model Reference Adaptive System (MRAS) estimator is one of the most common schemes, due to its simplicity, stability, less computationally intensive, and low implementation cost (16). Therefore it is selected here to be used to estimate speed and flux for control and fault detection purposes simultaneously.
Speed and flux MRAS observers, are generally applied by represented the rotor flux �� components using two different set of equations. The first is independent of the speed and depicted as a reference model, while the other, denoted as an adjustable model, uses the speed value as an adjusting parameter that makes the difference between the two models vanishes. The general structure of an MRAS observer is represented in Figure 1.
Figure 1. The general structure of MRAS observer
The reference and adjustable models equations are described in the stationery reference frame and respectively represented as follows (16):
��βα� � �� = �r �m��βα�− ���βα�±��� ��βα� �� � ... (5) ��βα� � �� = 1 ������βαs− �βα� � ±�� ��αβ� �� ... (6)
�
βα� ��
βα�+
e
y-
�
βα� ���
��
βα�Where the subscripts β,α denoting the stationery reference frame components, the superscripts �,� indicating the voltage and current models respictively and ��� is the estimated rotor speed. The adaptation mechanism is a PI controller that processes the difference between the two models ey, and generates an output that replaces
the estimated speed value. The adaptation mechanism is represented as follows:
��� =��(�β���α��− �α���β��) +��∫(�β���α��− �α���β��)�� ... (7)
Where Kp, Ki denoting the PI controller coefficients and they are practically selected for each operating point, as to make the observer stable and accurate. The electromagnetic torque is calculated from the following equation (17):
��=3
2���β��α�− �α��β�� ... (9)
The developed observer therefore utilises the three phase currents and voltages as inputs and the motor speed, flux and torque values as an outputs.
3. Observer based fault detection
As stated in (18), observer based approach is preferable as to avoid modelling uncertainties and disturbances, increase the robustness of the fault detection process, and to obtain better process output estimation. Moreover, its flexibility (19) made it very common to use. Additionally, observers are already employed by the sensorless VSDs and limited work is needed for additional programing and resources. The output from observers can be relied to generate residuals for model based fault detection algorithms. However, these residuals need to be carefully studied as they may influenced by process parameters changes and unknown disturbances. Furthermore, a compromise is required when tuning the observers’ coefficients as to make them robust enough against disturbances for optimal control and at the same time sensitive to mechanical faults. Figure 2 shows a generalised structure of residual generation process in the time domain (19).
Figure 2. Observer and residual generator structure, redrawn [20]
When a fault occurs, it will affect the process parameters and changes the system variables including the system speed, terminal voltages and stator currents. The drive will react upon the motor supply to compensate the changes that the fault made. However, the complicated structure and the noise level from the drive make it difficult to detect small changes in the supply signals directly. The suggested scheme therefore employs both measured inputs together with the estimated parameters to generate residuals��. Specifically, a power residual is calculated by calculating the difference between the estimated power����, which is calculated using the estimated torque and speed quantities, and the measured power����, which is the product of the measured supply quantise:
��=����− ���� ... (10)
However in order to make the residuals robust against motor parameter inaccuracy and any disturbances from load variation, both estimated and measured signals are normalised to the reference setting values by
Estimated outputs ��(�)
Inputs u(t)
Process g(t) Observer h(t)+
-
Residual
s (Re)
Fault indicationOutputs y(t)
Residuals
assessme
Fault f(t)fitting the output across different loads. Additionally, a low pass filter has been used to remove high frequency noise. Also the residuals are represented in percentages to the motor base power.
4. Fault diagnosis and identification
Once a fault is detected, detailed analysis is required for fault diagnosis and identification. The study conducted in (21) indicated that when a sensorless VSD is used, the drive changes the terminal voltage more than the current of the induction motor because it attempts to maintain speed as close as possible to the setpoint. Therefore, the analysis of voltage signals from the drive can obtain more information about the health of the mechanical system. However, the level of the noise from the drive and the control actions of the closed loop system prevents from obtaining clear information. In general the instantaneous line voltage signal is given as:
�(�) =√2�
cos
(2����) ... (10)When a mechanical abnormality is occurred, it causes speed oscillation with a �� frequency component which modulates the terminal voltage signals and produces additional components at rotating frequency components in addition to sidebands across the fundamental �� supply frequency. The voltage signal in the case of a fault therefore can be represented as
��(�) =√2�cos(2��
��) + ��cos(2�(��− ��)� −α�−ϕ)
−��cos�2�(��− ��)� −2αψ+ϕ�−ϕ�. ... (11)
where: �(�) denotes the rms value of the motor phase voltage, α� is the phase angle between the stator flux and voltage, ϕ represents the motor load angle, ϕ� angular displacement of the fault and Ul and Ur the left
and right amplitudes, respectively, at sidebands of the voltage spectrum.
As indicated earlier, when the drive is used, the level of noise is high making it difficult to extract clear information from the voltage spectra. Therefore, to improve the performance of the voltage signals in detecting mechanical faults, the modulation signal bispectrum (MSB) (22) is used. The MSB is basically can be described as:
B��(�1,�2) =�{�(�1+�2)�(�1− �2)�∗(�1)�∗(�2) ... (12)
Where, �1,�2, �1+�2 and �1− �2 are the fault frequency components obtained from Fourier transform. The MSB method is used to calculate the amplitudes at the characteristic frequency components of the gearbox in the voltage spectra, namely fr1, fr2 and fr3. Then a direct comparison is made between the variation patterns
between these components in order to separate different types or locations of faults.
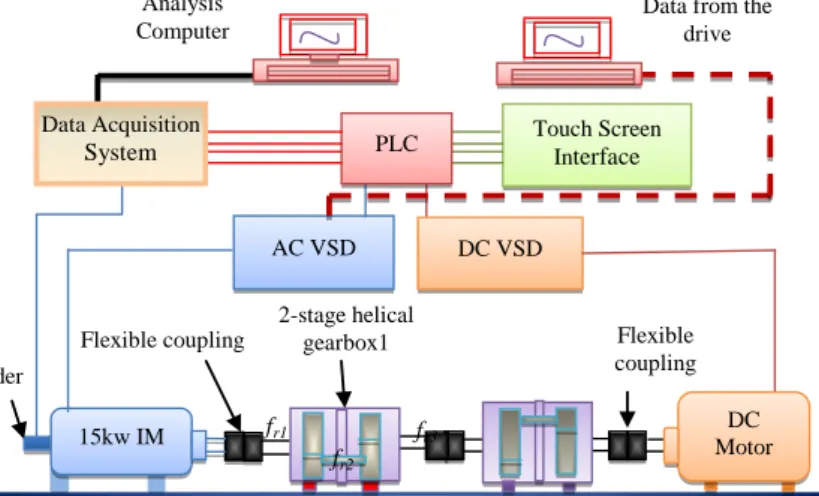
5. Test facility
The test facility employed for this study consists of a mechanical system and an electrical control system as shown in the schematic in Figure 3. The mechanical system includes a 15kW AC induction motor as the prime driver, two back-to-back two stage helical gearboxes for coupling the AC motor with a load generator using flexible spider rubber couplings. The first gearbox operates as a speed reducer while the other is a speed increaser so that the system maintains sufficient speed for the load generator to produce sufficient load to the AC motor through the two gearboxes. The control system consists of a programmable logic controller (PLC) for setting up different speed-load profiles specified by operator, an AC VSD, Parker 650V, that can be set either to a sensorless flux vector control mode or V/Hz mode for adjusting the speed of the system, a DC VSD, Parker 550c, ensuring a controlled load to the AC motor by regulating the torque of the load generator.
A high speed data acquisition system was used to collect the data from sensors measuring vibration, three phase currents and voltages, gearbox temperatures and sends it into a PC for post processing and analysis. Especially, three instantaneous currents and voltages are used to estimate the speed and torque according to Equations (7) and (9) respectively in order to obtain the estimated power and hence residual signals. In the meantime, the current and voltage are also used to obtain the measured power.
Tests were carried out on the gearbox 1, denoted as GB1, which is a common industrial gearbox with a transmission ratio of 3.6, which is from z2/z1×z4/z3= 47/58×59/13, and a power rate of 10kW at 1460rpm.
Figure 3. The schematic diagram of the test rig
Three different oil levels were tested, i.e. the baseline with the nameplate oil quantity (BL = 2.6 litters), 600ml less (LL1 = 77%), 1100ml less (LL2 = 57.7%) to simulate oil shortage due to leakages and evaporation. During the test, each amount of oil was removed from GB1 through the drainage without any actions in adjusting the shaft alignments, which allows consistent results to be obtained for the shaft related components.
While three broken gear tooth tests applied on the pinion of the first stage using three gear sets, i.e. healthy as a BL, 50% broken tooth (TB50) and one full broken gear tooth (TB100). The rig is operated at three speed settings: 50%, 75% and 100% of the full motor speed, under four incremental load settings: 0%, 30%, 70%, and 100% of the system full load; attempting for examining the detection performance under variable speed and load operations, which are common scenarios in real applications. Only results at 100% speed are discussed for reducing the length of the paper. Each load setting was for a period of two minutes and changed to the next step automatically by the PLC controller incorporated in the rig control system. In total, each load cycle lasts 8 minutes. In addition, the VSD was set under sensorless control mode for evaluating the detection capability under this particular mode.
During these repeating operations, the lube temperature in GB1 was observed online and reached to around 46°C-47°C from the room temperature when the system operating parameters also became stabilized where data then is collected. To ensure data quality and for reliable comparison each speed/load cycles ran consecutively five times for each set of tests. By using an automated acquisition procedure based on time advancement, 40 seconds of instantaneous data were collected at every load setting. The presented results are from the last testing run of each set of tests, where all most all test system parameters are more stabilized.
6. Results and discussion
6.1 Fault detection based on residuals
The residuals have been tested under different load and fault conditions. Figure 4 shows the average results from the last three tests in each corresponding operating condition. Figure 4 (a) represents the generated residuals under different load conditions for the three oil levels. Figure 4 (b) depicts the generated residuals under different load and gear breakages. Both residuals show good performance in that the faulty conditions show higher residual values corresponding fault severity. It is also noticeable that the load changes do not affect the residual amplitudes. Therefore, the residual indicators give reliable detection results of the presentence and the severity of the faults.
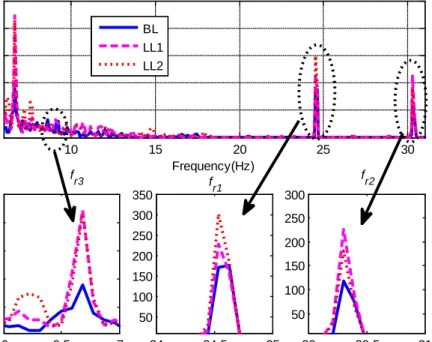
6.2 Oil level diagnosis
To diagnose the locations of these two faults, dynamic components from voltage signals is used, as explained in Section 4. When an oil leakage occurs, the vibration damping effect is reduced whereas the friction is increased. Consequently, rotational vibration that exists inevitably due to manufacture errors can be higher. Figure 5, shows the MSB slice at supply frequency from the voltage signal under 100% load and 100% speed. DC VSD 15kw IM Motor DC 2-stage helical gearbox1 Flexible coupling Flexible coupling AC VSD Touch Screen Interface PLC Encoder Analysis Computer Data Acquisition System
Data from the drive
fr1
fr2
Figure 4. Residuals from two different fault tests under different operating conditions
It can be seen that the feature frequency components fr1, fr2 and fr3 exhibit noticeable changes with oil levels,
indicating the potential of using them for diagnosing lubricating oil levels in gearboxes. Particularly, the frequency components at fr3 increase with fault significantly, nearly two folds higher than the baseline,
showing that the lubrication condition deteriorate more under the low speed and high load gear stage. In addition, fr1 shows consistent changes with oil level indicating for better diagnosis performance than that of
the other two frequencies, while on the other hand changes at fr2 show increase in the amplitude to that of
baseline but not consistently with the fault severities as its moment of inertial is relatively higher. Moreover the amplitude pattern decrease with respect to the frequency values for fr3 , fr1, and fr2 , providing a unique
finger print for the oil shortage.
Figure 5. Diagnosis of lube levels using voltage signals treated with MSB
6.3 Tooth breakage diagnosis
However, the tooth breakage cases show very different MSB spectra. As shown Figure 6, the 50% tooth defect (TB50) exhibits the higher increases and results in the highest amplitudes at fr1, and fr2 whereas
100% tooth defect (TB100) shows the higher decrease at the same components. These changes are resulted from a combined influence of both the fault and the gear eccentricity and accumulative pitch error. The increased amplitudes for TB50 case may be due to the in-phase combination of the two influences whereas the decrease for TB 100 is due to the out-phase combination. Nevertheless, the gear tooth breakage on gear 2 causes more significant change of the dynamic components of fr1, and fr2 , which is different the oil
0 0.5 1 1.5 2 x 10⁶ 0 0.1 0.2 0.3
(a) Residuals in (%) from oil level tests
R es idual s ( % ) Data points BL LL1 LL2 0 0.5 1 1.5 2 x 10⁶ 0 0.1 0.2 0.3 (b) Residuals in (%) from tooth breakage tests
R es idual s ( % ) Data points BL TB50 TB100 10 15 20 25 30 0 100 200 300 400 500
MSB Slice at Supply Frequency from Voltage Signal
Frequency(Hz) M S B es ti m at er (V 2) BL LL1 LL2 6 6.5 7 100 200 300 400 500 M S B es ti m at er (V 2) fr3 24 24.5 25 50 100 150 200 250 300 350 Frequency(Hz) fr1 30 30.5 31 50 100 150 200 250 300 fr2
shortage in that the significant changes is at fr3. Therefore, it is achievable to diagnose these two types of
faults based on the differences of amplitude patterns between fr3 , fr1, and fr2.
Figure 6. Diagnosis of gear tooth breakages at 3fr1
7. Conclusions
In this study, an observer based online fault detection method has been developed for a VSD based electromechanical system. The observer which is normally employed for control systems in sensorless VSDs have been used simultaneously to generate residuals that can indicate for fault occurrences. The generated power residuals have been processed to produce reliable detection results for lubrication oil shortages and tooth breakages at different levels of severity. Subsequently, the MSB offline analysis shows that the dynamic components associated with each shaft can be used to make difference between the two types of the faults.
Acknowledgments
The project of this paper is supported by Natural and Scientific foundation of China (NO. 51375326).
References
1. L Harnefors, M Hinkkanen 'Stabilization methods for sensorless induction motor drives—A survey', Emerging and Selected Topics in Power Electronics, IEEE Journal of. 2014;2(2):132-42.
2. C Angelo, G Bossio, S Giaccone, M Valla, J Solsona, G García. 'Online model-based stator-fault detection and identification in induction motors', Industrial Electronics, IEEE Transactions on. 2009;56(11):4671-80.
3. C Kallesøe, 'Model-based stator fault detection in induction motors', Industry Applications Society Annual Meeting, 2008 IAS'08 IEEE; 2008: IEEE.
4. S Bachir, S Tnani, J Trigeassou, G Champenois, 'Diagnosis by parameter estimation of stator and rotor faults occurring in induction machines', Industrial Electronics, IEEE Transactions on. 2006;53(3):963-73.
5. C Chakraborty, V Verma, 'Speed and current sensor fault detection and isolation technique for induction motor drive using axes transformation', Industrial Electronics, IEEE Transactions on. 2015;62(3):1943-54.
6. S Kommuri, J Rath, K Veluvolu, M Defoort, 'An induction motor sensor fault detection and isolation based on higher order sliding mode decoupled current controller', Control Conference (ECC), 2014 European; 2014: IEEE. 7. S Golabi, E Babaei, M Sharifian, Z Golabi, 'Application of Speed, Rotor Flux, Electromagnetic, Load Torque
Observers and Diagnostic System in a Vector-Controlled High-Power Traction Motor Drive', Arabian Journal for Science and Engineering. 2014;39(4):2979-96.
10 15 20 25 30 0 200 400 600 800
MSB Slice at Supply Frequency from Voltage Signal
Frequency(Hz) M S B es ti m at er (V 2) BL TB50 TB100 6 6.5 7 200 400 600 800 M S B es ti m at er (V 2) f r3 24 24.5 25 200 400 600 800 Frequency(Hz) f r1 30 30.5 31 200 400 600 800 f r2
8. S Kia, H Henao, G Capolino, 'Torsional vibration effects on induction machine current and torque signatures in gearbox-based electromechanical system', Industrial Electronics, IEEE Transactions on. 2009;56(11):4689-99. 9. J Guzinski, M Diguet, Z Krzeminski, A Lewicki, H Abu-Rub, 'Application of speed and load torque observers in
high-speed train drive for diagnostic purposes'. Industrial Electronics, IEEE Transactions on. 2009;56(1):248-56. 10. M Wieczorek, E Rosolowski, 'Modelling of induction motor for simulation of internal faults', Modern Electric
Power Systems (MEPS), 2010 Proceedings of the International Symposium; 2010: IEEE. 11. H Razik, 'Handbook of Asynchronous Machines with Variable Speed' John Wiley & Sons; 2013.
12. K Shi, T Chan, Y Wong, S Ho, 'Speed estimation of an induction motor drive using an optimized extended Kalman filter', Industrial Electronics, IEEE Transactions on. 2002;49(1):124-33.
13. T. Kwon, M Shin, D Hyun, 'Speed sensorless stator flux-oriented control of induction motor in the field weakening region using Luenberger observer', Power Electronics, IEEE Transactions on. 2005;20(4):864-9. 14. C Lascu, G Andreescu, 'Sliding-mode observer and improved integrator with DC-offset compensation for flux
estimation in sensorless-controlled induction motors', Industrial Electronics, IEEE Transactions on. 2006;53(3):785-94.
15. G Besançon, A, Ţiclea 'State observers for estimation problems in induction motors. AC Electric Motors Control: Advanced Design Techniques and Applications', 2013:57-77.
16. E Zerdali, M Barut, 'MRAS based real-time speed-sensorless control of induction motor with optimized fuzzy-PI controller. Sensorless Control for Electrical Drives and Predictive Control of Electrical Drives and Power Electronics', (SLED/PRECEDE), 2013 IEEE International Symposium on; 2013: IEEE.
17. S Kia, H Henao, G Capolino, 'Torsional vibration monitoring using induction machine electromagnetic torque estimation', Industrial Electronics, IEEE Transactions on. [34th Annual Conference of IEEE]. 2008 Nov. 2008(10-13 Nov. 2008):3120-5.
18. S Ding, 'Model-based fault diagnosis techniques: design schemes, algorithms, and tools', Springer Science & Business Media; 2008.
19. S Simani, C Fantuzzi, R Patton, 'Model-based fault diagnosis in dynamic systems using identification techniques', Springer Science & Business Media; 2013.
20. R Patton, J Chen, 'Observer-based fault detection and isolation: robustness and applications', Control Engineering Practice. 1997;5(5):671-82.
21. S Abusaad, A Benghozzi, K Brethee, F Gu, A Ball, Investigating the Effect of Water Contamination on Gearbox Lubrication based upon Motor Control Data from a Sensorless Drive', 3rd International Workshop and Congress on eMaintenance; Published in the Proceedings of the 3rd International Workshop and Congress on eMaintenance, 2014, 978-91-7439-972-1.
22. F Gu, Y Shao, N Hu, B Fazenda, A Ball, editors. Motor current signal analysis using a modified bispectrum for machine fault diagnosis. ICCAS-SICE, 2009; 2009: IEEE
![Figure 2. Observer and residual generator structure, redrawn [20]](https://thumb-us.123doks.com/thumbv2/123dok_us/9019961.2799823/4.892.153.738.656.862/figure-observer-residual-generator-structure-redrawn.webp)