INTRODUCTION
“It’s the most enjoyable way to make a living there is.” Little did I know at the time, but these words were to change my life in the most radical fashion. Back then, late 1994, I was working in one of the most tedious jobs in racing, and was desperate to find a career that offered an element of job satisfaction.
By March 1995 I had released myself from the mundane routine of 9 to 5 employment and joined a small group of people who simply bet for a living.
The influence which had such a dramatic effect on my lifestyle was that of a fellow professional gambler whom I shall refer to as John. John is one of the major players; his main problem is finding a bookmaker to bet with, whereas mine is finding a horse to bet on. John is quite simply a master craftsman. He is, in my opinion, the best judge of a horse’s potential there is. Simply by watching a horse run he is able to determine its optimum racing conditions, and to pinpoint any potential weaknesses.
As an example, consider the case of Callisoe Bay. In early 1995, Callisoe Bay was considered to be the best 2 mile novice hurdler in training. This was based on two impressive wins at Wetherby and Newbury, by an aggregate of 30 lengths. It was even debated whether he should miss the top novice events at Cheltenham and instead race in the Champion Hurdle, so highly was he considered. Before his third race, at Sandown, I discussed his potential with John, and informed him that I thought the horse was an absolute certainty. The betting supported this view with Callisoe Bay at 1/2 and his nearest rival, Silver Wedge, a good novice trained at the time by David Nicholson, priced at 4/1. “I’m a little worried”, John replied, “I can just see him being caught in the last two hundred yards.” Now, Sandown has a stiff uphill finish, and after leading throughout the race it was whilst climbing this hill that Callisoe Bay was indeed caught by Silver Wedge, and passed. I stood open-mouthed, how did he know?
This is just a hint of John’s ability. However, coupled with this talent for horse-watching, he possesses an extensive knowledge of the form book, a phenomenal memory and, probably most important of all, an acute awareness of value. To John price is everything. This is a concept that punters, myself included, find most difficult to grasp. For John to have a bet the price must be right. I have seen him ignore the horse he thinks is the most likely winner and instead back a different horse in the race simply due to price.
Whilst the main aim of this book is not to dissect the analytical processes of a professional gambler (even if this could be achieved), I will be using a great deal of information gleaned from John and other colleagues to illustrate to the reader the issues which need to be considered when assessing horses for betting purposes. For instance, the concept of value in betting, the importance of previous race times, and the effect of the draw.
Many hundreds of books have been written promising the reader that it is possible to make a fortune from betting on racing. The majority adopt a standard form. Detailed explanations are given regarding the configuration of the racecourses, and the importance of making sure your selection is suited by the race distance and going, has good recent form, is trained at a top stable and ridden by a top jockey. Quite honestly, while this is good solid stuff it is rather disappointing to read it again and again in almost every racing book when all the while hoping to find a new, innovative approach to racehorse selection. I will make a guarantee to the reader that he/she will not have to dredge through pages of tenuous, woolly comments of the make sure the horse is suited by left handed tracks kind in this book.
At the risk of upsetting the traditionalists, I would go so far as saying that the conventional approach to racehorse selection will only lead to a long term loss. On average the bookmaker bets to an over-round of about 30% (see Part I)
and has at his/her disposal all the information available to the general public. So in order for the punter to return a long term profit the bookmaker has either to display appalling judgement, or the punter needs to be so accurate at analysing the race and converting the findings to true probabilities that he/she can turn this huge loss into a positive gain.
Naturally, off-course punters can take early prices (on about 30% of races) or early shows in an attempt to beat the book, but the margin of loss is so great that, in general, it is still unlikely they will make a profit. After all John’s profit is only between 10p and 15p per £1 staked, and that is with zero tax since he only bets on-course.
An alternative is to adopt an unconventional approach to racehorse selection. This book is the result of the analysis of tens of thousands of races with the sole aim of identifying profitable betting approaches that differ from the conventional theory.
In Part I some general issues relating to Flat racing in Great Britain are outlined before a detailed investigation into several strategies for highlighting potentially profitable juvenile runners is presented. This is followed by an examination of non-juvenile horse races where special attention is paid to the use of race times, previous race details and the effect of the draw. Part II considers several issues concerning bets and betting. An examination of the concept of value in betting is followed by a comparison between each way and win only betting strategies. Win only Tote betting is then suggested as a value alternative to starting price betting under certain conditions, and the section ends with a look at forecast betting.
Notation
Throughout this text the following notation will be used to illustrate returns from a number of bets: six bets with two winners at 3/1 and 5/1 would be summarised as follows:
Bets Wins (%) Return/£
6 2 (33.3) 0.67
In the above example, the six bets produced a return of £4 to a £1 stake (i.e. +3+5-1-1-1-1 = 4), therefore the average return per bet is 4 ÷ 6 (total return divided by the number of bets) = 0.67. It should be noted that a return of 0.09 would simply be sufficient to cover the cost of tax (at 9%), anything less would result in a loss. Finally, all bets referred to throughout this book are win singles unless otherwise stated.
PART I
SELECTION METHODS FOR
FLAT RACING
SELECTION METHODS FOR
FLAT RACING
Ah, what dusty answer gets the soul When hot for certainties in this our life. G Meredith (1909)
The turf Flat racing season in Great Britain starts in late March and ends in early November. Recently it has been supplemented by all weather racing and Flat racing now runs through all twelve months of the year. In 1996 the number of racecourses in Great Britain totalled 59, and more than half of these will share about 4500 flat races scheduled to take place during the year.
These four and a half thousand races can be categorised in several different ways, one of the most convenient of which is age. Two-year-old horses (juveniles) do not start racing until the start of the turf season in late March. Approximately 24% of all races are confined to juvenile horses. Non-juvenile horses, those of three years and upwards, contest the remaining 76% of races. This age distinction is very important in Flat racing. Only a handful of races each year allow juveniles to compete against older horses. Therefore, these two age groups can be analysed entirely independently.
An alternative categorisation can be made by considering the type of race. Roughly 49% of all races are handicaps (known as nurseries if confined to two-year-old horses only). The main difference between handicaps and
non-handicaps is that in the case of non-handicaps each horse is assigned a different weight to carry by a team of handicappers employed by the British Horseracing Board (BHB). The aim is to give all horses the same chance of winning by penalising the better animals by giving them more weight to carry. Consequently, these races are invariably more competitive than non-handicaps, and thus harder for the punter to solve. However the prices offered by the bookmakers should be higher to compensate for the extra degree of difficulty.
Races may also be broken down by race distance. Races over 5 and 6 furlongs (1 furlong = 1/8 mile) are known as sprints, whilst those of over 14f are referred to as stamina races. The distribution of races by race distance is given below:
Race Distance (f) 5-6 7-9 10-13 14+
Percentage of Races 30.9 36.0 25.7 7.4 Due to Britain’s unpredictable weather, and the fact that the majority of races are run on turf, the underfoot conditions on which the horses race (going) can vary from meeting to meeting. The going is classified into 7 categories: Hard (the driest, firmest ground), Firm, Good to Firm, Good, Good to Soft, Soft and Heavy (the wettest, softest ground). There are a further two classifications for all weather surfaces: Fibresand and Equitrack. The all weather tracks at Southwell and Wolverhampton are constructed from Fibresand, whereas the artificial surface at Lingfield is an Equitrack surface.
Clearly, Flat racing is very varied in this country offering the punter a wide choice of race types over different distances on which to bet. Whilst this variability may offer the punter a certain amount of entertainment value, a more important issue is: how does racing compare to other forms of gambling with respect to return per bet? Backing every horse in every race would, as expected show a loss. In fact, backing every horse in the last 18,000 races would show a loss of 32p per £1 staked, and that’s before tax.
What about the lucky pin approach? Selecting a horse at random in the last 10,000 races shows the following return:
Average
Bets Winners (%) Return/£1
10,000 1108 (11.1) -0.30
Therefore, on average, applying no skill to your horse selection would result in a loss of approximately 30p per £1 staked, betting at starting price. Add to this the cost of off-course betting tax (9%) and you would show a loss in the region of 40p per £1 staked.
This does, though, compare favourably with the National Lottery. The average loss per £1 staked on the National Lottery is an incredible 50p, although this includes tax. According to Tony Drapkin and Richard Forsyth, authors of The Punter’s Revenge, a book I recommend for anyone interested in betting, especially those with access to a computer, the average loss for football pools is a staggering 73p per £1 staked. So we are obviously targeting the best option by concentrating on horseracing although it should be remembered that both Premium Bonds and the stock market offer a positive return per £1 invested, even if you select your share portfolio with no prior knowledge of the companies.
Calculating the return based on a random selection is not as pointless as it at first may seem. Since the starting price of the horse reflects the animal’s chances to a reasonable degree of accuracy, the average return based on a random selection is a fair measure of the likely return against which to compare other selection methods. In other words, it shows how far the odds are stacked against the punter.
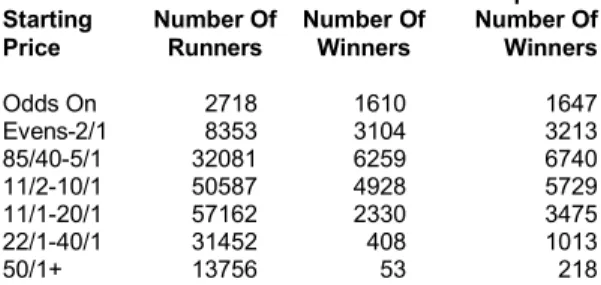
But how far does the starting price reflect the true chances of success? By converting the starting price to a probability it is possible to estimate how many winners would be expected over a period of time for each starting price category. The following table compares the actual
number of winners against the expected number within each starting price band for approximately 200,000 race performances.
Table 1: Expected Number of Winners by Starting Price Expected† Starting Number Of Number Of Number Of
Price Runners Winners Winners
Odds On 2718 1610 1647 Evens-2/1 8353 3104 3213 85/40-5/1 32081 6259 6740 11/2-10/1 50587 4928 5729 11/1-20/1 57162 2330 3475 22/1-40/1 31452 408 1013 50/1+ 13756 53 218
† the expected number of winners is calculated from the starting price, therefore if the starting price exactly reflected the probability of success, the two right-most columns of the table would be the equal.
The fact that the figures in the expected column always exceed the equivalent values in the Number Of Winners column is to be expected; this simply reflects the bookmakers margin. If a pair of the figures were similar it could be concluded that, for this particular price band, the odds accurately represent the probability of success. The most interesting feature of the table is that the two winners columns diverge significantly as the starting price increases. For the odds on category, the difference is only minor, the actual number of winners equates to 98% of the expected number. However for the 22/1-40/1 price band the actual number of winners only amounts to 40% of those expected, and for the highest price band the percentage is just 24%. This illustrates one key fact: taken over a season as a whole, the higher priced horses represent poorer value. This can be further demonstrated by expanding the table of random selections.
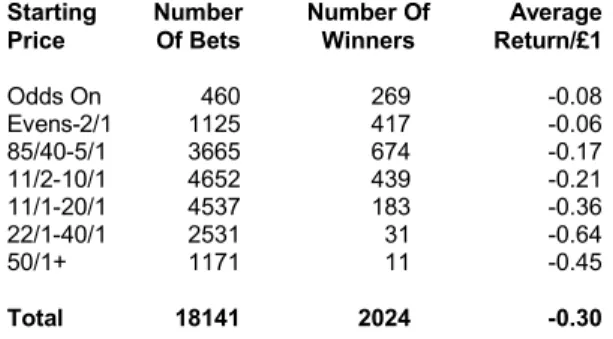
Table 2: Average Return by Starting Price
Starting Number Number Of Average
Price Of Bets Winners Return/£1
Odds On 460 269 -0.08 Evens-2/1 1125 417 -0.06 85/40-5/1 3665 674 -0.17 11/2-10/1 4652 439 -0.21 11/1-20/1 4537 183 -0.36 22/1-40/1 2531 31 -0.64 50/1+ 1171 11 -0.45 Total 18141 2024 -0.30
From Table 2 it can be seen that, on average, the higher priced horses (e.g. 11/1 and over) are very much under priced. Simply by modifying our random selection method to only pick horses that start at 10/1 or less reduces our loss per £1 bet from 30p to 18p. This bias in the starting price is an important facet of betting on Flat racing and is an issue we will return to in later sections.
In this section I have tried to illustrate how the odds are stacked in favour of the bookmaker, and to show that whilst some bets may appear more attractive (i.e. a 33/1 shot) they are, in fact, offering a poor rate of return when compared with the likely chance of success.
In the following section we concentrate on selection methods for two-year-old horses, and the factors that should be considered before placing a bet.
J
UVENILESBackground Data
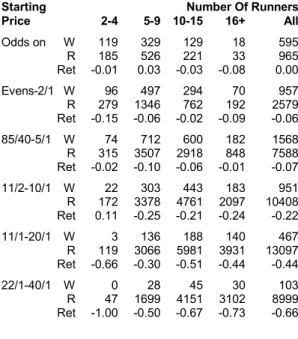
The previous section examined the relationship between the starting price and the likely success rate, and established that the price provides an accurate guide to the probability of a win but the higher prices substantially over estimate the probability. This trend also holds true for two-year-old horses, except that the poor value offered by the higher priced horses is accentuated. Table 3 illustrates this pattern:
Table 3: Average Return by Starting Price and Number of Runners
Starting Number Of Runners
Price 2-4 5-9 10-15 16+ All Odds on W 119 329 129 18 595 R 185 526 221 33 965 Ret -0.01 0.03 -0.03 -0.08 0.00 Evens-2/1 W 96 497 294 70 957 R 279 1346 762 192 2579 Ret -0.15 -0.06 -0.02 -0.09 -0.06 85/40-5/1 W 74 712 600 182 1568 R 315 3507 2918 848 7588 Ret -0.02 -0.10 -0.06 -0.01 -0.07 11/2-10/1 W 22 303 443 183 951 R 172 3378 4761 2097 10408 Ret 0.11 -0.25 -0.21 -0.24 -0.22 11/1-20/1 W 3 136 188 140 467 R 119 3066 5981 3931 13097 Ret -0.66 -0.30 -0.51 -0.44 -0.44 22/1-40/1 W 0 28 45 30 103 R 47 1699 4151 3102 8999 Ret -1.00 -0.50 -0.67 -0.73 -0.66
(Table 3 continued) 50/1+ W 0 3 6 3 12 R 18 779 1737 1479 4013 Ret -1.00 -0.80 -0.81 -0.90 -0.84 Total W 314 2008 1705 626 4653 R 1135 14301 20531 11682 47649 Ret -0.15 -0.26 -0.41 -0.50 -0.38 In the above table, W indicates the number of winners, R the number of runners and Ret the average return per £1 staked. The loss per £1 staked for all two-year-olds is 38p, which exceeds the figure calculated for horses of any age (see previous section), and when the off-course tax liability is added the total loss per bet is nearing that of the National Lottery.
Again, the price of horses with a low probability of success, namely those priced at 20/1 or more, is greatly under stated. The most likely explanation for this fact is that two-year-olds are largely unexposed given that many will be making their racecourse debut and those with racing experience will not have raced many times. Consequently, bookmakers err on the side of caution and price the animals very conservatively. Interestingly, this feature seems to be independent of the number of runners in the race with the huge loss continued across all different runner categories. Given that the starting price offers such poor value for these low probability horses, does the Tote offer a better alternative? The following table is the result of analysing over 7,500 race performances for horses starting at more than 20/1 and comparing the starting price return with the Tote win return:
Average Average
Bets SP Return/£1 Tote Return/£1
7,565 -0.71 -0.56
Clearly, the Tote offers a better rate of return, but hardly enough to inspire a punter searching for a value bet.
Future Champions?
On the positive side though, the lower priced horses (i.e. horses priced up to 5/1) show a better rate of return than in the all-age analysis (-0.06 compared to -0.14) and the odds on shots show no loss at all. This trend is continued for juveniles making their first ever racecourse appearance which implies that the ability of the better two-year-old horses is known before they race. In other words, stable talk regarding the ability of the better two-year-old horses should not be dismissed out of hand.
To support this further, an analysis of 35 three-year-old Group I winners shows that 46% started favourite on their first run at two, and 60% started at less than 11/2. Furthermore, 71% finished in the first three on their racecourse debuts with 46% winning. All very interesting, but how does this help us to make money? Well, given that we are confidently able to identify horses with winning potential from their first run, it should be possible to turn this into profit.
Juveniles which win on their first run are not considered further, it is those which we know to be good animals but are beaten first time out which are most interesting. Of 72 two-year-old horses that started at evens or less on their racecourse debut and were beaten in the period 1989-94, 32 won on their next run giving an average profit of 0.41. Of the 40 horses which failed to win on their second run, 25 ran a third time with 10 winning, showing a profit of 0.31. Finally, of the 15 horses yet to win, 11 ran a fourth time with 3 winning, profit 0.15. Therefore, the following selection method should be borne in mind when considering two-year-old horses:
consider backing any two-year-old horse, which was beaten at evens or less on its debut, until it wins or has raced a further three times: expected profit 36p per £1 staked.
This theory can be extended further by introducing a date component. Since the better horses tend to make their debuts later in the year, it seems sensible to restrict the analysis to the period June to October. The following results were generated by considering all beaten first time out two-year-old favourites on their next racecourse outing, within the period June to October: 108 winners from 349 bets, profit 0.24. Whilst this is less than the 36p per £1 achieved previously, it is significantly higher than the expected 38p loss and greater than the percentage most professional gamblers hope to achieve. Therefore,
consider backing any two-year-old horse from June to October, which was a beaten favourite (or joint favourite) on its debut, on its next run: expected profit 24p per £1 staked.
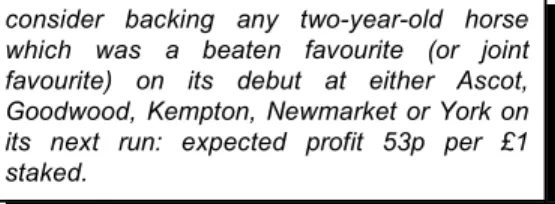
This selection technique can be further refined by considering the type of track on which the horse made its debut. The more prestigious courses seem to produce higher returns from their debutantes. For instance, restricting the above procedure to include only horses making their debuts at Ascot, Goodwood, Kempton, Newmarket, and York improves the return to 53p per £1 staked from 88 bets over the period 1989-94. Therefore,
consider backing any two-year-old horse which was a beaten favourite (or joint favourite) on its debut at either Ascot, Goodwood, Kempton, Newmarket or York on its next run: expected profit 53p per £1 staked.
Form Analysis
We have seen that winning form is not necessarily the most critical variable when looking for ways to make a profit. The following table shows the win rate and average return for juveniles categorised by their most recent racecourse performance:
Table 4: Average Return and Strike Rate by Distance Beaten on Latest Start
Distance
Beaten Average
Last Time† Winners (%) Runners Return/£1
0 711 (19.2) 3703 -0.22 0.01-0.1 46 (20.2) 228 -0.27 0.11-1.0 405 (22.5) 1803 -0.12 1.01-2.0 316 (18.6) 1695 -0.20 2.01-3.0 331 (17.6) 1879 -0.19 3.01-4.0 272 (15.0) 1819 -0.21 4.01-5.0 234 (13.3) 1760 -0.27 5.01-10.0 796 (9.7) 8191 -0.28 10.01-20.0 500 (5.0) 9947 -0.50 20+ lengths 135 (3.2) 4280 -0.59 All 3746 (10.6) 35305 -0.35
† distance beaten last time is given in horse lengths.
There is not a great deal to help us in Table 4, however it is interesting to see how the percentage of winners to runners declines as the distance beaten last time increases. The strike rate for horses beaten up to one
length last time is just over 20%, whereas for those beaten over 5 lengths it is only a little over 6%. However, this poorer strike rate isn’t fully reflected in the starting price as demonstrated by the declining average return, to a loss of 59p per £1.
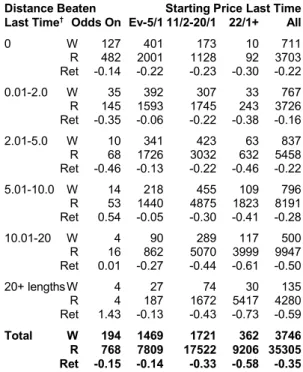
Table 5: Average Return by Distance Beaten and Starting Price on Latest Start
Distance Beaten Starting Price Last Time Last Time† Odds On Ev-5/1 11/2-20/1 22/1+ All
0 W 127 401 173 10 711 R 482 2001 1128 92 3703 Ret -0.14 -0.22 -0.23 -0.30 -0.22 0.01-2.0 W 35 392 307 33 767 R 145 1593 1745 243 3726 Ret -0.35 -0.06 -0.22 -0.38 -0.16 2.01-5.0 W 10 341 423 63 837 R 68 1726 3032 632 5458 Ret -0.46 -0.13 -0.22 -0.46 -0.22 5.01-10.0 W 14 218 455 109 796 R 53 1440 4875 1823 8191 Ret 0.54 -0.05 -0.30 -0.41 -0.28 10.01-20 W 4 90 289 117 500 R 16 862 5070 3999 9947 Ret 0.01 -0.27 -0.44 -0.61 -0.50 20+ lengthsW 4 27 74 30 135 R 4 187 1672 5417 4280 Ret 1.43 -0.13 -0.43 -0.73 -0.59 Total W 194 1469 1721 362 3746 R 768 7809 17522 9206 35305 Ret -0.15 -0.14 -0.33 -0.58 -0.35 † distance beaten last time is given in horse lengths. In the above table, W indicates the number of winners, R the number of runners and Ret the average return per £1 staked.
Table 5 above shows that although horses beaten a long way last time out show a poor return in general, a better determining factor to their potential profitability is the price at which they started. This ties in with our earlier findings
relating to first time out favourites and shows that horses should not be excluded from calculations simply because they performed poorly on their most recent run. Starting at a short price for their last race indicates a certain level of perceived ability (or potential) and therefore they should not be discounted due to one poor run, especially since their price is possibly now over stated. Therefore,
consider backing any two-year-old horse that was beaten more than five lengths last time and started at odds on: expected profit 47p per £1 staked.
This theory runs counter to conventional race analysis arguments which tend to prefer animals with good recent form. It is purely this fact that makes the well beaten short priced horse a good bet on its next run.
This selection method also demonstrates the difference between looking for runners which are expected to provide a profitable long term return and merely backing the animals which appear most likely to win.
Nurseries and the Time Factor
Handicaps for two-year-old horses are notoriously difficult to solve. Normally, they are contested by large fields of unexposed, probably improving, animals with the added problem of the weight differences introduced by the BHB handicappers. You may have guessed that this is not a type of race with which I am particularly enamoured. However, there is a way of generating a profit from a small number of bets each season, but firstly we need to consider some general points about nurseries.
In essence, a two-year-old may run in a nursery if it has been allotted a handicap mark by the BHB. Before it can be handicapped it must either have won a race or have raced three times. Therefore, horses can appear in
nurseries after finishing well beaten in non-handicap events and thus be almost impossible to handicap, especially if they have been tenderly handled and have only really been racing to gain experience. How can an accurate assessment be made of a horse which has finished mid-division in three large fields, not finishing within 10 lengths of the winner?
Not withstanding the problems associated with this race type, winners can be found by closely studying race times. Alex Bird commented that any two-year-old which produces a race time which is faster than older horses over the same distance on the same track on the same day must have above average ability. This is the principle we can use.
Analysing all juveniles which qualify under the above criterion for the 1992-94 Flat racing seasons produced the following results: backing the selected juveniles until they win or have raced a further three times produced 10 winners from 66 bets, with a profit of 0.37. Therefore,
consider backing any two-year-old horse, which won or was beaten less than 1 length in a nursery in a time better than the older horses over the same distance on the same track on the same day, until it wins or has raced a further three times: expected profit 37p per £1 staked.
This selection procedure is based on a sound theoretical approach, unfortunately there are very few bets each year, and at 15% the winners to runners strike rate is on the low side.
Calculating Speed Figures for Juveniles
In general, race times can be very informative for two-year-old horses. It is possible to extend the above approach to
generate ratings for the majority of juvenile runners. Speed ratings can be calculated by combining the race time achieved by the two-year-old, the weight it carried, a race time produced by an older horse in a handicap over the same distance at the course, the weight it carried and the BHB handicap mark for the older horse. The rating can be calculated as follows:
1. Subtract the time (in seconds) produced by the 2-y.o from that produced by the older horse and multiply by 18.
2. Add the weight carried (in pounds) by the 2-y.o and subtract the weight carried by the older horse.
3. Add the BHB handicap rating for the older horse. 4. If the older horse is 4 years or older, add the weight
allowance 3-y.o’s receive from older horses.
5. If the 2-y.o was beaten, multiply the distance beaten by 15 and divide by the distance of the race (in furlongs) and subtract this from the total.
Given further explanation it is quite easy to see how the above formula works. Step 1 converts the time difference between the two races into pounds, the standard unit for expressing ability. The 18 is simply derived from the average number of lengths a two-year-old horse travels per second, 6, multiplied by the weight allowed per length, normally 3lbs. (The weight allowance per length varies as the race distance varies and is best determined by dividing the race distance in furlongs into 15, so for 5f races the value is 3lbs, and for 10 furlong races the value is 1½lbs. Therefore, this routine could be improved, but further complicated, by using 6 multiplied by 15 divided by the race distance instead of the 18.) Step 2 adjusts for the difference in weight carried by the horses. Step 3 introduces the BHB handicap rating, the basis for the time rating. The fourth step adjusts for the maturity of the older horse, to allow 2-y.o’s to be compared with horses of any age. The final step simply uses the procedure outlined above to reduce the rating for beaten two-year-old horses. This routine produces reasonable time ratings, but it is important to ensure that the two comparison races are
directly comparable, namely over the course and distance and that the non-juvenile race is a handicap. In strict terms only races taking place on the same day should be used. However, if a comparable race is not available, it is possible to compare with a race staged either the day before or the day after, providing the ground conditions have not changed significantly. Use the race times to determine whether the going has changed, don’t rely on the BHB going reports which leave a great deal to be desired in terms of accuracy.
Speed Figure Calculation - Example 1
Alhaarth, a two-year-old trained by Major Hern made his debut on the July course at Newmarket on 11 July 1995. He started favourite at 7/2 in a 16 runner 7 furlong maiden, and won carrying 9st in a time of 1m 26.32s, 1.96 seconds slower than the standard time. On the same day, Bouche Bee, a three-year-old trained by L Cumani won a 7 furlong class B handicap on the same course, carrying 8st 3lbs and taking 1m27.06s, 2.66 seconds slower than the standard time. Bouche Bee was rated 87 at the time by the BHB. To calculate Alhaarth’s speed figure for the race: Step 1 Find the difference in the times and multiply by 18.
87.06 - 86.32 = 0.74
0.74 x 18 = 13.32
Step 2 Add weight carried by 2yo, subtract weight carried by older horse.
13.32 + 126 - 115 = 24.32
Step 3 Add BHB handicap rating for the older horse.
24.32 + 87 = 111.32
Step 4 Not applicable for these races. Step 5 Not applicable for this horse.
Final rating 111.
Speed Figure Calculation - Example 2
Dark Deed, a two-year-old filly trained by B Hills made her racecourse debut at Newbury over 6 furlongs on 11 August 1995. She carried 8st 11lbs and was beaten 3¾ lengths by Bosra Sham who recorded a time of 1m 13.87s, 2.07 seconds slower than the standard time. On the same card, Great Hall, a six year old trained by P Cundell won the 6 furlong sprint carrying 7st 5lbs in a time of 1m 13.61s, 1.81 seconds slower than the standard time. Great Hall was rated 57 by the BHB at the time. To calculate Dark Deed’s speed rating:
Step 1 Find the difference in the times and multiply by 18.
73.61 - 73.87 = -0.26
-0.26 x 18 = -4.68
Step 2 Add weight carried by 2yo, subtract weight carried by older horse.
-4.68 + 123 - 103 = 15.32
Step 3 Add BHB handicap rating for the older horse.
15.32 + 57 = 72.32
Step 4 Adjust for weight-for-age.
72.32 + 5 = 77.32
Step 5 Adjust for the distance beaten. 77.32 - (3.75x15÷6) = 67.95 Final rating 68.
It is important to note that the ratings calculated using the above procedure are not directly comparable, in absolute terms, to ratings published by other organisations, i.e. Raceform, Timeform and BHB. For instance, the BHB rating for Dark Deed may be vastly different from the 68 we have calculated, however this would be due, in part, to a difference in scale. The BHB, and other organisations, use a fixed scale to allow the comparison of juvenile ratings with ratings for older horses, and to compare with animals from other countries. We are simply using the ratings to indicate the relative merits of the two-year-old horses running in a particular season and therefore can use any scale we choose. For example, we could add 20 lbs to each rating and not change their meaning, since the difference between the ratings of two horses would remain the same. For example, no matter how we change the scale, Alhaarth will always be 43 lbs superior to Dark Deed based on just these two runs alone.
The main advantage with these approaches is that they both side-step the inherent problems of race time analysis, namely differences in racecourse configuration and variability of ground conditions. When comparing times from different race courses it is necessary to adjust each time for type of track and going. Some courses place little emphasis on stamina, such as Epsom where the 5f course is mainly downhill, which enables horses to complete the course in approximately 55 seconds. In contrast, the sprint course at Beverley is extremely stiff with horses taking about 62 seconds to complete an equivalent distance. The differences in going are even harder to handle. The going is not measured at all accurately in this country, and the only way to assess the speed of the track is to examine the race times after racing. (See the non-juvenile section for a discussion on the going allowance.)
Since the above procedures only compare horses running on the same track on the same day, the state of the ground and the stiffness of the course can be safely ignored (unless there is significant rain during the afternoon,
changing the state of the ground), simplifying the calculations considerably.
Using Speed Figures
Once calculated the juvenile speed figures can be used in three different ways. Firstly, there is the conventional approach of taking a speed rating for each horse in a race, adjusting for the weight carried, and using the resultant figures as a guide to the chances of each horse. As an example, we will take the Stamford Bridge Conditions Stakes run at York on the 7 October 1995. The runners with their respective weights, speed figures and adjusted speed figures are given below.
Table 6: Adjusted Speed Figures for the Stamford Bridge Conditions Stakes
Raw Adjusted
Speed Speed
Horse Weight (lbs) Figure Figure
Tria Kemata 9-0 (126) 54 54
Sualtach 8-12 (124) 41 43
Believe Me 8-9 (121) 70 75
Bullfinch 8-9 (121) 44 49
From the ratings (the best each horse has achieved in its last three runs), this looks any easy race for Believe Me. However, although Believe Me won at odds of 9/2 it was only by a neck from Bullfinch (5/2), with a further ½ length back to the even money favourite Tria Kemata. Sualtach was virtually pulled up in fourth. Interestingly, the first three had met on their last start with Tria Kemata winning the race with about 3½ lengths to spare over Believe Me in fifth, and Bullfinch a further 2½ back in sixth. This explains why Tria Kemata started a short priced favourite. I ought to point out here that I do not use the speed figures in this conventional fashion, I tend to prefer the following two options.
The second way of utilising the speed figures concerns ante-post betting. It is possible to highlight exceptional two-year-old horses just from speed figures. If the horse records a good relative time early on in its career it may be possible to secure a big price ante-post for one of the following year’s classics, safe in the knowledge that the animal is well above average ability. Using a purely form based guide it is almost impossible to place an ante-post bet at reasonable odds, since as soon as the horse races against, and beats the higher rated horses, its ante-post price is reduced before a bet is possible. Ante-post prices are not just contracted due to weight of money, if a two-year-old horse produces an impressive performance its price is reduced immediately, before further money is taken.
The third, and in my opinion most valuable, facet of the speed figures concerns rating races as opposed to horses. If a winner records a particularly good figure it is worth noting those horses which finished behind it. In this case, the speed figure is used as a guide to the quality of the race. For instance, when Alhaarth recorded the 111 on 11 July, it was by far the best juvenile rating recorded by that stage of the 1995 season. This indicated that the race was of above average quality and that the runners who finished within a reasonable distance of Alhaarth were worth following. In fact, of the 16 runners, 9 went on to win at least one race, and four out of the first five (those within seven lengths of the winner) won subsequent races. The advantage of following animals of this type is that the form is initially hard to assess since, in all probability, very few of the horses will have run before. This absence of form lines provides the ideal situation for the speed figure punter who is in possession of the only reliable guide to the quality of the race.
Summary
Juveniles provide a good source of profit, especially those which are highly regarded but fail early on in their careers.
The higher priced runners should be avoided unless they have previously raced at much shorter odds showing that they are thought to have some potential, however well it may be hidden. Pay special regard to those animals well beaten at short prices at the more prestigious racecourses. Finally, avoid nursery races, unless a horse records a particularly good time compared to older animals, and make use of the speed figures in a way that best suits your style of betting.
N
ON-J
UVENILESRaces for non-juveniles (i.e. those horses aged three years and upwards) make up the majority of all flat races in Great Britain. They can be categorised into three classes: pattern races, Other non-handicaps and handicaps. Pattern races are the most prestigious races and are subdivided into Group 1, Group 2, Group 3 and Listed races. Group 1 events carry the most prize money, with all the classics carrying Group 1 status. For the purposes of continuity and comparison, Listed races could be thought of as Group 4 events since they carry the lowest prize money of all the pattern races. Other non-handicaps is a term used to refer to all non pattern races in which horses are not allotted weight by the BHB handicappers relative to their abilities. Therefore, this grouping covers maidens, claimers, stakes races, selling races and some amateur, apprentice and Ladies races. Handicaps make up the remainder of races.
Pattern events are normally considered the most reliable race type for betting purposes simply because they are contested by the best animals. At the other end of the scale, poor quality selling races are often contested by the poorest horses in training, and those of dubious character and temperament, and the punter cannot be entirely sure whether his/her selection will actually make an effort to win. Handicap races on the flat are very competitive, especially the sprints, and therefore are often the most difficult to solve.
The better flat racehorses tend to stop racing after their three- or four-year-old seasons much to the disappointment of their supporters. Some animals, however, are campaigned for many seasons with a few still racing after they have reached double figures. The age of a horse is often overlooked by the punter when making a selection, but as the following table shows it is a variable that should be considered:
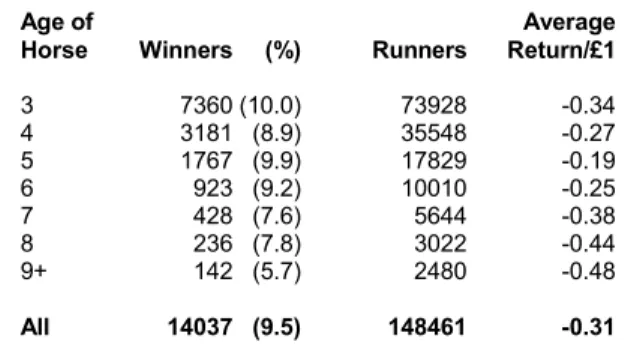
Table 7: Average Return and Strike Rate By Age of Horse
Age of Average
Horse Winners (%) Runners Return/£1
3 7360 (10.0) 73928 -0.34 4 3181 (8.9) 35548 -0.27 5 1767 (9.9) 17829 -0.19 6 923 (9.2) 10010 -0.25 7 428 (7.6) 5644 -0.38 8 236 (7.8) 3022 -0.44 9+ 142 (5.7) 2480 -0.48 All 14037 (9.5) 148461 -0.31
Clearly, the younger horses have a better wins to runs strike rate, with seemingly a significant decrease in the percentage from ages six to seven years. A further drop in the strike rate occurs when the age of the horse exceeds eight years. This is reflected in the average return, with horses over eight years old returning a loss of 48p per £1 staked compared with an average loss of 31p per £1 for all horses. This means that the age factor is not considered by the bookmakers which makes these horses, in general, poorer value.
In the following sections we investigate ways of turning this 31p loss into a profit. Firstly, non-handicap races are considered, and special attention is paid to the use of race times to highlight future winners. Secondly, handicap races are analysed, and such factors as the draw, trainer, recent performances and previous race comments are examined.
N
ON-H
ANDICAPSWith no artificial handicapping of the runners, non-handicaps are, in general, less competitive than handicaps, and as a consequence should be easier to solve. Unfortunately, this reduced level of competition is
reflected in the prices on offer by the bookmakers and so making a profit is still difficult. However, one of the best guides to potential winners that I have found is the race time.
Using Race Times
In the section on Juveniles, we looked at how race times could be used to identify probable future winners and generate time ratings. We also covered the problems associated with using race times, specifically the unreliable nature of the going assessments and the diversity in the racecourse configurations across the country. This latter problem is, to some extent, nullified by the introduction of a race standard time. Both the trade papers, as well as Timeform and Raceform, produce standard times for each race distance on every course in Great Britain. Such times are supposed to represent the likely time a horse rated 100 by the BHB would take to run the course on good to firm going. The use of these standards enables the comparison of race times produced by different horses on different tracks, however it does not take account of the varying ground conditions.
It was mentioned earlier that the difference in the going from course to course, or even day to day, is a more difficult problem to solve than that of racecourse configuration. In his book Betting For A Living, Nick Mordin recommends the calculation of a going allowance based on the races staged on the course on a particular day. This figure can then be used to normalise for the effect of the going at different courses. To determine the going allowance, Mordin suggests that the differences between the actual race times and the standard times are first divided by the race distances and then averaged after any freak figures have been removed.
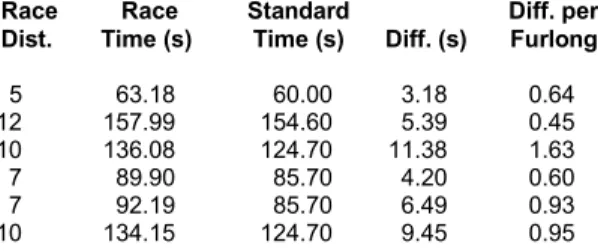
Therefore, for a six race card, the times may have been as follows:
Table 8: Calculation of Going Allowance
Race Race Standard Diff. per
Dist. Time (s) Time (s) Diff. (s) Furlong
5 63.18 60.00 3.18 0.64 12 157.99 154.60 5.39 0.45 10 136.08 124.70 11.38 1.63 7 89.90 85.70 4.20 0.60 7 92.19 85.70 6.49 0.93 10 134.15 124.70 9.45 0.95
It could be argued that the time for the third race is an outlier and should be removed from the going allowance calculation. Consequently, the going allowance becomes the average of the other five times, namely 0.71 seconds per furlong. In fact, Nick Mordin generally takes the average of the three fastest times excluding any outliers, although there are no hard and fast rules governing the number of races you use. Special attention is required for courses with different tracks. For example, Kempton and Sandown each have a sprint track running through the centre of the course. Naturally, the going could vary considerably from the main course to the sprint track, a feature which would need to be accounted for in the going allowance.
Once the going allowance has been calculated it is possible to calculate a speed figure for any runner on the card. Firstly, it is necessary to adjust the time of the winner by the going allowance, to produce a normalised time. Therefore, if the going allowance indicates that the track is riding faster than the norm, the winning time is increased accordingly. For instance, if, in a 5 furlong sprint, the track is found to be riding 0.1 seconds per furlong faster than the standard, the time of the winner should be increased by 0.5 seconds (i.e. 5 x 0.1). This new time being an estimate of the time the horse would have recorded on average going.
To convert the time to a rating it is necessary to consider the standard race time for the distance. At this point, it is
necessary to set the scale for the ratings. Normally, a horse producing a time equivalent to the standard would be given a rating of 100, before adjusting for weight carried. However, any figure could be used to determine the rating scale. The next step is to determine the difference between the standard time and the adjusted time, in seconds. This figure is multiplied by 6 (lengths run per second) and then further multiplied by the ratio of 15 to the race distance. The resultant figure is either added to, or subtracted from, 100 depending on whether the adjusted time is faster, or slower than the standard time. Finally, the figure should be adjusted for the weight carried and distance beaten by the winner. For a more detailed description of calculating speed figures see Betting For A Living by Nick Mordin.
Clearly, the power of the time analysis methods outlined in the juvenile section is derived from the fact that neither require the use of a standard time or going allowance, which are, after all, subject to their own degree of error. The following method for selecting horses with winning potential utilises the race time and standard time but not the going allowance, which, due to its approximate method of calculation, is the component subject to the highest degree of error.
Only good horses win pattern races, and if they record a time faster than the standard it implies that the race was run at a true pace and that the form is worth following. Backing any non-juvenile winner, or runner-up which finished within ½ length of the winner, of a pattern race for which the time was faster than the standard, until it wins or competes in three further races, produced the following results from the three seasons 1992-94: 26 winners from 85 bets (31% strike rate) with a profit of 0.38. Therefore,
consider backing any non-juvenile winner, or runner-up finishing within ½ length of the winner, of a pattern race for which the time recorded was faster than the standard, until it wins or has raced a further three times: expected profit 38p per £1 staked.
Naturally, whether a race is run in a time below the standard is very much dependent on the going. The qualifying performances for the 85 bets discussed above were all run on good or faster ground. Obviously, if we experience a wet summer there will be very few bets due to the softened state of the ground which is not particularly helpful if you are relying on these bets to provide an income.
Fortunately it is possible to extend the scope of this method by changing the way we use the race times. Rather than just using the races with times faster than the standard, the following method uses the best time of the day. The best time of the day is simply the fastest time relative to the standards. For example, given the six races:
Difference from
Race Number Standard Time
1 +1.8 2 +3.0 3 +2.9 4 +6.2 5 +3.9 6 +2.0
The best race time of the day was recorded in race 1 since this time is closest to the standard and all race times exceeded their comparable standards. In the next example, the best race time was recorded in race 4, the race which produced a time 4.9 seconds faster than the standard (hence the minus sign). The next best time of the day would be race 1 at 0.1 seconds under the standard.
Difference from
Race Number Standard Time
1 -0.1 2 +3.5 3 +2.6 4 -4.9 5 +9.9 6 +1.0
For this selection procedure only one horse can qualify from any one meeting in a day. However, from the above example it can be seen that it is possible for two or more horses to qualify under the previous selection routine. Backing any non-juvenile winner, or runner-up which finished within ½ length of the winner, of a Group race which produced the best time of the day until it wins or has run a further three times, produced the following results for the three seasons 1992 to 1994: 27 winners from 116 (23% strike rate) with a profit of 0.87. Therefore,
consider backing any non-juvenile winner, or runner-up finishing within ½ length of the winner, of a Group race which had the best time of the day, until it wins or has raced a further three times: expected profit 87p per £1 staked.
Although race times are difficult to interpret given the problems mentioned above, they do provide a good indicator of the likely future success of a pattern race winner, or runner-up. To generate the results given above I have used the standard times published by Raceform, and whilst I would not advise readers against using other standard times, I would certainly recommend checking the methods outlined for a season or two (historically) to make sure the different times do not have any hidden discrepancies.
Normally, one would expect time based procedures such as these to only produce qualifying horses from the longer distance races, since it should be easier to produce a faster relative time, in absolute terms, in a long distance race than in a sprint. However, the qualifying performances for 1992-94 are fairly well distributed over all races distances with only 20% of the horses qualifying in sprint races. Had this distribution been strongly biased towards one end of the race distance scale it would have been necessary to consider the ratio of the time difference from the standard to the actual race distance. Fortunately, this is not required and the simpler approaches outlined previously seem to work well.
Favourites
Some of the selection procedures we have discussed so far have relatively low wins to bets strike rates which increases the possibility of long losing runs. This can have a detrimental effect on the way we bet and result in missing good priced winners due to our natural reluctance to continue a losing sequence. Having an additional approach with a high strike rate helps to break up the long losing runs and restore a little confidence. This is where the favourites come in.
In Value Betting, Mark Coton suggests that, whilst it is dangerous to make generalisations in betting, favourites are, by definition, bad value. This it true to a certain extent, however it is possible to find some favourites which are worth supporting. These bets tend to be at either end of the race distance scale, namely, 5 furlongs and 15 furlongs plus, and in small fields. All non-handicaps were analysed for the period 1990-94 and the following results obtained. Backing all clear favourites in 5 furlong non-handicaps in fields of 2 to 4 runners would have resulted in 30 bets and 21 winners, a strike rate of 70% and a profit of 0.22. Therefore,
consider backing all clear favourites in 5 furlong non-handicap races in fields of 2 to 4 runners: expected profit 22p per £1 staked.
At the other end of the distance scale, and over the same period of analysis, backing all clear favourites in non-handicaps of 15 furlongs or more in fields of 2 to 4 runners would have resulted in 26 bets and 21 winners, a strike rate of 81% with a profit of 0.27. Therefore,
consider backing all clear favourites in non-handicaps over 15 furlongs or more in fields of 2 to 4 runners: expected profit 27p per £1 staked.
With such a high strike rate the average price of these runners is going to be low, but any long term profit should always be welcomed.
H
ANDICAPSAny punter who spends hours analysing a big field of flat handicappers in the hope of finding the winner either has time to kill or enjoys a challenge. Handicaps are notoriously difficult to solve, and it is interesting to note that the majority of races sponsored by bookmakers are handicaps, for obvious reasons. However, the property that makes this type of race such a challenge (i.e. the normalising effect of the different weights carried) also has the effect of introducing a degree of uniformity across the race grade, which is advantageous to anyone using a systematic approach to betting.
There is, sometimes, an element of confusion concerning the relationship between handicap ratings and weight carried. A handicap mark is simply a convenient way of
expressing the ability of one horse relative to another. For example, if two three-year-old colts were rated 87 and 97, the latter could be said to be 10 pounds superior to the former and in a handicap race would carry 10 pounds more weight. The ratings do not determine the amount of weight to be carried, just the weight one horse will carry relative to another. Therefore, it would be possible for these two horses to be set to carry 7-10 and 06 in one race, and 8-11 and 9-07 in another race on the same day. The absolute weight carried is determined by the rating of the highest rated horse in the race. In these two hypothetical races, the top rated horse in the first race would be rated higher than the top rated horse in the second race, by eleven pounds, in fact.
This is an important distinction to make, and it is imperative to remember that a horse carrying 9-07, for instance, is not necessarily badly handicapped, and an animal set to carry 7-07 is not guaranteed to be well handicapped. The weight carried by a horse simply reflects the overall strength of the race. Just because a flat handicapper is set to carry 10-0 is no reason to assume it cannot win.
Trainer Effect
A question that has arisen recently is whether horses trained by the top trainers in the country are handicapped purely on their racecourse performances or placed higher in the handicap simply due to the trainers’ above average strike rates. This type of query can be tested easily using races over several seasons.
Due to the uniformity of handicaps, it is a simple task to work out how many wins each stable should have relative to the number of horses run and the size of the fields in which they compete. It is then possible to compare the expected number of winners against the actual number of successes. If the trainers’ hypothesis is correct the top trainers will have fewer actual winners than expected.
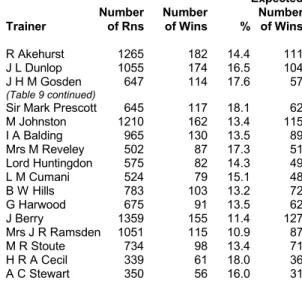
The following table summarises the actual and expected number of winners for sixteen trainers based on races run over several seasons:
Table 9: Expected Compared to Actual Number of Non-Juvenile Handicap Winners by Trainer
Expected
Number Number Number
Trainer of Rns of Wins % of Wins
R Akehurst 1265 182 14.4 111
J L Dunlop 1055 174 16.5 104
J H M Gosden 647 114 17.6 57
(Table 9 continued)
Sir Mark Prescott 645 117 18.1 62
M Johnston 1210 162 13.4 115 I A Balding 965 130 13.5 89 Mrs M Reveley 502 87 17.3 51 Lord Huntingdon 575 82 14.3 49 L M Cumani 524 79 15.1 48 B W Hills 783 103 13.2 72 G Harwood 675 91 13.5 62 J Berry 1359 155 11.4 127 Mrs J R Ramsden 1051 115 10.9 87 M R Stoute 734 98 13.4 71 H R A Cecil 339 61 18.0 36 A C Stewart 350 56 16.0 31
The trainers listed above each have had more winners than expected, with Reg Akehurst exceeding the number of expected winners by 71, 64%. This seems to imply that, in general, none of the trainers listed in the table have any reason to complain, although it is possible that individual horses are badly handicapped from time to time. It could be argued that these trainers only run their better handicapped horses in handicap races, keeping their poorly handicapped animals to non-handicap events. Personally, though, I would prefer to back a handicapper trained by someone whose actual number of winners exceeds the number expected whether they believe the handicapper treats them fairly or not.
Interestingly, of trainers listed in Table 9, only three show an overall profit from betting on all of their handicap runners, namely, R Akehurst, J Gosden and G Harwood. The following list includes all trainers who have a recorded at least 20% more winners than expected, during the period of analysis, and have had 10 or more handicap winners in total:
R Akehurst P W Harris D Morley
D W P Arbuthnot G Harwood D J G Murray-Smith R W Armstrong P C Haslam R J O’Sullivan I A Balding Major W R Hern J Pearce R Bastiman Lady Herries M C Pipe
J Berry A Hide Sir Mark Prescott
M J Camacho C J Hill Mrs J R Ramsden
H R A Cecil B W Hills Mrs M Reveley
R Charlton G A Huffer M J Ryan
P F I Cole Lord Huntingdon R V Smyth
L M Cumani R Ingram A C Stewart
P D Cundell M A Jarvis M R Stoute
C A Cyzer W Jarvis J Sutcliffe
J L Dunlop M Johnston H Thompson-Jones
F Durr Bob Jones P T Walwyn
D R C Elsworth S E Kettlewell J W Watts
P S Felgate G Lewis D A Wilson
J H M Gosden D R Loder G Wragg
B Hanbury P J Makin
Clues From Previous Races
Due to the uniformity of handicaps, we may be able to derive some useful clues as to the likely chance of success of a horse from previous races. In theory, if a horse had a good chance of winning one handicap, providing the conditions have not changed radically, i.e. different race distance, a change to the going or a marked increase in the animal’s handicap mark, it should have a relatively similar chance in another handicap. At first sight this assumption looks rather dubious, however it can be supported with the following evidence.
We have seen that it is possible to estimate the probability that a horse will win based on its starting price. If we assume the above theory to be correct, then the chance of a horse winning a handicap could be determined by the chance it had of winning its latest handicap. Table 10, based on almost 70,000 race performances, illustrates this idea :
Table 10: Average Return and Strike Rate by Price in Previous Handicap Race
Starting Price
in previous Average
Handicap Winners (%) Runners Return/£1
Odds On 50 (22.2) 489 -0.08
Evens-5/1 1957 (14.2) 13761 -0.15
11/2-20/1 3983 (9.0) 44026 -0.22
22/1+ 438 (4.4) 9917 -0.45
All 6428 (9.5) 67929 -0.24
Therefore, of the 489 runners who started at odds on for their latest race (a handicap), 50 won their next handicap, a strike rate of 22.2%, which is more than double the strike rate for all runners.
Interestingly, horses which ran most recently in a pattern race return a loss of 38p per £1 staked if running next in a handicap. If their previous race was a non-handicap outside the pattern classification the loss increases to 39p per £1 staked. These poor returns compare to a loss of only 24p per £1 staked if the horse ran in a handicap most recently.
The poor returns associated with horses running in non-handicap events prior to a non-handicap is due to a combination of under pricing and cautious handicapping. Horses stepping down in class from pattern races to handicaps are often poorly priced simply due to this change in race status. However, it is often overlooked that the reason for the drop in class is that they do not have the necessary ability to compete at the higher levels.
Frequently, horses run in claiming or selling races after a number of fruitless runs in handicaps. Unfortunately, if they run well, or even win, one of these races they will be re-handicapped and possibly raised in the weights. Therefore, their chance of winning, when returning to handicaps, is poorer than it was before they ventured into non-handicap company, and, to make matters worse, their starting price will often be lower in relative terms simply because they have good, or winning, recent form. Clearly, these are horses to avoid.
Even without imposing restrictions on the race distance etc. it can be seen from the Table 10 that, for handicap races, the chance of success can be estimated from the starting price of the horse in its most recent handicap. Both the average return and winners to runners strike rate decline as the price increases. This clearly demonstrates the uniform nature of this race type and the poor value offered about higher priced horses, which we covered earlier.
Although Table 10 provides useful information, it is not going to make us rich. In fact, all the figures in the average return column are negative meaning we will actually lose in the long run. The least-worst category, though, is the odds on group. So can we turn the 8p loss per £1 staked into a profit?
Another variable we need to consider when using the starting price in a previous race as a guide, is the number of runners raced against. Breaking down the odds on category by runners gives the following:
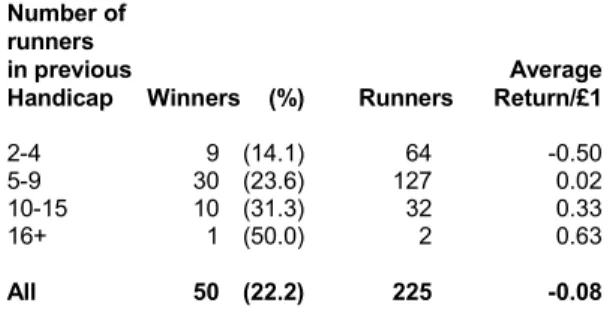
Table 11: Average Return and Strike Rate by Number of Runners in Previous Race for Horses which Started
Odds On for their Latest Run in a Handicap Number of
runners
in previous Average
Handicap Winners (%) Runners Return/£1
2-4 9 (14.1) 64 -0.50
5-9 30 (23.6) 127 0.02
10-15 10 (31.3) 32 0.33
16+ 1 (50.0) 2 0.63
All 50 (22.2) 225 -0.08
As the number of runners in the previous race increases, so does the strike rate and average return in the next race. The reason for this is that a horse starting at odds on in a 2-4 runner handicap is nothing out of the ordinary, but one starting at odds on in a larger field, say 14 runners, is clearly thought to be a good thing by the betting public. The animal is probably ideally suited by the race conditions, is very well handicapped (i.e. on a low handicapped mark) and is possibly improving. This is just the type of horse we want to have a bet on; but not in this race. All the factors which make it a good thing have been accounted for by the price, after all it is odds on and therefore, does not offer anything in the way of value. It is on its next run when we can start to think about a bet. The price of the odds on shot will, in all probability, be higher next time it runs. This could be due to a number of factors. Firstly, if the horse won when odds on, it will have been pushed up the weights by the handicapper (or carrying a penalty), and thus appear less attractive. Secondly, if it was well beaten, the lack of good recent form will lead to an increase in the starting price. Thirdly, the reason it started odds on may have been due to the perceived lack of quality opposition, which may not be the case on its next run. However, the fact that it was considered to be a good thing for its last handicap remains, and this, combined with our belief of a high
degree of uniformity amongst handicap races, makes this horse a value option on its next run. Table 11 above supports this theory. Unfortunately, there are only a few bets of this type each year.
It is possible, though, to extend the coverage of the odds on approach simply by considering the two most recent races as opposed to just the latest race. By backing any handicapper, which, in either of its last two handicap races, started at odds on in fields of 10 runners or more would produce the following results: 28 winners from 91 bets, a strike rate of 31% with a profit of 0.37. Therefore,
consider backing any handicap runner which, in either of its last two handicap races started at odds on in a field of 10 runners or more: expected profit 37p per £1 staked.
How about horses which did not start at odds on in their latest handicap, can we make a profit from these? Firstly, we need to divide these horses into two groups: those which won their last race and those which were beaten. Secondly, we need to examine the way in which they run. The best data available regarding the style of running are the comments-in-running. Such comments are printed in the results section of Raceform, the Official Formbook and Racing Post. It may also be possible to discern this required information from other publications, such as Timeform and the Sporting Life. The comments give the reader an invaluable insight into the running of the race, including where the horse was positioned at different stages, whether it was hampered at a crucial point and how well it finished.
Considering the winners group first, it would seem logical to select horses to follow which won their latest race very easily. The race comments to look for would include: easily, comfortable, canter and unchallenged. However, by doing this we are adopting a more conventional approach