Physiological models comparison for the analysis of ASL
FMRI data
Aina Frau-Pascual, Florence Forbes, Philippe Ciuciu
To cite this version:
Aina Frau-Pascual, Florence Forbes, Philippe Ciuciu. Physiological models comparison for the
analysis of ASL FMRI data. 12th IEEE International Symposium on Biomedical Imaging,
ISBI 2015, Apr 2015, New York, United States. IEEE, pp.1348-1351, 2015, 12th IEEE
Interna-tional Symposium on Biomedical Imaging, ISBI 2015, Brooklyn, NY, USA, April 16-19, 2015.
<
10.1109/ISBI.2015.7164125
>
.
<
hal-01249014
>
HAL Id: hal-01249014
https://hal.archives-ouvertes.fr/hal-01249014
Submitted on 7 Jan 2016
HAL
is a multi-disciplinary open access
archive for the deposit and dissemination of
sci-entific research documents, whether they are
pub-lished or not.
The documents may come from
teaching and research institutions in France or
abroad, or from public or private research centers.
L’archive ouverte pluridisciplinaire
HAL
, est
destin´
ee au d´
epˆ
ot et `
a la diffusion de documents
scientifiques de niveau recherche, publi´
es ou non,
´
emanant des ´
etablissements d’enseignement et de
recherche fran¸
cais ou ´
etrangers, des laboratoires
publics ou priv´
es.
PHYSIOLOGICAL MODELS COMPARISON FOR THE ANALYSIS OF ASL FMRI DATA
Aina Frau-Pascual
p1,2qFlorence Forbes
p1qPhilippe Ciuciu
p2,3qp1q
INRIA, MISTIS, Grenoble University, LJK, Grenoble, France
p2qINRIA, Parietal, F-91893 Orsay, France
p3q
CEA/DSV/I
2BM NeuroSpin center, Bˆat. 145, F-91191 Gif-sur-Yvette, France
ABSTRACT
Physiological models have been proposed to describe the processes that underlie the link between neural and hemodynamic activity in the brain. Among these, the Balloon model describes the changes in blood flow, blood volume and oxygen concentration when an hemodynamic response is ensuing neural activation. Next, an hemo-dynamic model links these variables to the blood-oxygen-level-dependent (BOLD) effect. Taken together, these equations allow the precise modeling of the coupling between the cerebral blood flow and hemodynamic response. However, several competing versions of the hemodynamic model and different physiological parameters values have been described in the literature. In this work, we analy-se Arterial Spin Labelling (ASL) functional Magnetic Resonance Imaging (fMRI) data, which contains both perfusion and hemody-namic effects, to compare the impact of different settings in the cou-pling between blood flow and hemodynamic response.
Index Terms— fMRI, ASL, Balloon model, CBF, JDE
1. INTRODUCTION
In the past decade, physiological models have been described to ex-plain the physiological changes caused by neural activity. In [1–3] different models have been introduced: neural coupling, which maps neural activity to ensuing cerebral blood flow (CBF); theBalloon model, which relates CBF to volume and deoxyhemoglobin changes, and hemodynamic model, also referred to as BM in [4], that relates these parameters to the blood-oxygen-level-dependent (BOLD) ef-fect. These models thus provide a complete description of the phy-siological process underlying hemodynamic activity, from neural ac-tivation to the hemodynamics or BOLD effect measurement. How-ever, different parameter settings have been proposed in the Balloon model formulation and several BM have been presented in [4]. Such variability provides flexibility to model physiological responses but also introduces more complexity.
The Arterial Spin Labelling (ASL) signal embodies two com-ponents: an hemodynamic or BOLD component and a perfusion one. The ASL signal comes from a T2* image acquisition with suc-cessive alternatecontrol/tagsettings, with inversed magnetization in thetagimage. An hemodynamic or BOLD effect can be found in bothcontrol/tagimages, while a perfusion effect can be captured from thecontrol-tagdifference. Their typical shapes are respectively described by the hemodynamic response function, here referred as BRF for BOLD response function, and the perfusion response func-tion (PRF). These two response funcfunc-tions can be estimated using the probabilistic joint detection-estimation (JDE) formalism [5, 6], al-though the PRF estimation remains difficult because of the noisier nature of the perfusion component within the ASL signal. For this
reason, in [7] we used a physiological link between PRF and BRF shapes as a prior knowledge in the JDE framework [5, 6]. However, the physiological parameters we chose and the BM model we used in [7] were not completely in accordance with the analysis performed in [4], where the performance of the different models was compared. Hence, in this paper we want to replicate the analysis of [4] but for ASL data and to identify which model outperforms the other for in-forming the link between perfusion and hemodynamics (PRF/BRF link) in the JDE analysis of ASL data. Results on real data could give us a hint on the best set of parameters to use in the Balloon and hemodynamic (BM) models.
The rest of the paper is organized as follows: the models con-sidered in the computation of the perfusion/hemodynamics link are presented and analysed in Section 2; the physiologically informed ASL JDE model is introduced in Section 3; and some results are presented and discussed in Sections 4-5.
2. A PHYSIOLOGICAL LINK BETWEEN PERFUSION AND HEMODYNAMICS
An approximate relationship between the perfusion and hemody-namic response functions can be derived from physiological mod-els. In this section, we recall the work presented in [7], in which the extended Balloon model and the BM model were used to describe a link between perfusion and hemodynamic response functions. Fol-lowing the same reasoning as in [4], we further analyse the different models to recover a more accurate perfusion/hemodynamics link, with the correct set of parameters.
2.1. The extended Balloon model
The Balloon model was first proposed in [1] to link neuronal and vascular processes by considering the capillary as a balloon that in-flates under the effect of blood flow variations. More specifically, the model describes how, after some stimulation, the local blood flow
finptqincreases and leads to the subsequent augmentation of the
local capillary volumeνptq. This incoming blood is strongly oxy-genated but only part of the oxygen is consumed. It follows a local decrease of the deoxyhemoglobin concentrationξptqand therefore a BOLD effect variation. The Balloon model was then extended in [2] to include the effect of the neuronal activityuptqon the variation of some auto-regulated flow inducing signalψptqso as to eventually link neuronal to hemodynamic activity. The global physiological model corresponds then to anonlinearsystem with four state vari-ablestψ,fin,ν,ξucorresponding to normalized flow inducing
sig-nal, local blood flow, local capillary volume, and deoxyhemoglobin concentration. Their interactions over time are described by the fol-lowing system of nonlinear differential equations:
$ ’ ’ ’ ’ & ’ ’ ’ ’ % dfinptq dt “ ψptq dψptq dt “ ηuptq ´ ψptq τψ ´ finptq´1 τf dξptq dt “ 1 τm ´ finptq1´p1´E0q 1{finptq E0 ´ξptqνptq 1 ˜ w´1 ¯ dνptq dt “ 1 τm ´ finptq ´νptq 1 ˜ w ¯
with initial conditionsψp0q “ 0,finp0q “ νp0q “ ξp0q “ 1.
Lower case notation is used for normalized functions by conven-tion. The system depends on 5 hemodynamic parameters: τψ,τf
andτmare time constants respectively for signal decay/elimination,
auto-regulatory feedback from blood flow and mean transit time,w˜
reflects the ability of the vein to eject blood, andE0 is the oxygen extraction fraction. Another parameterη is the neuronal efficacy weighting term that models neuronal efficacy variability.
2.2. The hemodynamic model
Buxton et al [3] proposed the following expression to link the hemo-dynamic response (BRF)1hptqto physiological quantities consider-ing the intra-vascular and extra-vascular components:
hptq “V0rk1p1´ξptqq `k2 ˆ 1´ξptq νptq ˙ `k3p1´νptqqs (1) wherek1,k2andk3are scanner-dependent constants andV0is the resting blood volume fraction. This equation can be linearized into:
hptq “V0rpk1`k2qp1´ξptqq ` pk3´k2qp1´νptqqs. (2) As synthesized in [4], where the hemodynamic model is referred to as BM, different expressions were proposed fork1,k2andk3: the classical ones (classical BM) in [3], and their revised (revised BM) version in [8]. Hereafter, we will use the same notation as Stephan et al [4]: CBM and RBM stand for models using theclassicaland
revisedexpressions, respectively, and subscripts ”L” and ”N” for the nonlinear (Eq. (1)) and linear (Eq. (2)) expressions:
CBM RBM
k1“ p1´V0q4.3ϑ0E0T E k1“4.3ϑ0E0T E (3)
k2“2E0 k2“r0E0T E (4)
k3“1´ k3“1´ (5) whereϑ0is the frequency offset at the outer surface of the magne-tized vessel for fully deoxygenated blood,r0the slope of the relation between intra-vascular relaxation rate and oxygen saturation, and
the ratio of intra- and extravascular signal.
In the end, we have different combinations: classical linear BM (CBML), revised linear BM (RBML), classical nonlinear
BM (CBMN) and revised nonlinear BM (RBMN). Different
val-ues have been proposed in [2, 9] (see Tab. 1) for the physiological and BM parameters, and we consider some of them in this paper. According to [10], we also considered at 3T:r0 “ 100s´1 and
ϑ0 “80.6s´1. Forparameter, the values given by [4] have been used:0.4,1and1.43.
2.3. Physiological linear relationship between response func-tions
Akin to [7], starting from the system of differential equations, we derive an approximate relationship between the PRF, namelygptq
and the BRF, namelyhptq. Both PRF and BRF are percent signal
1To clarify, the hemodynamic response corresponds to the impulse re-sponse, namely the BRF, only when a single stimulus or neural event is con-sidered as input.
Table 1. Physiological and BM parameters used in [2, 9].
η τψ τf τm w˜ E0 V0
[2] 0.5 1.25 2.5 1 0.2 0.8 0.02
[9] 0.54 1.54 2.46 0.98 0.33 0.34 1
changes. We considergptq “finptq´1, asfinptqis the normalized
perfusion, with initial value1. Therefore the state variables become
tψ,g,1´ν,1´ξu. In what follows, we will drop the time index
tand consider functionsh,ψ, etc.in their discretized vector form. By linearizing the system of differential equations around the resting pointtψ,g,1´ν,1´ξu “ t0,0,0,0uas in [9], we get:
$ ’ ’ ’ & ’ ’ ’ % Dg“ ´ψ ´ D`wτ˜I m ¯ p1´νq “ ´τ1 mg ´ D`τI m ¯ p1´ξq “ ´ ˆ γI´1wτ˜´w2˜ m ´ D`wτ˜I m ¯´1˙ g ,
whereDandIare the first order differential operator and the iden-tity matrix respectively, andγ“ τ1m
´
1`p1´E0qlnp1´E0q E0
¯ . By considering this system of equations and the BM equa-tions (linear (2)/nonlinear (1) forms), we can derive a linear rela-tionship betweenhandgthat readsg“Ωhwhere:
Ω“V0´1ppk1`k2qB` pk3´k2qAq´1 (6) when Eq. (2) holds and
Ω“V0´1 ` k1B`k2pB´AqpI´Aq´1`k3A ˘´1 (7) with $ ’ & ’ % A “ ´τ1 m ´ D`wτ˜I m ¯´1 B “ ´ ´ D`τI m ¯´1ˆ γI´wτ1˜´w2˜ m ´ D`wτ˜I m ¯´1˙ .
when Eq. (1) holds instead. Hence, we have differentΩmatrices de-pending on the Balloon model parameters (see Tab. 1), the classical or revised expression fork1,k2 andk3 (see Eqs. (3)-(5)), directly impacted byparameter, and the model (Eqs. (6)-(7)). Changing
Ωmight therefore affect the PRF and BRF estimation results from ASL data and identifying the best combination of these ingredients is the issue we want to address in the present paper.
2.4. Perfusion/hemodynamics link analysis on simulated data
As we have seen, matrixΩwill vary depending on which model we consider: CBML, RBML, CBMNand RBMNwith different
possi-ble values for, and on which set of parameters we use: [2] or [9]. Here, we simulate a PRF by applyinggm“Ωmhcanto the
canoni-cal BRF shape (hcan) using differentΩm(mcoding the model that
we use) to find out which factors have a stronger impact onΩ. As there is no canonical PRF, we use the canonical BRF as a reference. Fig. 1(a) illustrates the cases for which we observed the strongest variability in the simulated PRF shape when applyinggm “Ωmh
whenΩmis defined either by (6) or (7) using the parameters
pro-posed in [9]. Besides, we also found variability between the gener-ated PRFs associgener-ated with differentvalues. Fig. 1(b) shows this fact for theCBMLmodel.
To draw significant conclusions about the statistical significance of the measured differences between PRF and canonical BRF, for eachvalue we performed a 2 way-ANOVA including the model type (CBML, RBML, CBMN andRBMN) and the setting of
(a) (b) Percent signal change Percent signal change Time (s.) Time (s.)
Fig. 1. PRFs resulting fromΩmhcan when using modelm, for
parameters in [9] (a), and for theCBMLmodel (b).
parameters (see Tab. 1) as the two factors of interest. We entered the squared differences between the canonical BRF and the different PRFs as observations in our analysis. For“0.4only, we identified a very significant difference between the sets of parameters, but none between classical and revised or linear and nonlinear BM models at a 0.01 level of significance (F-test: F “ 38.98, p-val ă 10´4
). This result is also confirmed by the discrepancy depicted in Fig. 1(b) between the blue curve and the other traces. To sum up, the setting of physiological parameters andcan impact the quality of the link between perfusion and hemodynamic response functions, whereas choosing a particular BM model has a limited influence. In what follows, we address the same concern on real ASL data acquired along an fMRI experiment.
3. BAYESIAN HIERARCHICAL MODEL FOR ASL DATA ANALYSIS
3.1. ASL signal modeling
The ASL JDE model described in [5, 6] considers functional homo-geneous parcels with constant response shapes. In a given parcel
P, the generative model for ASL time series, withMexperimental conditions, reads@jPP,|P| “J: yj“ M ÿ m“1 amj X m h looomooon paq `cmjW X m g looooomooooon pbq ` αjw loomoon pcq ` P `j loomoon pdq ` bj loomoon peq (8)
The measured signalyjis decomposed into the components:
(a) Task-related hemodynamic component, where h is the un-known BRF shape andtam
j, jPP, m“1 :Muare the magnitude
of activation or hemodynamic response levels (BRLs).
(b) Task-related perfusion component, that represents the varia-tion of the perfusion around baseline when there is task-related ac-tivity. gis the PRF shape andtcm
j, j P P, m “1 : Muare the
magnitude of activation or perfusion response levels (PRLs).
(a-b) Task-related components.Xencodes the lagged onset stim-uli. The BRLs and PRLs (resp.,amj andcmj ) are assumed to follow
2M different spatial Gaussian mixture models but these Gaussian variables are governed byM common binary hidden Markov ran-dom fieldstqm
j , j P P, m “ 1 :Muencoding voxels’ activation
states for each experimental conditionmand promoting spatial cor-relation as in [5, 6].
(c) Perfusion baselinecompletes the modelling of the perfusion component and it is encoded by the scalarαj.
(b-c) The control/tag vectorw “ r1{2,´1{2,1{2, ...sand ma-trixW “ diagpwqencode the difference in magnetization signs between the consecutive and alternated control (positive magnetiza-tion) and tagged (negative magnetizamagnetiza-tion) ASL volumes.
(a) Auditory cortex results
Percent signal change Percent signal change Time (s.) Time (s.)
(b) Visual cortex results
Percent signal change Percent signal change Time (s.) Time (s.)
Fig. 2. PRF (left) and BRF (right) estimates for modelRBMNwith
parameters in [2] and [9], considering differentvalues, estimated in auditory(a)and visual(b)cortices.
(d-e) Drift and noise termsallow to account for a potential drift and any other nuisance effect. Noise is assumed to be white Gaussian, which is a tenable assumption in ASL compared to BOLD fMRI.
3.2. A physiologically informed inference procedure
In Eq. (8), the hemodynamic component can be estimated from the ASL data with an increased confidence compared to the perfusion component, as it is known to have a higher contrast-to-noise ra-tio (CNR). The relara-tionshipg“Ωh, which was already derived be-tween both components in [7], was then used to a priori constrain the PRF from the BRF in a stochastic manner. Since the hemodynamic component is associated with a better CNR, it makes more sense to recover first the BRFhand to improve estimation of the PRF
gthrough the following conditional distribution in the JDE formu-lation: ppg|hq “ NpΩh, vgΣgq, whereΣg “ p∆tq4pD2tD2q´1 andD2 is the truncated second-order finite difference matrix that enforces temporal smoothness as a function of the prior variance
vg: see [5, 6] for details. As regards the BRFh, as in previous
works [11, 12], its prior distribution follows a centered multivariate Gaussian distribution: Np0, vhΣhqwhereΣh “Σg andvh is a
free variance parameter.
By using this physiological prior, we are enforcing the relation-ship between the two response functions, and this allows a better perfusion component estimation. Next, as in [7], this relationship is used in a fully Bayesian JDE approach for ASL data where each fully conditional posterior distribution is sampled at a time in order to compute minimum mean square error (or posterior mean) estima-tors as regards the PRF and BRF shapes as well as the PRLs and BRLs and maximum a posteriori (MAP) estimators for detecting which voxels elicit evoked activity. The interested reader is invited to refer to [7] for details on the hybrid Gibbs-Metropolis algorithm.
4. REAL DATA RESULTS
Here, we performed ASL JDE analysis on ASL fMRI data, consid-ering the different models and parameter settings forΩexplored in Section 2. The analysis was performed on 8 individuals, although the results are shown for 1 subject only. The same conclusions hold for the other subjects.
Fig. 3. Auditory cortex PRLs for modelRBMNwith parameters:
[2] (top), [9] (bottom), considering(left to right)0.4,1and1.43.
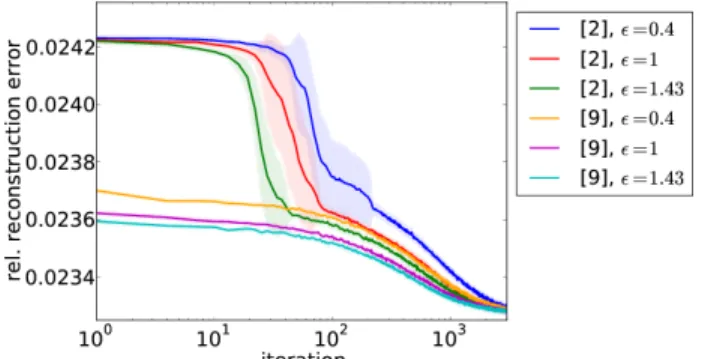
Fig. 4. Convergence of the averaged relative reconstruction error over 10 runs for the auditory cortex and modelRBMN. Standard
deviations are shown with shaded colors.
The ASL data were recorded during an experiment specifically designed to map auditory and visual primary cortices, with 291
scans, repetition timeT R “ 3s, echo timeT E “ 18ms, FoV
192mm, dimensions64ˆ64ˆ22voxels (resolution of3ˆ3ˆ3.5
mm3). The tagging scheme used was PICORE Q2T, withT I1 “
700ms, T I2 “ 1700ms. A fast event-related paradigm (mean
ISI “ 5.1s) was used, comprising sixty auditory and visual stim-uli. Two regions of interest in the right temporal and left occipital lobes were defined manually as parcels of interest for looking at the evoked response in the the auditory and visual cortices, respectively. Fig. 2 shows the perfusion and hemodynamic response functions estimated using differentΩmatrices forppg|hqin the ASL JDE inference, considering 3000 MCMC iterations. Here, the two pa-rameter sets [2, 9] were tested andΩwas computed using the above mentioned models andvalues. Fig. 2 also depicts the canonical BRF (dashed line), which is in accordance with the BRF estimates for both methods. We observed very similar shapes, as well as sim-ilar perfusion response levels in Fig. 3 for the auditory cortex using
RBMN. A variability in PRF could impact the PRLs retrieved.
Fig. 4 shows the convergence of the relative reconstruction er-ror (the lower the better) over MCMC iterations for the different pa-rameter settings. BM models are not all shown as they have similar convergence speed. Interestingly, we observed a stronger variabil-ity between the two parameter sets as compared to changing the
value. Important results are the lower relative reconstruction error of the parameters proposed in [9] from the first iteration, and the better performance in both sets of parameters ( [9] and [2]) for“1.43. For this reason, we can consider the combination [ “ 1.43and parameters as in [9]] as the one performing the best and offering promising perspectives. However, after 3000 iterations, the algo-rithm converges to good parameter estimates in all cases.
5. DISCUSSION AND CONCLUSION
A physiological link has been described, combining the Balloon and BM models, to achieve a better estimation of parameters in an ASL JDE framework. Different versions of the BM model have been de-scribed in the literature, and different parameter settings for the Bal-loon model have also been proposed. In this paper, we considered them altogether to assess their impact in the context of ASL data analysis. On simulated data, the selection of physiological parame-ters used in the Balloon model as well as the setting of, were more critical than that of the BM model itself. On real ASL data, we con-firmed this finding with a faster convergence in the joint estimation of perfusion and hemodynamic components of the signal, at least in the auditory and visual regions. Future work will be dedicated to confirm or infirm these results on other brain regions (eg, motor) and other data sets.
Acknowledgements
We would like to thank Salma Bougacha for insightful comments and interesting discussions.
6. REFERENCES
[1] R. B. Buxton, E. C. Wong, and L. R. Frank, “Dynamics of blood flow and oxygenation changes during brain activation: the balloon model,”
Magnetic Resonance in Medicine, vol. 39, pp. 855–864, 1998. [2] K. J. Friston, A. Mechelli, R. Turner, and C. J. Price, “Nonlinear
re-sponses in fMRI: the balloon model, Volterra kernels, and other hemo-dynamics,”Neuroimage, vol. 12, pp. 466–477, 2000.
[3] R. B. Buxton, K. Uluda˘g, D. J. Dubowitz, and T. T. Liu, “Modeling the hemodynamic response to brain activation,” Neuroimage, vol. 23, pp. S220–S233, 2004.
[4] K. E. Stephan, N. Weiskopf, P. M. Drysdale, P. A. Robinson, and K. J. Friston, “Comparing hemodynamic models with DCM,”Neuroimage, vol. 38, no. 3, pp. 387–401, 2007.
[5] T. Vincent, F. Forbes, and P. Ciuciu, “Bayesian BOLD and perfusion source separation and deconvolution from functional ASL imaging,” in
38th Proc. IEEE ICASSP, Vancouver, Canada, 2013, pp. 1003–1007. [6] T. Vincent, J. Warnking, M. Villien, A. Krainik, P. Ciuciu, and
F. Forbes, “Bayesian joint detection-estimation of cerebral vasoreac-tivity from ASL fMRI data,” in16th Proc. MICCAI, LNCS Springer Verlag, Nagoya, Japan, 2013, vol. 2, pp. 616–623.
[7] A. Frau-Pascual, T. Vincent, J. Sloboda, P. Ciuciu, and F. Forbes, “Physiologically informed Bayesian analysis of ASL fMRI data,” in
Bayesian and grAphical Models for Biomedical Imaging, M.J. Car-doso, I. Simpson, T. Arbel, D. Precup, and A. Ribbens, Eds., vol. 8677 ofLNCS, pp. 37–48. Springer, 2014.
[8] T. Obata, T. T. Liu, K. L. Miller, W.-M. Luh, E. C. Wong, L. R. Frank, and R. B. Buxton, “Discrepancies between BOLD and flow dynamics in primary and supplementary motor areas: application of the balloon model to the interpretation of BOLD transients,”Neuroimage, vol. 21, no. 1, pp. 144–153, 2004.
[9] I. Khalidov, J. Fadili, F. Lazeyras, D. Van De Ville, and M. Unser, “Activelets: Wavelets for sparse representation of hemodynamic re-sponses,”Signal Processing, vol. 91, no. 12, pp. 2810–2821, 2011. [10] Y. Behzadi and T.T. Liu, “An arteriolar compliance model of the
cere-bral blood flow response to neural stimulus,”Neuroimage, vol. 25, no. 4, pp. 1100–1111, 2005.
[11] P. Ciuciu, J.-B. Poline, G. Marrelec, J. Idier, Ch. Pallier, and H. Benali, “Unsupervised robust non-parametric estimation of the hemodynamic response function for any fMRI experiment,” IEEE Trans. on Medical Imaging, vol. 22, no. 10, pp. 1235–1251, 2003.
[12] T. Vincent, L. Risser, and P. Ciuciu, “Spatially adaptive mixture mod-eling for analysis of within-subject fMRI time series,”IEEE Trans. on Medical Imaging, vol. 29, no. 4, pp. 1059–1074, 2010.
![Table 1. Physiological and BM parameters used in [2, 9].](https://thumb-us.123doks.com/thumbv2/123dok_us/9037985.2801593/3.918.90.434.107.195/table-physiological-and-bm-parameters-used-in.webp)
![Fig. 1. PRFs resulting from Ω m h can when using model m, for parameters in [9] (a), and for the CBM L model (b).](https://thumb-us.123doks.com/thumbv2/123dok_us/9037985.2801593/4.918.483.828.104.379/fig-prfs-resulting-ω-using-model-parameters-model.webp)