CHAPTER 3. RESULTS AND DISCUSSION 3.1. Potentiometric studies
Stability of complexes
In the study of metal complexes, the extent to which the ligands bind to the metal ion is generally expressed in terms of stability constant. This helps in predicting the equilibrium concentration of the metal complex in solution. Two aspects of stability, that is, thermodynamic stability and kinetic stability are mainly considered in the studies of metal complexes in solution. The thermodynamic stability is a measure of the extent to which the complex will form or will be transformed into another species when the systems have reached equilibrium. The kinetic stability refers to the speed with which the transformation leading to the attainment of equilibrium takes place. The stability constant is generally regarded as the equilibrium constant of the reaction at a given temperature. If only mononuclear complexes of the type MLn are formed in a solution containing metal (M) and monodentate ligand (L) the formation of the complex, MLn, can be expressed by the equation
M + nL = MLn
Then, according to law of mass action, the equilibrium constant Kn is given by Kn = [MLn] / [M] [L]n
The formation of MLn may be supposed to take place by the stepwise addition of the ligand molecules to the metal ion which can be expressed as
M + L ↔ ML1, K1 = [ML1] / [M] [L] ML1 + L ↔ ML2, K2 = [ML2] / [ML] [L]
ML2 + L ↔ ML3, K3 = [ML3] / [ML2] [L] .
.
MLn-1 + L ↔ MLn, Kn = [MLn] / [MLn-1] [L]
where K1, K2, K3,… Kn characterize the stability of the complexes at the successive steps and are usually called stepwise formation or stability constants. The product of the individual stability constants also gives characteristic constants called overall or cumulative formation or stability constants usually denoted by 'β'. i.e., β1 = K1 =[ML1] / [M] [L] β2 = K1·K2 = [ML2] / [M] [L]2 β3 = K1·K2· K3 = [ML3] / [M] [L]3 . . βn = K1·K2· K3·….. Kn = [MLn] / [M] [L]n In general, βn = n=nΠn=1Kn
Potentiometric titration method
The potentiometric measurement for the determination of stability constant of a complex in solution is based on the fact that the redox potential of the couple M+(m-n)/M+m is shifted significantly on complexation of the metal ion with the ligand. This method involves change in hydrogen ion concentration [H+] due to the displacement or association of one or more protons taking place during complexation reaction. This change can be found out by titrating the solutions containing free acid, acid with ligand, and acid with ligand and metal ion,
individually against a standard alkali solution at a constant ionic strength or temperature. Either ionic strength or temperature may be varied for different sets of solutions. In all the cases, the change in the pH of the solution is measured after each addition of a known amount of alkali to the reaction cell which contains the reaction mixture. The titration curves are then drawn by plotting the measured pH values against the corresponding volume of alkali added and the stability constants of the complexes are determined from the titration curves by employing pH-metric titration technique given by Irving and Rossotti [1].
3.1.1. Potentiometric studies of Cu(II), Ni(II) and Cd(II) complexes of 4
-Dimethylaminobenzilidene(N-benzoyl)glycyl hydrazone (dabBzGH) in
aqueous - dioxane and micellar media
The reaction mixtures for the pH-metric titration of Cu(II), Ni(II) and Cd(II) complexes of 4-Dimethylaminobenzilidene(N-benzoyl)glycyl hydrazone (dabBzGH) have the following compositions:
Solution (i) : 1.00 mL HNO3 (0.004 M) + 5 mL KNO3 (0.1 M) Solution (ii) : Solution (i) + 1.25 mL dabBzGH (0.0005M), and Solution (iii) : Solution (ii) + 0.625 mL of MCl2. nH2O (0.00025 M)
[M=Cu, Ni and Cd]
Volume of all these reaction mixtures was made up to 25 mL using 40 % (v/v) aqueous - dioxane while for the titration in micellar media, 1.20 mL (5 mmol) of TX-100, 2.25 mL (5 mmol) of SDBS and 2.0 mL of CTAB (5 mmol) were added separately in each set of the above reaction mixtures before making up the
volume. The reaction mixtures in each set, solution (i), solution (ii) and solution (iii) were titrated individually against standard 0.05 M KOH.
3.1.1.1. Titration curves
pH-metric titration of 4-Dimethylamino benzilidene(N-benzoyl)glycyl hydrazone and its Cu(II), Ni(II) and Cd(II) complexes against standard KOH was carried out at a constant ionic strength 0.1 mol·dm-3 KNO3 and at different temperatures (290.15, 300.15 and 310.15) K in aqueous - dioxane and TX-100, SDBS and CTAB micellar media. Titration curves obtained by plotting the pH values against the volume of alkali added to the prepared solution (i), solution (ii) and solution (iii) to attain the same pH value are referred to as acid curve, ligand curve and complex curve, respectively. Figures 3.1.1.1, 3.1.1.2, 3.1.1.3 and 3.1.1.4 exhibit the titration curves of the M(II) - dabBzGH complexes in four different media.
Each figure has the following five curves (a) to (e). Curve (a) : [HNO3]
Curve (b) : [HNO3+ dabBzGH]
Curve (c) : [HNO3 + dabBzGH + Ni2+ion] Curve (d) : [HNO3 + dabBzGH + Cd2+ ion] Curve (e) : [HNO3 + dabBzGH + Cu2+ion]
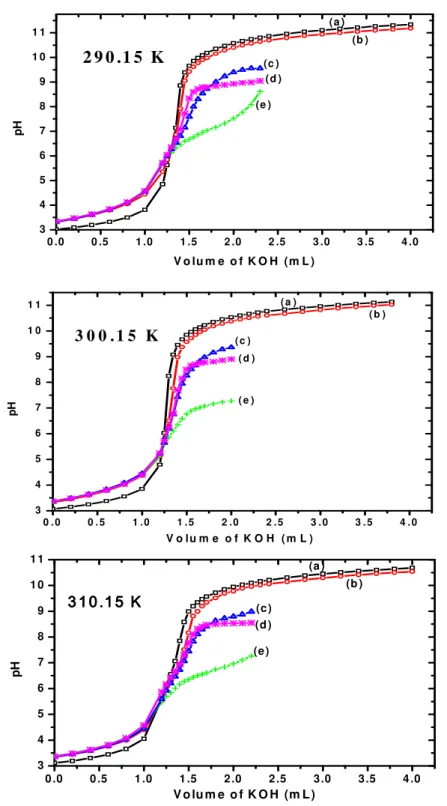
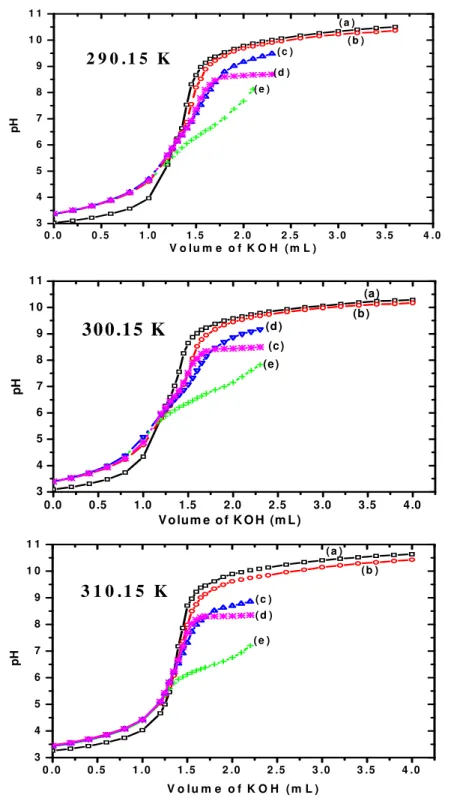
Figure 3.1.1.1. pH-metric titration curves of M(II)-dabBzGH complexes at
different temperatures in aqueous - dioxane medium. (a) □, acid curve; (b) ○, ligand curve; (c) ∆, Ni-complex curve; (d) *, Cd-complex curve and (e) +, Cu- complex curve.
1 .6 1 .8 2 .0 2 .2 2 .4 2 .6 2 .8 3 4 5 6 7 8 9 1 0 1 1 ( e ) (d ) (c ) (b ) 2 9 0 .1 5 K p H V o lu m e o f K O H (m L ) 1 .6 1 .8 2 .0 2 .2 2 .4 3 4 5 6 7 8 9 1 0 1 1 1 2 (e ) (d ) (c ) (b ) (a ) 3 0 0 .1 5 K p H V o lu m e o f K O H ( m L ) 1 . 6 1 . 8 2 . 0 2 . 2 2 . 4 3 4 5 6 7 8 9 1 0 1 1 ( e ) ( d ) ( c ) ( b ) ( a ) 3 1 0 . 1 5 K p H V o l u m e o f K O H ( m L )
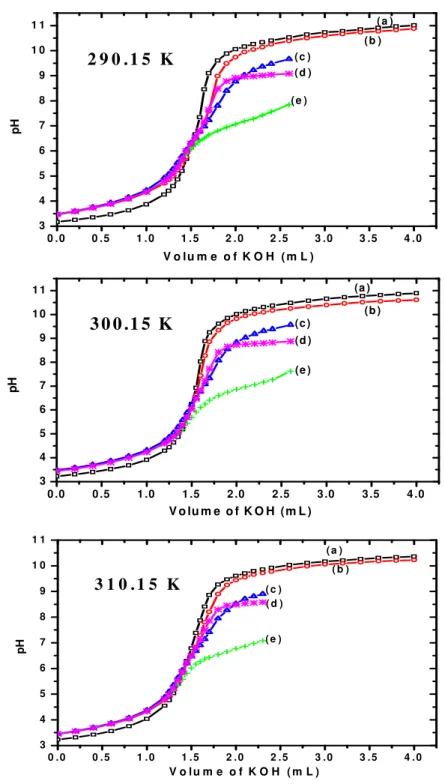
Figure 3.1.1.2. pH-metric titration curves of M(II)-dabBzGH complexes at
different temperatures in aqueous - TX-100 medium. (a) □, acid curve; (b) ○, ligand curve; (c) ∆, Ni-complex curve; (d) *, Cd-complex curve and (e) +, Cu- complex curve.
1 .6 1 .8 2 .0 2 .2 2 .4 2 .6 2 .8 3 4 5 6 7 8 9 1 0 1 1 1 2 ( e ) (d ) (c ) (b ) ( a ) 2 9 0 .1 5 K p H V o lu m e o f K O H ( m L ) 1 . 6 1 . 8 2 . 0 2 . 2 2 . 4 2 . 6 3 4 5 6 7 8 9 1 0 1 1 ( e ) ( d ) ( c ) ( b ) ( a ) 3 0 0 . 1 5 K p H V o l u m e o f K O H ( m L ) 1 .6 1 .8 2 .0 2 .2 2 .4 2 .6 3 4 5 6 7 8 9 1 0 1 1 (e ) (d ) (c ) (b ) (a ) 3 1 0 .1 5 K p H V o lu m e o f K O H ( m L )
Figure 3.1.1.3. pH-metric titration curves of M(II)-dabBzGH complexes at different temperatures in aqueous - SDBS medium. (a) □, acid curve; (b) ○, ligand curve, (c) ∆, Ni-complex curve, (d) *, Cd-complex curve and (e) +, Cu-complex curve. 1 .6 1 .8 2 .0 2 .2 2 .4 2 .6 3 4 5 6 7 8 9 1 0 (e ) (d ) (c ) (b ) 2 9 0 .1 5 K p H V o lu m e o f K O H (m L ) 1 .6 1 .8 2 .0 2 .2 2 .4 2 .6 3 4 5 6 7 8 9 1 0 1 1 (e ) (d ) (c ) (b ) (a ) 3 0 0 .1 5 K p H V o lu m e o f K O H (m L ) 1 .6 1 .8 2 .0 2 .2 2 .4 3 4 5 6 7 8 9 1 0 1 1 ( e ) ( d ) ( c ) ( b ) ( a ) 3 1 0 . 1 5 K p H V o lu m e o f K O H ( m L )
Figure 3.1.1.4. pH-metric titration curves of M(II)-dabBzGH complexes at different temperatures in aqueous CTAB medium. (a) □, acid curve; (b) ○, ligand curve; (c) ∆, Ni-complex curve; (d) *, Cd-complex curve and (e) +, Cu-complex curve. 1 . 4 1 . 6 1 . 8 2 . 0 2 . 2 2 . 4 2 . 6 2 . 8 3 . 0 3 . 2 3 4 5 6 7 8 9 1 0 1 1 ( e ) ( d ) ( c ) ( b ) ( a ) 2 9 0 . 1 5 K p H V o l u m e o f K O H ( m L ) 1 . 4 1 . 6 1 . 8 2 . 0 2 . 2 2 . 4 2 . 6 2 . 8 3 . 0 3 4 5 6 7 8 9 1 0 1 1 ( e ) ( d ) ( c ) ( b ) ( a ) 3 0 0 . 1 5 K p H V o l u m e o f K O H ( m L ) 1 . 4 1 . 6 1 . 8 2 . 0 2 . 2 2 . 4 2 . 6 2 . 8 3 . 0 3 . 2 3 4 5 6 7 8 9 1 0 1 1 ( e ) ( d ) ( c ) ( b ) ( a ) 3 1 0 . 1 5 K p H V o l u m e o f K O H ( m L )
Figure 3.1.1.1 exhibits the titration curves in aqueous - dioxane medium at different temperatures. It is observed from Figure 3.1.1.1 (290.15 K) that the acid titration curve (a) starts from pH 3.25 and extends to pH 11.32 while the ligand curve (b) is observed on the left side of the acid curve from pH 3.32 to 3.65. Shift of the ligand curve at a higher pH with respect to the acid curve for the same volume of alkali is probably due to the basic properties of the ligand which has the tendency to accept a proton from the strongly acidic medium. At pH 3.74, the acid and ligand curves converge and the ligand curve then starts diverging from the acid curve at pH 3.95. The divergence of the ligand curve from the acid curve indicates the protonation of the ligand at that pH range. Only one inflection point is observed at pH ranges 3.95 to 11.32 in the titration curve of the ligand, showing that dabBzGH accepted only one proton at these pH ranges. Addition of metal ion to the free ligand solution results in shifting the buffer region of the ligand to a lower pH value as observed in the complex curves (c), (d) and (e) having Ni2+, Cu2+ and Cd2+ ions, respectively. This observation suggests that complex formation proceeds by releasing proton(s) from the base. A large decrease in pH for the metal titration curves relative to the ligand curve might be attributed to strong metal - ligand interaction. The metal - ligand curves are well separated from the ligand curve as shown by the figures. The Ni(II), Cd(II) and Cu(II) complex curves start diverging from the ligand curve (b) at pH 8.23, 8.66 and 6.01, respectively, showing that the respective metal-ligand complexation started at these pH values. The wide divergence of Ni(II), Cd(II) and Cu(II) complex curves from the ligand curve at pH, 8.80, 8.89 and 6.70, respectively, indicates
completion of the complexation reactions at these pH ranges. The titration was continued till the reaction mixture turned turbid. The turbidity is due to the formation of hydroxo complexes of Ni2+, Cd2+ and Cu2+ ions which started at pH, 9.21, 8.92 and 6.90, respectively. It was not possible to extend the investigation beyond these pH ranges, since the formation of hydroxo complex species is likely to disturb the postulated metal - ligand equilibrium [2, 3]. The titration curves at 300.15 and 310.15 K show similar pattern though the pH ranges at which the protonation of the ligand, the metal - ligand complexation and metal - hydroxo formation occurred, are different.
Figures 3.1.1.2, 3.1.1.3 and 3.1.1.4 represent the titration curves at different micellar media. These figures indicate that there is no significant difference in the complex curves with respect to the acid and ligand curves suggesting similar nature of proton - ligand and metal - ligand formation reactions in all the media. However, as observed from the figures, the presence of the surfactants in the media caused a shift in the ligand and complex curves towards a lower pH value as compared to those in the aqueous - dioxane media. This observation would suggest stronger proton - ligand and metal - ligand interactions in aqueous - dioxane medium than those in the surfactant media.
3.1.1.2.Proton-ligand stability constant
The protonation curves for dabBzGH at three different temperatures (290.15, 300.15 and 310.15) K in aqueous - dioxane, TX-100, SDBS and CTAB micellar media are obtained by plotting , the average number of proton attached per
ligand (Equation 1, Section 2.6.2) vs pH. Figures 3.1.1.5 and 3.1.1.6 represent the protonation curves at three different temperatures in different media.
The figures show that the protonation curves extend from 0.02 to 1.0 on the scale showing that only one proton was dissociated from the ligand in all the media. The dissociation constants (log H
dabBzGH
K ) of the ligand at different temperatures and in different media were evaluated from the curves using Bjerrum’s half integral method [4] and are collected in Table 3.1.1.1. In all the media, the values of log H
dabBzGH
K are observed to decrease with increase in temperature showing that the dissociation of the ligand was exothermic and favorable at lower temperature. The values so obtained are in good agreement with the reported data [1].
At a constant temperature, the protonation constants decrease in the presence of the surfactants. The trend in the protonation constant values in aqueous - dioxane, and in 100, SDBS and CTAB micellar media are Aq > SDBS > TX-100 > CTAB, which suggests that the affinity of the ligand for protons decreases in presence of the surfactants in the media.
Figure 3.1.1.5. Protonation curves of dabBzGH in different media at different temperatures: (a) □, at 290.15 K; (b) ○, at 300.15 K and (c), at 310.15 K.
7.5 8.0 8.5 9.0 9.5 10.0 10.5 11.0 0.5 0.6 0.7 0.8 H
n
(c) (b) (a)Aqueous - dioxane
pH 7.5 8.0 8.5 9.0 9.5 10.0 10.5 11.0 0.3 0.4 0.5 0.6 0.7 0.8 0.9 1.0 (c) (b) (a) Hn
TX-100
pH 7.5 8.0 8.5 9.0 9.5 10.0 10.5 11.0 0.0 0.1 0.2 0.3 0.4 0.5 0.6 0.7 0.8 0.9 Hn
(c) (b) (a)CTAB
pH 7.5 8.0 8.5 9.0 9.5 10.0 10.5 11.0 0.4 0.5 0.6 0.7 0.8 0.9 1.0 Hn
(c) (b) (a)SDBS
pHFigure 3.1.1.6. Protonation curves of dabBzGH at different temperatures in different media: (a) □, aqueous dioxane; (b), SDBS; (c) ○, TX-100; and (d) , CTAB micellar media.
7 .5 8.0 8.5 9 .0 9 .5 10 .0 10 .5 1 1.0 1 1 .5 0.2 0.3 0.4 0.5 0.6 0.7 0.8 0.9 H
n
(d ) (c) (b ) (a) 29 0 .1 5 K p H 7 .5 8 .0 8 .5 9 .0 9 .5 1 0 .0 1 0 .5 1 1 .0 0 .3 0 .4 0 .5 0 .6 0 .7 0 .8 0 .9 Hn
(d ) (c ) (b ) (a ) 3 1 0 .1 5 K p H 7 .5 8 .0 8 .5 9 .0 9 .5 1 0 .0 1 0 .5 1 1 .0 0 .3 0 .4 0 .5 0 .6 0 .7 0 .8 0 .9 1 .0 Hn
(d ) (c ) (b ) (a ) 3 0 0 .1 5 K p HTable 3.1.1.1. Protonation constant (log H dabBzGH
K ) of dabBzGH and stability constants (log M
dabBzGH
K ) of 1:1 M(II) - dabBzGH chelates at different temperatures in 40 % (v/v) Aqueous - dioxane, and in TX-100, SDBS and CTAB micellar media. Medium Temperature (K) log H dabBzGH K log M dabBzGH K Cu Ni Cd Aqueous-dioxane 290.15 11.18±0.01 9.09 ±0.01 5.89 ±0.01 5.78 ±0.11 300.15 11.01± 0.01 8.85 ±0.07 5.47 ±0.07 5.33 ±0.09 310.15 10.71± 0.02 7.79 ±0.06 5.34 ±0.02 5.19 ±0.01 SDBS 290.15 10.83± 0.02 8.28±0.01 5.74 ±0.02 5.64 ±0.07 300.15 10.72± 0.02 8.08 ±0.01 5.40 ±0.01 5.25 ±0.05 310.15 10.56± 0.01 7.57 ±0.04 5.20 ±0.02 5.11±0.01 TX-100 290.15 10.92± 0.02 8.78 ±0.01 5.35 ±0.02 5.37 ±0.03 300.15 10.27± 0.01 7.65±0.01 4.54±0.11 5.20 ±0.04 310.15 9.96 ± 0.03 7.38 ±0.03 4.46 ±0.11 4.75±0.02 CTAB 290.15 10.40±0.01 6.89±0.04 4.85±0.02 4.77±0.08 300.15 10.09 ±0.02 6.75±0.02 4.70±0.02 4.63±0.10 310.15 9.66±0.01 6.39±0.02 4.48±0.12 4.37±0.05
3.1.1.3.Metal-ligand stability constant
The average number of ligand attached per metal ion, and the free ligand exponent, pL are calculated by using the equations (2) and (3) of Section 2.6.2. The metal-ligand formation curves at different temperatures and in different media are obtained by plotting the values of against pL and are shown in Figures 3.1.1.7 and 3.1.1.8. 5 . 0 5 . 5 6 . 0 6 . 5 7 . 0 7 . 5 8 . 0 8 . 5 9 . 0 9 . 5 1 0 . 0 0 . 0 0 . 1 0 . 2 0 . 3 0 . 4 0 . 5 0 . 6 0 . 7 0 . 8 0 . 9 1 . 0 n A q u e o u s - d i o x a n e p L 4 . 5 5 . 0 5 . 5 6 . 0 6 . 5 7 . 0 7 . 5 8 . 0 8 . 5 9 . 0 9 . 5 0 . 0 0 . 1 0 . 2 0 . 3 0 . 4 0 . 5 0 . 6 0 . 7 0 . 8 0 . 9 1 . 0 T X - 1 0 0 n p L
Figure 3.1.1.7. Metal-ligand formation curves of dabBzGH: Cu, ● Ni, ■ Cd, at 290.15 K;∆ Cu, + Ni, ○ Cd at 300.15 K and Cu, □ Ni, ◄ Cd at 310.15 K in aqueous dioxane and different micellar media.
5.0 5.5 6.0 6.5 7.0 7.5 8.0 8.5 9.0 -0.1 0.0 0.1 0.2 0.3 0.4 0.5 0.6 0.7 0.8 0.9 1.0
n
S D B S
pL 4.5 5.0 5.5 6.0 6.5 7.0 7.5 8.0 0.0 0.1 0.2 0.3 0.4 0.5 0.6 0.7 0.8 0.9 1.0 1.1n
CTAB
pLFigure 3.1.1.8. Metal-ligand formation curves of dabBzGH at different temperatures: ▼Cu, Ni, ► Cd in aqueous dioxane; Cu, ● Ni, ■ Cd in SDBS; ∆ Cu, + Ni, ○ Cd in TX-100; Cu, □ Ni, ◄ Cd in CTAB media.
4 .5 5 .0 5 .5 6 .0 6 .5 7 .0 7 .5 8 .0 8 .5 -0 .1 0 .0 0 .1 0 .2 0 .3 0 .4 0 .5 0 .6 0 .7 0 .8 0 .9 1 .0 1 .1 n 3 1 0 .1 5 K p L 4 .0 4 .5 5 .0 5 .5 6 .0 6 .5 7 .0 7 .5 8 .0 8 .5 9 .0 9 .5 1 0 .0 1 0 .5 -0 .1 0 .0 0 .1 0 .2 0 .3 0 .4 0 .5 0 .6 0 .7 0 .8 0 .9 1 .0 n 3 0 0 .1 5 K p L 4 .5 5 .0 5 .5 6 .0 6 .5 7 .0 7 .5 8 .0 8 .5 9 .0 9 .5 1 0 .0 0 .0 0 .1 0 .2 0 .3 0 .4 0 .5 0 .6 0 .7 0 .8 0 .9 n 2 9 0 .1 5 K p L
An analysis of the metal - ligand formation curves at various temperatures and in different media indicates that the ligand formed complexes with Ni2+, Cu2+ and Cd2+ ions at different pH-ranges. However, the values of (0.1 < < 1.5) for all the complexes at different temperatures in different media, would suggest that dabBzGH formed only 1:1 metal - ligand complexes with the metal ions. It has been observed from the figures that the maximum value of n obtained in all four media for all complexes is 1.04. The stability constant of the complexes, log
M dabBzGH
K at (290.15, 300.15 and 310.15) K and in aqueous - dioxane, TX-100, SDBS and CTAB micellar media were evaluated from the formation curves employing Bjerrum’s half intregral method [4] and are also included in Table 3.1.1.1. The table shows that at all the temperatures, there is a gradual decrease in log M
dabBzGH
K value from Cu to Ni to Cd where the trend follows: Cu > Ni > Cd. A gradual decrease in the stability constants of the complexes in all the media with an increase in temperature is also observed showing that the complexation reactions were exothermic in nature and hence favorable at lower temperature. This behavior might also be ascribed to the thermal hydrolysis of the metal complexes [1].
At a constant temperature, the stability constants of the complexes in aqueous - dioxane, and in TX-100, SDBS and CTAB micellar media fall in the Irving-Williams order [5]. The values of stability constants of the Cu(II) complex are higher than those of Ni(II) and Cd(II) complexes in all the media. The extra stabilization of the Cu(II) complex could be attributed to the unique electronic configuration on Cu2+ and the Jahn-Teller effect [6]. As observed in the
protonation curves of the ligand in different media, the presence of anionic, cationic and nonionic surfactants in the media also caused a shift in the formation curves of all the complexes towards the left, thereby showing a decrease in the stability in presence of the surfactants. This would suggest a lesser favorability of the complexation reactions in micellar media.
3.1.1.4.Thermodynamic parameters.
The thermodynamic parameters associated with the protonation and complexation of dabBzGH at ionic strength 0.10 mol·dm-3 KNO3 in different media are also studied. The change in free energy, (∆G), is calculated from the formation constant values (log K) at various temperatures and in different media using the temperature coefficients and Gibb’s Helmholtz equations [7]. Value of log KH or log KM obtained in all the media are plotted against 1/T and the plots are, respectively, shown in Figures 3.1.1.9 and 3.1.1.10. The change in enthalpy, (∆H), for the protonation and complexation reactions of the ligand in different media is evaluated from the slope of the plots and these values are used for calculating the ∆S values associated with the above reactions. The thermodynamic parameters thus obtained for the protonation and complexation reactions of dabBzGH in both aqueous - dioxane and micellar media are collected in Tables 3.1.1.2 and 3.1.1.3, respectively.
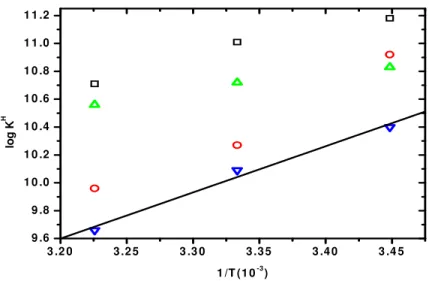
Figure 3.1.1.9. Plot of log KH vs 1/T in different media: □, aqueous - dioxane; ○, TX-100; ∆, SDBS and CTAB. T is temperature in absolute scale.
Figure 3.1.1.10. Plot of log KM vs 1/T at different temperatures and in different media; ▼Cu, ► Ni, Cd in aqueous dioxane; ■ Cu, + Ni, ○ Cd in TX-100; ◄ Cu, ∆ Ni, □Cd in SDBS and Cu, ● Ni, Cd in CTAB. T is temperature in absolute scale. 3 .2 0 3 .2 5 3 .3 0 3 .3 5 3 .4 0 3 .4 5 4 .5 5 .0 5 .5 6 .0 6 .5 7 .0 7 .5 8 .0 8 .5 9 .0 lo g K M 1 /T (1 0-3) 3 .2 0 3 .2 5 3 .3 0 3 .3 5 3 .4 0 3 .4 5 9 .6 9 .8 1 0 .0 1 0 .2 1 0 .4 1 0 .6 1 0 .8 1 1 .0 1 1 .2 lo g K H 1 /T (1 0-3)
Table 3.1.1.2. Thermodynamic parameters of the dissociation reaction of dabBzGH at different temperatures in 40 % Aqueous - dioxane, and in TX-100, SDBS and CTAB micellar media.
Medium Temperature (K) -∆G (kJ·mol-1) -∆H* (kJ·mol-1) -∆S* (J·deg-1·mol-1) Aqueous dioxane 290.15 62.08 ± 0.01 40.44±0.07 +76.03±0.02 300.15 63.24 ± 0.01 310.15 63.57± 0.02 SDBS 290.15 60.13± 0.02 23.30±0.03 +127.60± 0.03 300.15 61.58± 0.02 310.15 62.68 ± 0.01 TX-100 290.15 60.63 ±0.02 84.21±0.10 84.07±0.07 300.15 58.99± 0.01 310.15 59.12± 0.03 CTAB 290.15 57.75± 0.01 63.91±0.07 19.83±0.07 300.15 57.96±0.02 310.15 57.34± 0.01
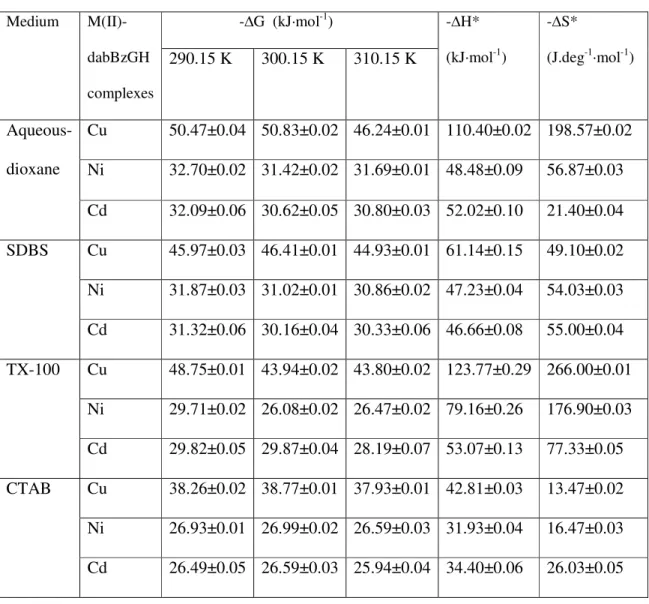
Table 3.1.1.3. Thermodynamic parameters of 1:1 M(II) - dabBzGH Chelates at different temperatures in 40 % (v/v) ) Aqueous - dioxane, and in TX-100, SDBS and CTAB micellar media.
*∆H and ∆S were computed using the linear-fit program.
Medium M(II)-dabBzGH complexes -∆G (kJ·mol-1) -∆H* (kJ·mol-1) -∆S* (J.deg-1·mol-1) 290.15 K 300.15 K 310.15 K Aqueous- dioxane Cu 50.47±0.04 50.83±0.02 46.24±0.01 110.40±0.02 198.57±0.02 Ni 32.70±0.02 31.42±0.02 31.69±0.01 48.48±0.09 56.87±0.03 Cd 32.09±0.06 30.62±0.05 30.80±0.03 52.02±0.10 21.40±0.04 SDBS Cu 45.97±0.03 46.41±0.01 44.93±0.01 61.14±0.15 49.10±0.02 Ni 31.87±0.03 31.02±0.01 30.86±0.02 47.23±0.04 54.03±0.03 Cd 31.32±0.06 30.16±0.04 30.33±0.06 46.66±0.08 55.00±0.04 TX-100 Cu 48.75±0.01 43.94±0.02 43.80±0.02 123.77±0.29 266.00±0.01 Ni 29.71±0.02 26.08±0.02 26.47±0.02 79.16±0.26 176.90±0.03 Cd 29.82±0.05 29.87±0.04 28.19±0.07 53.07±0.13 77.33±0.05 CTAB Cu 38.26±0.02 38.77±0.01 37.93±0.01 42.81±0.03 13.47±0.02 Ni 26.93±0.01 26.99±0.02 26.59±0.03 31.93±0.04 16.47±0.03 Cd 26.49±0.05 26.59±0.03 25.94±0.04 34.40±0.06 26.03±0.05
As shown by the tables, the ∆G values are negative for both the protonation and complexation reactions suggesting that all these reactions were spontaneous [8]. It is also observed that these values have no sharp behavior with temperature, indicating the independent nature of the reactions with respect to temperature [8].
For the protonation of dabBzGH, negative ∆H and positive ∆S values in aqueous and SDBS micellar media indicate that protonation of the ligand was both enthalpy- and entropy-driven in these media. However, in TX-100 and CTAB micellar media, ∆S values are negative showing that the protonation had an unfavorable change of entropy in presence of TX-100 and CTAB.and heat of reaction for the protonation of dabBzGH in TX-100 micellar medium, in particular, is comparatively high. ∆H values of all the complexation reactions are negative indicating their exothermic nature.
For the complexation reactions, ∆G values are the highest in the aqueous medium while ∆H and ∆S values are the highest in TX-100 micellar medium. This observation shows that complexation is favored most in aqueous media as compared to the micellar media. ∆S values are negative for all the complexation reactions indicating that the complexes formed are highly solvated.
The thermodynamic parameters collected in Tables 3.1.1.2 and 3.1.1.3 indicate that they were perturbed by the presence of surfactants in the reacting systems. Though all the reactions were spontaneous and enthalpy driven in micellar media, a gradual decrease in the ∆G values for the protonation and complexation reactions in presence of surfactants in the order (Aq > SDBS > TX-100 > CTAB) is observed while the ∆H and ∆S values vary randomly.
A decrease in log K values with an increase in temperature and the negative values of ∆H for both protonation and complexation reactions in all the media would also suggest the importance of the enthalpy rather than the entropy factor in both processes.
3.1.2. Potentiometric studies of Ni (II), Cu (II) and Cd(II) complexes of N-(2-2-[1-(3-aminophenyl)ethylidene]hydrazino-2-oxoethyl) benzamide (aehb) in aqueous - dioxane and micellar media
The compositions of the reaction mixtures for the pH-metric titration of Ni(II), Cu(II) and Cd(II) complexes of N-(2-2-[1-(3-aminophenyl)ethylidene]hydrazino-2-oxoethyl) benzamide (aehb) are:
Solution (i) : 2.5 mL HNO3 (0.001 M) + 5 mL KNO3 (0.1 M) Solution (ii) : Solution (i) + 1.5 mL aehb (0.0006 M), and
Solution (iii) : Solution (ii) + 0.75 mL of MCl2. nH2O (0.0003 M) [M= Cu, Ni and Cd]
Volume of all these reaction mixtures was made up to 25 mL using 40 % (v/v) aqueous - dioxane while for the titration in TX-100, SDBS and CTAB micellar media, 5 mmol each of the surfactants TX-100, SDBS and CTAB were added separately in each set of the above reaction mixtures before making up the volume. The reaction mixtures in each set, solution (i), solution (ii) and solution (iii) were then titrated individually against standard 0.02 M KOH solution.
3.1.2.1. Titration curves
The titration curves obtained by plotting the pH values against the volume of alkali added to the reaction mixtures of solution (i), solution (ii) and solution (iii) to attain the same pH value are referred to as acid curve, ligand curve and complex curve, respectively. The titration curves of the M(II) - aehb complexes at a constant ionic strength 0.1 mol·dm-3 KNO3 and at different temperatures
(290.15, 300.15 and 310.15) K in aqueous - dioxane and TX-100, SDBS and CTAB micellar media are represented in Figures 3.1.2.1, 3.1.2.2, 3.1.2.3 and 3.1.2.4, respectively.
Each figure has the following five curves (a) to (e). Curve (a) : [HNO3]
Curve (b) : [HNO3+ aehb]
Curve (c) : [HNO3 + aehb + Ni2+ion] Curve (d) : [HNO3 + aehb + Cd2+ ion] Curve (e) : [HNO3 + aehb + Cu2+ion]
Figure 3.1.2.1. pH-metric titration curves of M(II) - aehb complexes at different temperatures in Aqueous - dioxane medium. (a) □, acid curve; (b) ○, ligand curve; (c) ∆, Ni-complex curve; (d) *, Cd-complex curve and (e) +, Cu- complex curve.
0 .0 0 .5 1 .0 1 .5 2 .0 2 .5 3 .0 3 .5 4 .0 3 4 5 6 7 8 9 1 0 1 1 3 1 0 . 1 5 K 3 1 0 . 1 5 K 3 1 0 . 1 5 K 3 1 0 . 1 5 K (e ) (d ) (c ) (b ) (a ) p H V o lu m e o f K O H (m L ) 0 .0 0 .5 1 .0 1 .5 2 .0 2 .5 3 .0 3 .5 4 .0 3 4 5 6 7 8 9 1 0 2 9 0 .1 5 K (e ) (d ) (c ) p H V o lu m e o f K O H (m L ) 0 . 0 0 . 5 1 . 0 1 . 5 2 . 0 2 . 5 3 . 0 3 . 5 4 . 0 3 4 5 6 7 8 9 1 0 1 1 3 0 0 . 1 5 K ( e ) ( d ) ( c ) ( b ) ( a ) p H V o l u m e o f K O H ( m L )
Figure 3.1.2.2. pH-metric titration titration curves of M(II) - aehb complexes at
different temperatures in aqueous TX-100 medium. (a) □, acid curve; (b) ○, ligand curve; (c) ∆, Ni-complex curve; (d) *, Cd-complex curve and (e) +, Cu- complex curve.
0 .0 0 .5 1 . 0 1 . 5 2 . 0 2 .5 3 .0 3 .5 4 .0 3 4 5 6 7 8 9 1 0 1 1 2 9 0 . 1 5 K ( e ) ( d ) ( c ) ( b ) ( a ) p H V o lu m e o f K O H ( m L ) 0 .0 0 .5 1 .0 1 .5 2 .0 2 .5 3 .0 3 .5 4 .0 3 4 5 6 7 8 9 1 0 1 1
3 0 0 .1 5 K
(e ) (d ) (c ) (b ) (a ) p H V o lu m e o f K O H (m L ) 0 . 0 0 . 5 1 . 0 1 . 5 2 . 0 2 . 5 3 . 0 3 . 5 4 . 0 3 4 5 6 7 8 9 1 0 1 1 3 1 0 . 1 5 K ( d ) ( e ) ( c ) ( b ) ( a ) p H V o l u m e o f K O H ( m L )Figure 3.1.2.3. pH-metric titration curves of M(II) - aehb complexes at different temperatures in aqueous SDBS medium. (a) □, acid curve; (b) ○, ligand curve; (c) ∆, Ni-complex curve; (d) *, Cd-complex curve and (e) +, Cu- complex curve.
0 .0 0 .5 1 .0 1 .5 2.0 2 .5 3 .0 3 .5 4 .0 3 4 5 6 7 8 9 1 0 1 1
3 0 0 .1 5 K
(e ) (d ) (c ) (b ) (a ) p H V o lu m e o f K O H (m L ) 0 . 0 0 . 5 1 .0 1 . 5 2 .0 2 .5 3 . 0 3 .5 4 .0 3 4 5 6 7 8 9 1 0 2 9 0 . 1 5 K ( e ) ( d ) ( c ) ( b ) p H V o l u m e o f K O H ( m L ) 0 . 0 0 .5 1 . 0 1 . 5 2 .0 2 .5 3 .0 3 .5 4 .0 3 4 5 6 7 8 9 1 0 1 1 3 1 0 . 1 5 K ( e ) ( d ) ( c ) ( b ) ( a ) p H V o l u m e o f K O H ( m L )Figure 3.1.2.4. pH-metric titration curves of M(II) - aehb complexes at different temperatures in aqueous CTAB medium. (a) □, acid curve; (b) ○, ligand curve; (c) ∆, Ni-complex curve; (d) *, Cd-complex curve and (e) +, Cu- complex curve.
0 .0 0 .5 1 .0 1 .5 2 .0 2 .5 3 .0 3 .5 3 4 5 6 7 8 9 1 0 1 1 (e ) (d )
2 9 0 .1 5 K
(c ) (b ) (a ) p H V o lu m e o f K O H (m L ) 0 .0 0 .5 1 .0 1 .5 2 .0 2 .5 3 .0 3 .5 4 .0 3 4 5 6 7 8 9 1 0 1 1 (e ) (d )3 0 0 .1 5 K
(c ) (b ) (a ) p H V o lu m e o f K O H (m L ) 0 .0 0 .5 1.0 1 .5 2 .0 2.5 3 .0 3 .5 3 4 5 6 7 8 9 10 (e ) (d )3 1 0 .1 5 K
(b ) (c ) (a ) p H V o lu m e o f K O H (m L )The pH-metric titration curves of the Cu(II), Ni(II) and Cd(II) complexes of aehb are shown in Figure 3.1.2.1 in aqueous - dioxane medium at different temperatures. It is observed from Figure 3.1.2.1 (290.15 K) that the acid titration curve (a) starts from pH 3.01 and extends up to pH 11.34 while the ligand curve (b) is observed to be on the left side of the acid curve from pH 3.32 to 6.33. Basicity of the ligand causes the shift of the ligand curve with respect to the acid curve. However, the acid and ligand curves converge at pH 6.45 and the ligand curve starts diverging from the acid curve at pH 6.60. The divergence of the ligand curve from the acid curve is due to the protonation of the ligand at that pH range. The titration curve of the ligand shows only one inflection at pH ranges 6.60 to 11.34 indicating that aehb accepted only one proton at these pH ranges. It has been observed from the metal - ligand curves (c), (d) and (e), containing Ni2+, Cd2+ and Cu2+ ions, respectively, that the addition of the metal ion to the free ligand solution results in shifting the buffer region of the ligand to a lower pH value. Thus, complex formation proceeded by releasing proton(s) from the base. A large decrease in pH for the metal titration curves relative to the ligand curve might be attributed to strong metal - ligand interaction. The metal - ligand curves are well separated from the ligand curves as shown by the figures. As observed from the figure, Ni(II), Cu(II) and Cd(II) complex curves started diverging from the ligand curve (b) at pH 6.30, 6.51 and 6.07, respectively, suggesting that the respective metal - ligand complexation started at these pH values and the wide divergence of the complex curves from the ligand curve at pH 8.55, 8.78 and 6.80 indicate completion of the complexation reactions at these pH ranges. The titration
was continued till the reaction mixture turned turbid pH 8.75, 8.85 and 7.1, due to the formation of metal - hydroxo complexes of Ni2+, Cd2+ and Cu2+ ions, respectively. Since the formation of hydroxo complex species is likely to disturb the postulated metal - ligand equilibrium [2, 3], the investigation was not extended beyond these pH ranges. The titration curves at 300.15 and 310.15 K have similar nature and they differ only the pH values at which the protonation of the ligand, the metal - ligand complexation and metal - hydroxo formation occurred.
The pH-metric titration curves at different micellar media are represented in Figures 3.1.2.2, 3.1.2.3 and 3.1.2.4. The figures indicate that there is no significant difference in the complex curves with respect to the acid and ligand curves. This suggests similar nature of proton - ligand and metal - ligand formation reactions in all the media. However, presence of the surfactants in the media causes a shift in the ligand and complex curves towards a lower pH value as compared to those in the aqueous - dioxane media. This observation would suggest stronger proton - ligand and metal - ligand interactions in aqueous - dioxane medium than those in the micellar media.
3.1.2.2. Proton-ligand stability constant
The protonation curves of aehb at three different temperatures (290.15, 300.15 and 310.15) K in aqueous - dioxane, TX-100, SDBS and CTAB micellar media, are obtained by plotting , the average number of proton attached per ligand vs pH and the curves are shown in Figures 3.1.2.5 and 3.1.2.6. The value of extended from 0.1 to 1.0 showing only one protonation step for the ligand. The
dissociation constants (log H aehb
K ) of the ligand at different temperatures and in different media evaluated from the curves using Bjerrum’s half integral method [4] are collected in Table 3.1.2.1. In all the media, the values of log H
aehb
K are observed to decrease with increase in temperature showing that the dissociation of the ligand was exothermic and favorable at lower temperature. The values so obtained agree with the reported data [1].
At a constant temperature, the protonation constants decreased in the presence of surfactants. The trend in the protonation constant values in aqueous - dioxane, TX-100, SDBS and CTAB micellar media is Aq > TX-100 > SDBS > CTAB, which shows that the affinity of the ligand for protons decreased in presence of the surfactants in the media.
Figure 3.1.2.5. Proton-ligand formation curves of aehb in different media at different temperatures: (a) □, at 290.15 K; (b) ○, at 300.15 K and (c) at 310.15 K.
6.5 7.0 7.5 8.0 8.5 9.0 9.5 10.0 10.5 11.0 0.2 0.3 0.4 0.5 0.6 0.7 0.8 0.9 1.0 1.1 (c) (b) (a)
n
HSDBS
pH 6.5 7.0 7.5 8.0 8.5 9.0 9.5 10.0 10.5 0.2 0.3 0.4 0.5 0.6 0.7 0.8 0.9 1.0 (c) (b) (a)n
HCTAB
pH 6.5 7.0 7.5 8.0 8.5 9.0 9.5 10.0 10.5 11.0 11.5 0.2 0.3 0.4 0.5 0.6 0.7 0.8 0.9 1.0 (c) (b) (a)n
HAqueous - dioxane
pH 6.5 7.0 7.5 8.0 8.5 9.0 9.5 10.0 10.5 11.0 11.5 0.0 0.1 0.2 0.3 0.4 0.5 0.6 0.7 0.8 0.9 1.0 1.1 (c) (b) (a)n
HTX-100
pHFigure 3.1.2.6. Protonation curves of aehb at different temperatures in different media: (a) □, Aqueous - dioxane; (b) ○, TX-100; (c) and (d) CTAB micellar media. 6 .5 7 .0 7 .5 8 .0 8 .5 9 .0 9 .5 1 0 .0 1 0 .5 1 1 .0 0 .2 0 .3 0 .4 0 .5 0 .6 0 .7 0 .8 0 .9 (d ) (c ) (b ) (a ) H
n
2 9 0 .1 5 K p H 6 .5 7 .0 7 .5 8 .0 8 .5 9 .0 9 .5 1 0 .0 1 0 .5 1 1 .0 0 .1 0 .2 0 .3 0 .4 0 .5 0 .6 0 .7 0 .8 0 .9 1 .0 (d ) (c ) (b ) (a ) Hn
3 0 0 .1 5 K p H 6 .0 6 .5 7 .0 7 .5 8 .0 8 .5 9 .0 9 .5 1 0 .0 1 0 .5 0 .1 0 .2 0 .3 0 .4 0 .5 0 .6 0 .7 0 .8 0 .9 1 .0 (d ) (c ) (b ) (a ) Hn
3 1 0 .1 5 K p HTable 3.1.2.1. Protonation constant (log H aehb
K ) of aehb and stability constants (log M
aehb
K ) of 1:1 M(II) - aehb chelates at different temperatures in 40 % (v/v) Aqueous - dioxane, and in TX-100, SDBS and CTAB micellar media.
Medium Temperature (K) log H aehb K log M aehb K Cu Ni Cd Aqueous-dioxane 290.15 10.84± 0.02 7.41 ±0.03 5.92 ±0.00 5.49 ±0.11 300.15 10.68± 0.03 7.32 ±0.04 5.54 ±0.01 5.39 ±0.05 310.15 10.24± 0.02 7.25 ±0.01 5.23 ±0.01 5.16 ±0.13 TX-100 290.15 10.75± 0.02 7.35 ±0.01 5.60 ±0.01 5.26 ±0.08 300.15 10.25± 0.13 7.16 ±0.01 5.40 ±0.01 5.12 ±0.06 310.15 10.05± 0.03 7.03 ±0.01 5.21 ±0.04 4.96 ±0.07 SDBS 290.15 10.26± 0.03 7.30 ±0.01 5.25 ±0.02 5.18 ±0.03 300.15 10.09± 0.05 7.07 ±0.04 5.19 ±0.03 5.08 ±0.09 310.15 9.82 ± 0.01 6.97 ±0.05 4.88 ±0.01 4.88 ±0.08 CTAB 290.15 10.18 ±0.01 6.96±0.01 5.02±0.05 4.75±0.06 300.15 10.07 ±0.03 6.95±0.04 4.94±0.03 4.62±0.08 310.15 9.77 ±0.02 6.67±0.01 4.66±0.02 4.48±0.13
3.1.2.3. Metal-ligand stability constant
The average number of ligand attached per metal ion, and the free ligand exponent, pL are calculated as shown in Section 2.6.2. Figures 3.1.2.7 and 3.1.2.8, exhibit the metal - ligand formation curves of Ni(II), Cu(II) and Cd(II) complexes at different temperatures and in different media obtained by plotting the values of against pL. 5.0 5.5 6.0 6.5 7.0 7.5 8.0 0.0 0.1 0.2 0.3 0.4 0.5 0.6 0.7 0.8 0.9 1.0 1.1
n
A q u eo u s - d io x a n e
p L 5.0 5.5 6.0 6.5 7.0 7.5 8.0 0.0 0.1 0.2 0.3 0.4 0.5 0.6 0.7 0.8 0.9 1.0n
T X -100
pLFigure 3.1.2.7. Metal - ligand formation curves of aehb: ● Cu, ○ Ni, ■ Cd, at 290.15 K;∆Cu, + Ni, Cd at 300.15 K and Cu, □ Ni, ◄ Cd at 310.15 K in aqueous - dioxane and different micellar media.
4.5 5.0 5.5 6.0 6.5 7.0 7.5 -0.1 0.0 0.1 0.2 0.3 0.4 0.5 0.6 0.7 0.8 0.9 1.0
n
SD B S
pL 4.5 5.0 5.5 6.0 6.5 7.0 7.5 0.0 0.1 0.2 0.3 0.4 0.5 0.6 0.7 0.8 0.9 1.0n
C TA B
pL
Figure 3.1.2.8. Metal - ligand formation curves of aehb at different temperatures:
▼Cu, Ni, ► Cd in aqueous - dioxane; ∆ Cu, + Ni, ○ Cd in TX-100; Cu, ● Ni, ■ Cd in SDBS; □ Cu, Ni, ◄ Cd and in CTAB medium.
4 .5 5 .0 5 . 5 6 . 0 6 .5 7 .0 7 .5 8 .0 0 .0 0 .1 0 .2 0 .3 0 .4 0 .5 0 .6 0 .7 0 .8 0 .9 1 .0 n 3 0 0 .1 5 K p L 4 .5 5 .0 5 .5 6 .0 6 .5 7 .0 7 .5 8 .0 0 .0 0 .1 0 .2 0 .3 0 .4 0 .5 0 .6 0 .7 0 .8 0 .9 1 .0 n 3 1 0 .1 5 K p L 4 .5 5 .0 5 .5 6 .0 6 .5 7 .0 7 .5 8 .0 0 .0 0 .1 0 .2 0 .3 0 .4 0 .5 0 .6 0 .7 0 .8 0 .9 1 .0 1 .1 n 2 9 0 .1 5 K p L
As shown by the metal - ligand formation curves at different temperatures and in different media, it is evident that the aehb reacted with Ni2+, Cu2+ and Cd2+ ions to form complexes at different pH ranges. The maximum value of n does not extend beyond 1.0 on the scale for all the complexes formed. Therefore, M(II) - aehb complexes are of only 1:1 metal - ligand stoichiometry. The figures show that the formation curves of Cu(II) complexes in all the four media extend from 0.05 to 1.05 while those of Ni(II) and Cd(II) complexes extend from 0.0 to 0.95 on the scale. The stability constant of the complexes, log
K
aehbM at (290.15, 300.15 and 310.15) K and in aqueous - dioxane, TX-100, SDBS and CTAB micellar media are evaluated from the formation curves employing Bjerrum’s half intregral method [4] and the values are collected in Table 3.1.2.1.The table shows that at all the temperatures, there is a gradual increase in log M
aehb
K
value from Cd and Ni to Cu. The trend follows: Cu < Ni < Cd. There is also a gradual decrease in the stability constants of the complexes in all the media with an increase in temperature showing that the complexation reactions were exothermic in nature and hence favorable at lower temperature. This behavior might also be ascribed to the thermal hydrolysis of the metal complexes [1]. At a constant temperature, the stability constants of the complexes in aqueous - dioxane, and TX-100, SDBS and CTAB micellar media fall in the Irving-William’s order [5]. The values of stability constants of the Cu(II) complex are higher than those for Ni(II) and Cd(II) complexes in all the media. The extra stabilization of the Cu(II) complex could be attributed to the unique electronic configuration on Cu2+ ion and the Jahn - Teller effect [6].As observed in the protonation curves of the ligand in different media, the presence of anionic, cationic and nonionic surfactants in the media also cause a shift in the formation curves of all the complexes towards the left.
3.1.2.4. Thermodynamic parameters
The thermodynamic parameters associated with the protonation and complexation reactions of aehb in both aqueous - dioxane and micellar media at an ionic strength 0.10 mol·dm-3 KNO3 are collected in Tables 3.1.2.2 and 3.1.2.3, respectively. The change in free energy, (∆G), is calculated from the formation constant values (log KM) at various temperatures and in different media using the temperature coefficients and Gibb’s Helmholtz equations [7]. The plots of log KH or log KM against 1/T in all the media are exhibited in Figures 3.1.2.9 and 3.1.2.10. The change in enthalpy, (∆H), for the dissociation of the ligand and complexation reactions in different media was evaluated from the slope of the plots. The evaluated ∆H values for the protonation and complexation reactions are used for calculating the ∆S values associated with the reactions.
Figure 3.1.2.9. Plot of log KH vs 1/T in different media: □, aqueous - dioxane; ○, TX-100; ∆, SDBS and CTAB. T is temperature in absolute scale.
Figure 3.1.2.10. Plot of log KM vs 1/T at different temperatures and in different media; ▼Cu, ► Ni, Cd in aqueous - dioxane; ■ Cu, + Ni, ○ Cd in TX-100; ◄ Cu, ∆Ni, □Cd in SDBS and Cu, ● Ni, Cd in CTAB. T is temperature in absolute scale. 3 .2 0 3 .2 5 3 .3 0 3 .3 5 3 .4 0 3 .4 5 9 .7 9 .8 9 .9 1 0 .0 1 0 .1 1 0 .2 1 0 .3 1 0 .4 1 0 .5 1 0 .6 1 0 .7 1 0 .8 1 0 .9 lo g K H 1 /T ( 1 0-3) 3 .2 0 3 .2 5 3 .3 0 3 .3 5 3 .4 0 3 .4 5 4 .4 4 .6 4 .8 5 .0 5 .2 5 .4 5 .6 5 .8 6 .0 6 .2 6 .4 6 .6 6 .8 7 .0 7 .2 7 .4 lo g K M 1 /T (1 0- 3)
Table 3.1.2.2. Thermodynamic parameters of the dissociation reaction of aehb at different temperatures and at ionic strength 0.10 mol·dm-3 KNO3 in 40 % Aqueous - dioxane, and in TX-100, SDBS and CTAB micellar media.
Medium Temperature (K) -∆G (kJ·mol-1) -∆H* (kJ·mol-1) -∆S* (J·deg-1·mol-1) Aqueous-dioxane 290.15 60.19±0.01 51.34±0.02 +33.37±0.05 300.15 61.35±0.01 310.15 60.78±0.03 TX-100 290.15 59.69±0.02 61.54±0.04 8.87±0.05 300.15 58.88±0.04 310.15 59.65±0.02 SDBS 290.15 56.97±0.05 37.93±0.02 +66.77±0.02 300.15 57.96±0.01 310.15 58.29±0.01 CTAB 290.15 56.53±0.04 35.08±0.09 75.85±0.09 300.15 57.84±0.04 310.15 57.99±0.03
Table 3.1.2.3. Thermodynamic parameters of M(II) - aehb Chelates (1:1) at different temperatures and ionic strength 0.10 mol·dm-3 KNO3 in 40 % (v/v) ) Aqueous - dioxane, and in TX-100, SDBS and CTAB micellar media.
*∆H and ∆S were computed using the linear-fit program.
The ∆G values were negative for both protonation and metal complexation reactions of aehb showing spontaneity of these reactions [8]. The ∆G values do not exhibit any sharp behavior with temperature, indicating the independent nature of the reactions with respect to temperature [8]. Negative ∆H values and positive
Medium M(II)-aehb complexes -∆G (kJ·mol-1) -∆H* (kJ·mol-1) -∆S* (J·deg-1·mol-1) 290.15 K 300.15 K 310.15 K Aqueous-dioxane Cu 41.14±0.04 42.05±0.02 43.03±0.01 13.94±0.02 +93.70±0.02 Ni 32.87±0.02 31.82±0.02 31.04±0.01 60.07±0.02 94.17±0.03 Cd 30.48±0.06 30.96±0.05 30.63±0.03 28.30±0.04 +8.87±0.04 TX-100 Cu 40.81±0.03 41.13±0.01 41.73±0.01 27.93±0.01 +44.00±0.02 Ni 31.09±0.03 31.02±0.01 30.92±0.02 33.87±0.02 9.50±0.03 Cd 29.21±0.06 29.41±0.04 29.44±0.06 25.98±0.04 +11.43±0.04 SDBS Cu 40.53±0.01 40.61±0.02 41.37±0.02 28.98±0.02 +38.77±0.01 Ni 29.15±0.02 29.81±0.02 28.96±0.02 27.04±0.02 5.50±0.03 Cd 28.76±0.05 29.18±0.04 28.96±0.07 25.77±0.05 +11.37±0.05 CTAB Cu 38.65±0.05 39.92±0.05 39.59±0.05 24.46±0.12 +51.53±0.12 Ni 27.87±0.04 28.37±0.02 27.66±0.02 30.72±0.09 7.83±0.09 Cd 26.37±0.05 26.54±0.05 26.59±0.03 23.41±0.01 +10.47±0.01
∆S values for the protonation of the ligand in aqueous - dioxane media suggest that the protonation of the ligand was both enthalpy and entropy - driven in this medium. The ∆G and ∆H values associated with the complexation reactions were negative which show that the reactions were spontaneous and enthalpy - driven. Positive ∆S terms for Cu(II) and Cd(II) complexes indicate that the formation of these complexes was entropy-favored, while ∆S value was negative for the Ni(II) complex suggesting a highly solvated Ni(II) complex.
A decrease in log K with an increase in temperature and the negative values of
∆H for all the reactions in all the media showed exothermic and enthalpy favored reactions. This result would suggest the importance of the enthalpy rather than the entropy factor in both the protonation and complexation processes.
Tables 3.1.2.2 and 3.1.2.3 show that the thermodynamic parameters were perturbed by the presence of surfactants in the reacting systems. Though all the reactions were spontaneous and enthalpy driven in micellar media, a gradual decrease in the ∆G values for the protonation and complexation reactions in presence of surfactants was observed in the order (Aq > TX-100 > SDBS > CTAB) while the ∆H and ∆S values varied randomly. The ∆S value for the protonation of aehb was negative in micelles containing TX-100 and CTAB showing that the protonation had an unfavorable change of entropy in presence of TX-100 and CTAB.
References
1. H. M. Irving and H. S. Rossotti. The calculation of formation curves of metal complexes from pH-titration curves in mixed solvents. J. Chem.
Soc., 2904-2910 (1954).
2. G. H. Noncollas and M. B. Thomson. Guidelines for the determination of stability constants. Pure & Appl. Chem., 54:12, 2675-2692 (1982).
3. A. Braibanti, G. Ostacoli, P. Paoletti, L. D. Pettit and S. Samartano. Recommended procedure for testing the potentiometric apparatus and technique for the pH-metric measurement of metal-complex equilibrium constants. Pure & Appl. Chem., 59:12, 1721-1728 (1987).
4. J. Bjerrum. Metal ammine formation in aqueous solution. P. Haase and Son: Copenhagen.(1941).
5. H. M. Irving and R. J. P. Williams. The stability of transition-metal complexes. J. Chem. Soc., 3192–3210 (1953).
6. D. F. Shriver and P. W. Atkins. Inorganic Chemistry. 3rd edn. University Press: Oxford. 235-236 (1999).
7. H. M. Erbary, H. A.Shehata, Ez El, M. A. F. Arab, A. A. Mohamed and M. M. Emara. Thermodynamics of amino acid ionization in aqueous solutions using pH-titration. J. Indian Chem. Soc., 73, 25–29 (1996). 8. K. B. Yatsimirskii and V. P. Vasil'Ev. Instability constants of complex
3.2. Spectral Studies of Cu(II), Ni(II) and Cd(II) Complexes General Behavior of the Complexes
The analytical and physical data along with the molar conductance values of the complexes are summarized in Table 3.2.1. Both the ligands, dabBzGH and aehb form addition complexes with Cu2+, Ni2+ and Cd2+ ions in ethanolic medium. However, Cu(II) complex of aehb could not be isolated and studies on its characterization could not be carried out. Table 3.2.1 indicates that the complexes formed are in the 1:1 metal - ligand stoichiometry which is in conformation with the data obtained from the pH -metric studies. It has been found that the composition of the isolated complexes is independent of the relative ratio of the starting materials taken for the synthesis of the complexes.
All the complexes are colored and stable. They are insoluble in water and common organic solvents but soluble in coordinating solvents such as DMF and DMSO. The melting/decomposing temperature of the complexes taken into capillary tube have been determined on a manually controlled melting point apparatus with the rate of heating fixed at 2°C/min in the transition region and the results are included in Table 3.2.1. The Cd(II) complex of dabBzGH is nonmelting upto 250°C while Cd(II) complex of aehb melts at 250°C while the Cu(II) and Ni(II) complexes decompose at specific temperatures below 250°C. Cu(II) complex of dabBzGH and Cd(II) complex of aehb are non electrolytes while Ni(II) and Cd(II) complexes of dabBzGH and Ni(II) complex of aehb behave as 1:1 electrolytes [1].
Table 3.2.1. Color, Yield, melting point, analytical and molar conductance* data of dabBzGH, aehb and their Ni(II), Cu(II) and Cd(II) complexes.
*Molar conductance in Ω-1cm2mol-1 in DMF. d decomposition temperature Complex Complex No. Color Yield (%) m.pt (°C)
Found (Calcd) (%) Molar
Conduc - tance M Cl C H N N2H4 dabBzGH (L) Light yellow 70 213 - - 66.96 (66.60) 6.20 (6.17) 16.97 (17.28) 9.90 (9.80) - [Cu(L)(OH)2] (I) Red 50 230d 15.21 (15.07) - 50.89 (51.24) 5.32 (5.22) 13.20 (13.28) - - [Ni(L)(H2O)Cl]Cl (II) Green 60 220d 12.70 (12.44) 15.00 (15.05) 45.43 (45.79) 4.25 (4.66) 11.63 (11.87) 6.83 (6.78) 67 [Cd(L)(H2O)Cl]Cl (III) Red 70 >250 20.80 (21.39) 13.42 (13.51) 41.02 (41.11) 4.12 (4.19) 10.42 (10.66) 5.68 (6.09) 66 aehb (L′) White 80 215 - - 66.60 (65.8) 5.89 (5.80) 17.87 (18.06) 10.4 (10.32) - [Ni(L′)(H 2O)Cl]Cl (IV) Green 80 220 d 12.90 (12.82) 14.95 (14.89) 45.01 (44.57) 4.42 (4.37) 12.81 (12.23) 6.89 (6.99) 65 [Cd(L′)Cl2] (V) Cream 80 250 22.71 (22.78) 14.45 (14.39) 41.20 (41.34) 3.71 (3.65) 11.26 (11.35) 6.53 (6.48) 35
Thermal Analysis
TG and DT analysis of Cu(II), Ni(II) and Cd(II) complexes were carried out in the temperature range 40 - 940°C and the thermogravimetric curves are shown in Figure 3.2.1.
Thermogravimetry data reveals that Cu(II), Ni(II) and Cd(II) complexes of dabBzGH decomposed in multiple steps. The weight loss observed for the Cu(II) complex (I) in the temperature range 180 - 465°C corresponds to two coordinated hydroxyl groups and one ligand molecule while those for Ni(II) and Cd(II) complexes (II) and (III), in the temperature range 120 - 220°C correspond to only one coordinated water molecule. Ni(II) complex of dabBzGH (II) suffered a weight loss in the temperature range 267 - 708°C corresponding to elimination of two Cl- ions and one ligand molecule. The second and third decomposition steps of Cd(II) complex (III) occurred in the temperature range 209 - 300°C and 500 - 646°C and the weight loss corresponds to decomposition of two Cl- ions and one ligand molecule, respectively.
The Cd(II) complex of aehb (V) is thermal stable up to 245°C indicating the absence of any lattice/coordinated water molecule. The complex starts decomposing at 250°C and this step continues up to 297°C and the second step starts after 503°C and completes at 744°C. The total weight loss corresponds to the decomposition of two Cl- ions and one ligand molecule.
The residue left after complete decomposition of all the complexes are the stable metal oxides.
Figure 3.2.1. Thermogravimetric curves of (B) complex II; (C) complex (III);
3.2.1. Magnetic Moments and Electronic Spectra
Magnetic measurements and electronic absorption spectroscopy are important in solving the problems of molecular structure of the transition metal complexes. Magnetic measurements can afford a means of detecting the presence of singly
Thermogravimetric curves of the complex: (A) complex I; complex (III); complex IV and (D) complex V.
3.2.1. Magnetic Moments and Electronic Spectra
Magnetic measurements and electronic absorption spectroscopy are important in solving the problems of molecular structure of the transition metal complexes. Magnetic measurements can afford a means of detecting the presence of singly
A
B
C
D
complex I;
Magnetic measurements and electronic absorption spectroscopy are important in solving the problems of molecular structure of the transition metal complexes. Magnetic measurements can afford a means of detecting the presence of singly
occupied electronic orbitals while the molecular absorption in the UV and Visible region is dependent on the electronic structure of the molecule. The effective magnetic moment, ‘µeff’ is calculated from the experimentally determined magnetic susceptibility using the expression:
µeff = 2.83 (χM′T)1/2
where χM′ is the susceptibility per gram mole corrected for diamagnetic effects and T is the absolute temperature.
From the electronic spectra of the complexes under present discussion, only the d-d transitions are taken for discussion and their assignments have been made with the help of Orgel diagram [2] and qualitative term diagrams [3].
The room temperature magnetic moments and the electronic spectra of the Ni(II) and Cu(II) complexes were measured. The µeff values and the electronic absorption bands along with their assignments are collected in Table 3.2.2 while the electronic spectra of the Cu(II) and Ni(II) complexes are shown in Figures 3.2.3 and 3.2.4.
Cu(II) Complex
The µeff value for the red Cu(II) complex of dabBzGH (I) is 2.14 B.M. and is in the range expected for a d9 system (1.8 - 2.2 B.M.). The slightly higher value may be due to the incomplete quenching of the orbital contribution to the magnetic moments [4] or due to spin-orbit coupling [5]. Variable temperature magnetic susceptibility of the complex was measured and the susceptibility vs
and Zero Field Cooled modes, the magnetization values are almost the same in the temperature range 5 - 300 K (- 268 to 27ºC) indicating paramagnetic behavior [6] of the complex.
Figure 3.2.2. Magnetic susceptibility of Cu(II) complex (I) as a function of temperature. T is in absolute scale.
It is observed from the figure that the spin dependence complex I is high below 50 K (- 223ºC) following Curie’s law while it is low above 50 K upto 300 K (27ºC) obeying Pauli paramagnetism.
The electronic spectrum of the complex (II) shows a broad band at 520 nm with a shoulder at 400 nm assignable to the transitions 2B1g → 2B2g (D) and 2B1g → 2A1g (D), respectively for a square planar geometry around Cu2+ ion [3].
0 50 100 150 200 250 300 -0.00010 -0.00005 0.00000 0.00005 0.00010 0.00015
Zero field cool (ZFC)
Field cooled (FC) mode applied field = 500 Oe χχχχ ( e m u /g ) T (K)
Figure 3.2.3. Electronic spectrum of complex I.
A band at 320 nm observed in the electronic spectrum of the complex is attributable to the Cu(II) - OH charge transfer band [7].
Table 3.2.2. µeff values, absorption bands and assigned transitions of the Cu(II) and Ni(II) complexes.
Complex µeff (B.M.) Bands (nm) Assigned transitions
I 2.14 520, 400 2B 1g→ 2 B 2g(D), A1g(D) II 3.78 667 3T 1 (F) → 3 T 1(P) IV 3.65 638 3T 1 (F) → 3 T 1(P)
Ni(II) complexes
Inference with regard to the stereochemistry of the Ni(II) complexes has been drawn from their magnetic moment values and electronic spectral data. The color of the complexes is light green. The µeff values of the Ni(II) complexes (II) and (IV) are 3.78 and 3.65 B.M., respectively, which fall in the range reported for tetrahedral Ni(II) complexes [3]. A tetrahedral coordination around the Ni2+ ion complex is also suggested by the electronic absorption spectra. The electronic spectra of complexes (II) and (IV) show a strong band each at 667 nm and 638 nm assignable to the transitions 3T1 (F) → 3T1 (P) for a Ni(II) tetrahedral geometry [3].
Figure 3.2.4. Electronic spectra of Ni(II) complexes (A) complex II and (B)
complex IV.
3.2.2. Infrared Spectra
The infrared spectrum of a free ligand is characteristic of the entire molecule. When the ligand is coordinated, at least one additional atom - the atom to which the ligand coordinates, is introduced into the ligand’s vibrating system, and bond
B
lengths, bond angles and interatomic force constants within the ligand would be expected to alter slightly. Similarly, there will be changes in the vibrations of the system to which the ligand becomes attached. This would mean that the infrared spectrum of a coordinated ligand differs from that of the free ligand and it should be possible to correlate the changes observed in the spectra with the changes in bonding. Thus, information regarding the bonding nature of a ligand in a particular complex may be obtained and the structure of the complex may then be deduced.
The coordinate bond stretching vibrations such as metal - nitrogen and metal - oxygen stretching modes, which appear in the low frequency region, are more sensitive to the nature of the metal than the ligand vibrations in the high frequency region. However, these low frequency bands can only be assigned by carrying out a normal coordinate analysis of the whole chelate ring.
The bonding sites of the ligands, dabBzGH and aehb involved in coordination with the metal ions have been determined by a careful comparison of the IR spectra of the complexes with the spectrum of the particular ligand. As the IR spectrum of the ligand is highly complicated, only those bands diagnostic of coordination with the metal ions have been presented in each case and discussed.
Complexes of dabBzGH
The infrared spectral data of the pertinent peaks of dabBzGH and its Ni(II), Cu(II) and Cd(II) complexes are tabulated (Table 3.2.3) along with the assignments while the corresponding spectra are given in Figure 3.2.5. The
bonding sites of the ligand have been assigned by a careful comparison of IR spectra of the complexes with that of the ligand. The solid state IR spectrum of dabBzGH shows bands at 1676, 1554 and 1371, and 1637, 1529 and 1313 cm-1 which may be assigned to amide I, II and III modes of the hydrazidic and benzamide moieties and the bands at 1614 and 952 cm-1 are, respectively, assigned to CN and NN stretching modes. Broad bands at ~3350 cm-1 observed in the spectra of complexes II and III are due to ν(OH) [8]. In the spectra of the complexes, the amide bands of the benzamide group remain almost unaltered showing non-involvement of the group in bonding. However, the corresponding amide bands of the hydrazidic moiety show bathochromic shift for the amide I (23 - 31 cm-1) and amide II (19 - 31 cm-1) bands and hypsochromic shift (5 – 40 cm-1) for the amide III band in the spectra of the complexes indicating participation of the hydrazidic >CO group in complexation [8]. Coordination through the azomethine nitrogen [9] has been inferred from the observed bathochromic shift (14-38 cm-1) in ν(CN) and hypsochromic shift (14 - 42 cm-1) in the ν(NN) bands in the spectra of the complexes. The appearance of a new band at 1076 cm-1 in the spectrum of the Cu(II) complex (I), attributable to the MOH bending, suggests formation of a Cu-OH bond [8]. The non-ligand bands appearing in the 435 - 443 cm-1 and 518 – 574 cm-1 region in the spectra of the complexes are assignable to the ν(MN) and ν(MO) modes respectively, showing that the carbonyl oxygen and azomethine nitrogen have formed coordinate bonds with the metal ions.