Scholars' Mine
Scholars' Mine
Masters Theses Student Theses and Dissertations
Spring 2016
Behavior of ultra-high performance concrete bridge deck panels
Behavior of ultra-high performance concrete bridge deck panels
compared to conventional stay-in-place deck panels
compared to conventional stay-in-place deck panels
Valter Gora VenancioFollow this and additional works at: https://scholarsmine.mst.edu/masters_theses
Part of the Civil Engineering Commons Department:
Department:
Recommended Citation Recommended Citation
Gora Venancio, Valter, "Behavior of ultra-high performance concrete bridge deck panels compared to conventional stay-in-place deck panels" (2016). Masters Theses. 7504.
https://scholarsmine.mst.edu/masters_theses/7504
This thesis is brought to you by Scholars' Mine, a service of the Missouri S&T Library and Learning Resources. This work is protected by U. S. Copyright Law. Unauthorized use including reproduction for redistribution requires the permission of the copyright holder. For more information, please contact [email protected].
BEHAVIOR OF ULTRA-HIGH PERFORMANCE CONCRETE BRIDGE DECK PANELS COMPARED TO CONVENTIONAL STAY-IN-PLACE DECK PANELS
by
VALTER GORA VENANCIO A THESIS
Presented to the Faculty of the Graduate School of the MISSOURI UNIVERSITY OF SCIENCE AND TECHNOLOGY
In Partial Fulfillment of the Requirements for the Degree MASTER OF SCIENCE IN CIVIL ENGINEERING
2016 Approved by: John J. Myers, Advisor
Lesley H. Sneed Kamal H. Khayat
©2016
Valter Gora Venancio All Rights Reserved
ABSTRACT
The remarkable features of ultra-high performance concrete (UHPC) have been reported. Its application in bridge construction has been an active research area in recent years, attributed to its higher compressive strength, higher ductility and reduced
permeability when compared with conventional concrete and even high-strength
concrete. Those characteristics are known to increase bridge durability and, consequently, decrease life-cycle maintenance costs.
With that in mind, this study investigated the performance of UHPC stay-in-place (SIP) bridge deck panels subjected to high loads in both flexure and shear. The test matrix consisted of twelve (12) half-scale panels that were 4 feet long and 2 feet wide. The variable parameters that were studied included thickness (i.e., 2-in. and 3-in.) as well as non-discrete reinforcement type, including conventional mild reinforcement, welded wire mesh and no reinforcement (UHPC only). Control deck panels with conventional concrete (CC) were fabricated and tested to serve as a baseline for comparison. The results indicated that the UHPC panels had an improved performance compared to the conventional concrete panels. With respect to the panels tested in high shear loads, only the CC panel test resulted in a diagonal tension failure mode (i.e. traditional shear type failure). All of the other UHPC panels failed in flexure suggesting that the UHPC provided a high shear capacity. The results also showed a good correlation with selected empirical models.
A cost study was also investigated. It was concluded that, even with the high difference between the prices per cubic yard of both concretes, the difference can be significantly lower when compared with the prices per ultimate load capacity.
iv
ACKNOWLEDGMENTS
First, I would like to thank my advisor Dr. Myers for his guidance through my research. Coming from a country that English is not a native language brought to me many challenges, and without his patience and support I could not finish this study. Also I would like to thank my committee members, Dr. Khayat and Dr. Sneed, for being part of my positive experience in this research.
Second, I appreciate the financial support from the CAPES Foundation, Ministry of Education of Brazil, who sponsored my Master’s degree at Missouri S&T. Without this initiative I would not even dream to study there.
I would like also thank the RE-CAST program for funding this research, and the materials donations through the companies BASF, Illinois Cement Company and Rolla Ready Mix.
Also I would like to thank lab technicians at Missouri S&T including John Bullock, Gary Abbott, Brian Swift and Greg Leckrone for helping me with all the hard work at the lab. In addition, I would like to thank my fellow graduate students in special to Saipavan Rallabhandhi, Hayder Alghazali, Zeina Aljazaeri, Zuhair Aljaberi, Eli Hernandez, Ahmed Gheni and Wei Wang for all the support and guidance. Without their help I could not have done many things I did in my research.
Finally, I would like to thank my family and my girlfriend Clara who have
encouraged me to come to USA have and chase my dreams. They are the cornerstones of my life. Thank you all!
TABLE OF CONTENTS
Page
ABSTRACT ... iii
ACKNOWLEDGMENTS ... iv
LIST OF ILLUSTRATIONS ... viii
LIST OF TABLES ... xii
NOMENCLATURE ... xiii SECTION 1. INTRODUCTION ... 1 1.1. BACKGROUND ... 1 1.2. OBJECTIVES ... 1 1.3. ORGANIZATION OF REPORT ... 1 2. LITERATURE REVIEW ... 3
2.1. ULTRA-HIGH PERFORMANCE CONCRETE ... 3
2.1.1. Definition ... 3
2.1.2. Typical UHPC Material Constitution ... 3
2.1.3. Typical Mechanical Properties ... 3
2.1.4. Batching and Casting ... 4
2.1.5. Curing Methods ... 5
2.1.6. Behavior in Flexural and Shear Loads ... 5
2.2. EMPIRICAL MODELS... 6
2.2.1. Moment Capacity in Conventional Concrete ... 6
2.2.2. Moment Capacity in UHPC ... 6
2.2.3. Shear Capacity in Conventional Concrete ... 8
2.2.4. Shear Capacity in UHPC ... 8
2.3. BRIDGE DECK PANELS ... 11
2.3.1. Stay-In-Place Formwork for Bridge Deck ... 11
2.3.2. Full-Depth Precast Panel Systems ... 12
2.3.3. UHPC Bridge Deck Panels ... 14
vi
4. MIX DESIGN ... 22
4.1. CONVENTIONAL CONCRETE MIX DESIGN ... 22
4.2. UHPC MIX DESIGN ... 22
4.3. MATERIALS ... 22
4.3.1. Portland Cement ... 22
4.3.2. Crushed Stone ... 23
4.3.3. River Sand ... 24
4.3.4. Masonry Sand ... 24
4.3.5. Ground-granulated Blast-furnace Slag ... 24
4.3.6. Silica Fume ... 26
4.3.7. Superplasticizer ... 26
4.3.8. Steel Fibers ... 26
5. EXPERIMENTAL PROGRAM ... 28
5.1. CONVENTIONAL CONCRETE MECHANICAL PROPERTIES ... 28
5.1.1. Compressive Strength ... 29
5.1.2. Modulus of Elasticity ... 29
5.2. UHPC MECHANICAL PROPERTIES ... 30
5.2.1. Compressive Strength ... 30
5.2.2. Modulus of Elasticity ... 31
5.2.3. Splitting Tensile Strength ... 33
5.3. STEEL REINFORCEMENT MECHANICAL PROPERTIES ... 33
5.4. PANELS DEVELOPMENT ... 34
5.4.1. Panel Formwork ... 34
5.4.2. Panel Reinforcement ... 35
5.4.3. Conventional Concrete Panel Casting and Curing ... 36
5.4.4. UHPC Panel Casting and Curing ... 38
5.5. TEST SETUP AND DATA ACQUISITION ... 42
6. RESULTS AND DISCUSSION ... 48
6.1. FLEXURE TESTING RESULTS... 48
6.1.1. Panel FCC3 Testing Procedure ... 48
6.1.3. Panel FUC3 Testing Procedure. ... 52
6.1.4. Panel FUW3 Testing Procedure ... 54
6.1.5. Panel FUN3 Testing Procedure ... 58
6.1.6. Panel FUW2 Testing Procedure ... 59
6.1.7. Panel FUN2 Testing Procedure ... 61
6.1.8. Flexure Panels Tests Results Discussion ... 61
6.2. SHEAR TESTING RESULTS ... 68
6.2.1. Panel SCC3 Testing Procedure ... 68
6.2.2. Panel SUC3 Testing Procedure ... 68
6.2.3. Panel SUN3 Testing Procedure ... 72
6.2.4. Panel SUC2 Testing Procedure ... 72
6.2.5. Panel SUN2 Testing Procedure ... 78
6.2.6. Shear Panels Tests Results Discussion ... 81
7. COST STUDY ... 85
8. CONCLUSION ... 90
APPENDIX ... 92
BIBLIOGRAPHY ... 97
viii
LIST OF ILLUSTRATIONS
Page
Figure 2.1. Schematic representations of strain and stress distributions (JSCE, 2008) ... 7
Figure 2.2. Stay-in-place formwork on a steel girder layout (Chavel, 2012) ... 12
Figure 2.3. Typical square SIP panel detailing (MoDOT, 2016)... 13
Figure 2.4 Typical panel-concrete girder joint detailing (MoDOT, 2016) ... 13
Figure 2.5. Bridge deck being constructed with full-depth precast concrete deck panels (Chavel, 2012) ... 14
Figure 2.6. Test setup (Naaman & Chandrangsu, 2004)... 15
Figure 2.7. Test results (Naaman & Chandrangsu, 2004)... 15
Figure 2.8. Dahlonega Road Bridge (Aaleti et al., 2015) ... 17
Figure 2.9. 3-D perspective of the proposed deck system (Ghasemi et al., 2016) ... 17
Figure 2.10. Test procedure (Ghasemi et al., 2016) ... 18
Figure 2.11. Test setup (Harris & Roberts-Wollmann, 2008) ... 18
Figure 2.12. Typical cracking pattern on bottom surface of the panels (Harris & Roberts-Wollmann, 2008)... 19
Figure 3.1. Specimen designation ... 20
Figure 4.1. Crushed stone ... 23
Figure 4.2. Gradation of the aggregates used ... 25
Figure 4.3. Ground-granulated blast-furnace slag ... 25
Figure 4.4. Silica fume ... 26
Figure 4.5. Gradation of the cementitious materials used ... 27
Figure 4.6. Steel fibers ... 27
Figure 5.1. Tinius Olsen machine ... 28
Figure 5.2. Cylinder mold for 4-in. x 8-in. (101.6 mm x 203.2 mm) cylinders... 29
Figure 5.3. Molds for 2-in. (50 mm) cubes ... 30
Figure 5.4. UHPC compressive strength setup ... 31
Figure 5.5. Split tensile strength test setup ... 33
Figure 5.6 Cross-section of the panels with reinforcement ... 37
Figure 5.7. Conventional concrete mixer ... 38
Figure 5.9. UHPC batching ... 40
Figure 5.10. Wet burlap on top of concrete surface ... 42
Figure 5.11. Plastic sheet on top of burlap ... 42
Figure 5.12. Test setup for flexure panels... 44
Figure 5.13. Test setup for shear panels ... 44
Figure 5.14. Strain gauge setup for panels FCC3 and FUC3... 45
Figure 5.15. Strain gauge setup for panels FCW3, FUW3 and FUW2 ... 46
Figure 5.16. Strain gauge setup for panels FUN3 and FUN2 ... 46
Figure 5.17. Strain gauge setup for panels SCC3, SUC3 and SUC2 ... 47
Figure 5.18. Strain gauge setup for panels SUN3 and SUN2 ... 47
Figure 6.1. Concrete crushed on compression zone on panel FCC3 ... 48
Figure 6.2. Crack pattern formation at the tension face of panel FCC3 ... 49
Figure 6.3. Load versus displacement for panel FCC3 ... 49
Figure 6.4. Load versus strain for panel FCC3 ... 50
Figure 6.5. Panel FCW3 split after failure ... 51
Figure 6.6. Load versus displacement for panel FCW3 ... 51
Figure 6.7. Load versus strain for panel FCW3 ... 52
Figure 6.8. Panel FUC3 test setup ... 52
Figure 6.9. Panel FUC3 after failure ... 53
Figure 6.10. Tensile crack on panel FUC3 ... 53
Figure 6.11. Crack pattern formation at the tension face of panel FUC3 ... 54
Figure 6.12. Load versus displacement for panel FUC3 ... 54
Figure 6.13. Load versus strain for panel FUC3 ... 55
Figure 6.14. Tensile crack on panel FUW3 ... 55
Figure 6.15. Panel FUW3 test setup ... 56
Figure 6.16. Crack pattern formation at the tension face of panel FUW3 ... 56
Figure 6.17. Load versus displacement for panel FUW3 ... 57
Figure 6.18. Load versus strain for panel FUW3... 57
Figure 6.19. Panel FUN3 test setup ... 58
Figure 6.20. Crack pattern formation at the tension face of panel FUN3 ... 59
x
Figure 6.22. Crack pattern formation at the tension face of panel FUW2 ... 60
Figure 6.23. Load versus displacement for panel FUW2 ... 60
Figure 6.24. Load versus strain for panel FUW2... 61
Figure 6.25. Panel FUN2 test setup ... 62
Figure 6.26. Tensile crack on panel FUN2 ... 62
Figure 6.27. Crack pattern formation at the tension face of panel FUN2 ... 63
Figure 6.28. Crack widths of panel FUN2 ... 63
Figure 6.29. Load versus displacement for panel FUN2 ... 64
Figure 6.30. Load versus strain for panel FUN2 ... 64
Figure 6.31. Load versus displacement plot from flexure panels ... 65
Figure 6.32. Comparison between experimental and empirical models for flexure panel sections ... 66
Figure 6.33. Empirical versus ACI 318-11 moment values for flexure panels ... 67
Figure 6.34. Empirical versus ACI 544.4R-88 moment values for flexure panels ... 67
Figure 6.35. Diagonal tension failure on panel SCC3 ... 68
Figure 6.36. Load versus displacement for panel SCC3 ... 69
Figure 6.37. Load versus strain for panel SCC3 ... 69
Figure 6.38. Panel SUC3 test setup ... 70
Figure 6.39. Tensile crack on panel SUC3 ... 70
Figure 6.40. Crack pattern formation at the tension face of panel SUC3 ... 71
Figure 6.41. Load versus displacement for panel SUC3 ... 71
Figure 6.42. Load versus strain for panel SUC3 ... 72
Figure 6.43. Panel SUN3 test setup ... 73
Figure 6.44. Tensile crack on panel SUN3 ... 73
Figure 6.45. Crack pattern formation at the tension face of panel SUN3 ... 74
Figure 6.46. Load versus deflection for panel SUN3 ... 74
Figure 6.47. Load versus strain for panel SUN3 ... 75
Figure 6.48. Panel SUC2 test setup ... 75
Figure 6.49. Tensile crack on panel SUC2 ... 76
Figure 6.50. Crack pattern formation at the tension face of panel SUC2 ... 76
Figure 6.52. Load versus displacement for panel SUC2 ... 77
Figure 6.53. Load versus strain for panel SUC2 ... 78
Figure 6.54. Panel SUN2 test setup ... 79
Figure 6.55. Tensile crack on panel SUN2 ... 79
Figure 6.56. Crack pattern formation at the tension face of panel SUN2 ... 80
Figure 6.57. Load versus displacement for panel SUN2 ... 80
Figure 6.58. Load versus strain for panel SUN2 ... 81
Figure 6.59. Load versus displacement plot from shear panels ... 82
Figure 6.60. Comparison between experimental and empirical models for shear panel sections ... 84
Figure 7.1. Price per kip load comparison between flexure panels ... 87
xii
LIST OF TABLES
Page
Table 2.1. Typical UHPC mix composition (Graybeal, 2006) ... 4
Table 2.2. Mechanical properties of Ductal® (Ductal®, 2016) ... 4
Table 3.1. Test matrix ... 21
Table 4.1. Conventional concrete mix design ... 22
Table 4.2. UHPC mix design ... 23
Table 4.3. Material properties of crushed stone ... 24
Table 4.4. Material properties of river sand ... 24
Table 4.5. Material properties of masonry sand ... 24
Table 4.6. Steel fiber properties ... 27
Table 5.1. UHPC compressive strength summary ... 32
Table 5.2. UHPC modulus of elasticity summary ... 32
Table 5.3. UHPC Split tensile strength summary ... 33
Table 5.4. Steel reinforcement strength summary ... 34
Table 5.5. Specimen reinforcement setup ... 36
Table 5.6. Superplasticizer added beyond mix design ... 41
Table 6.1. Comparison between experimental and empirical values for flexure panel sections ... 66
Table 6.2. Comparison between experimental and empirical values for shear panel a sections ... 83
Table 7.1. UHPC material price ... 85
Table 7.2. UHPC material price per yd3 ... 86
Table 7.3. Price per kip load ... 87 34
NOMENCLATURE
Symbol Description
a = depth of equivalent rectangular stress block av = shear span
As = area of longitudinal reinforcement b = width of the member
d = distance from extreme compression member to centroid of tension reinforcement
df = fiber diameter Df = bond factor
e = distance from extreme compression fiber to top of tensile stress block of fibrous concrete
ef = tensile strain in steel at theoretical moment strength of the element f’c = compressive strength of concrete
fsp = split tensile strength
fy = yield strength of steel reinforcement F = fiber factor
Fbe = bond efficiency of the fiber h = total depth of the member lf = fiber length
Mn = nominal moment capacity
Vc = predicted shear strength of the element
z = location from compressive stress resultant to centroid of tension reinforcement
λ = modification factor for concrete ρf = percent by volume of steel fibers σt = tensile stress in fibrous concrete τ = fiber matrix interfacial bond strength
1. INTRODUCTION 1.1. BACKGROUND
The maintenance of bridges in the US, especially in high demand durability elements such as bridge decks, utilizes an important portion of this nations available maintenance funds. One of the main reasons for high maintenance in a bridge deck is the corrosion of deck steel caused by the application of deicing salts where chlorides
penetrate into the concrete and attack reinforcing steel.
One way to help improve a bridge’s life span may be the use of ultra-high performance concrete (UHPC). This type of concrete has great properties to overcome those issues such as high tensile strength, high binder content, and crack-free properties with the encashment of fibers.
The application of UHPC concrete in bridge construction has already been investigated in Canada, Europe and Japan. In the US, the Federal Highway
Administration (FHWA) began the evaluation of UHPC for highway infrastructure in 2001. Most of the applications were in joints, full-depth deck panels, and girders (Russell & Greybeal, 2013). Little research has been conducted on stay-in-place forms made of UHPC.
1.2. OBJECTIVES
The purpose of this study was to evaluate the behavior of UHPC panels as either stay-in-place forms for partial-depth concrete decks or even perhaps as a full-depth precast deck system in high flexure and shear load configurations when compared to conventional stay-in-place concrete panels, and compare their capacity to results obtained from empirical models. This research was also conducted to compare the costs between these two types of concrete.
1.3. ORGANIZATION OF REPORT
This report is organized in eight sections. The first two sections give an
introduction to the research and to the literature used as the cornerstone of this study. The third section provides a discussion of the scope of the work that was done. The fourth
section contains an explanation of the mix designs used and their related material. The fifth section provides a discussion of the methods used in the experimental program, while the sixth section contains the test results and a discussion of the findings. The seventh section shows the results from the cost study that was developed. The eighth and last section gives the conclusions from the research, followed by recommendations for future investigation. Each section is laid out by topics in the same order.
3
2. LITERATURE REVIEW 2.1. ULTRA-HIGH PERFORMANCE CONCRETE
2.1.1. Definition. ACI 239 committee defines Ultra-high Performance Concrete (UHPC) as “concrete that has a minimum specified compressive strength of 150 MPa (22,000 psi) with specified durability, tensile ductility and toughness requirements; fibers are generally included to achieve specified requirements”.
Also, most literature agrees that the best definition for UHPC is as follows (Toutlemonde & Resplendino, 2011):
Compressive strength greater than 21.7 ksi (150 MPa).
Fiber reinforcement (typically steel) to achieve non-brittle behavior and possibly overcome the use of passive reinforcement.
High binder content that reduces capillary porosity.
Tensile matrix strength greater than 1 ksi (7 MPa).
Low water content.
Along those lines, the Japan Society of Civil Engineers (JSCE) (2008) defines UHPC as a composite material comprised of cement-based matrix and short reinforcing fibers that is highly ductile and exhibits multiple fine cracks and pseudo stain-hardening characteristics under uniaxial load.
2.1.2. Typical UHPC Material Constitution. There are several UHPC
commercial mix designs available the on market including Ductal®, by LaFarge, Densit, and Hi-Con, to name some. The formulations usually consist of a combination of
Portland cement, sand, silica fume, high-range water-reducing admixture, fibers (usually steel) and water (Russell & Graybeal, 2013). Graybeal (2006) defines a typical UHPC mix composition as the one described in Table 2.1.
2.1.3. Typical Mechanical Properties. Each mix design produces different mechanical properties. For benchmark purposes, the properties specified by Ductal® mix are specified in this thesis as shown on Table 2.2:
Table 2.1. Typical UHPC mix composition (Graybeal, 2006)
Material Amount [lb./yd3 (kg/m3)] Percentage by weight Portland cement 1,200 (712) 28.5 Fine sand 1,720 (1020) 40.8 Silica fume 390 (231) 9.3 Ground quartz 355 (211) 8.4 Superplasticizer 51.8 (30.7) 1.2 Accelerator 50.5 (30) 1.2 Steel fibers 263 (156) 6.2 Water 184 (109) 4.4
Table 2.2. Mechanical properties of Ductal® (Ductal®, 2016)
With thermal treatment
Without thermal treatment
Density [lb./yd3 (kg/m3)] 4,225 (2,500) Compressive strength [psi (MPa)] 21,750 – 29,000
(150 – 200)
21,750 – 26,100 (150 – 180) Flexural strength [psi (MPa)] 2,900 – 5,800 (20 – 40) 2,175 – 4,350 (15 – 30) Modulus of elasticity [ksi (GPa)] 6,525 – 7,975 (45 – 55)
Shrinkage (microstrain) 0.6 – 0.8
Creep 0.2 – 0.4 0.2 – 0.4
2.1.4. Batching and Casting. UHPC requires a higher energy input than conventional concrete during the batching. This fact combined with the lack of coarse aggregate and the lower water-cement ratio require different procedures to ensure that the UHPC will not overheat during batching. One way to address that issue is to use high-shear mixers. Another way is to partially or fully replace the water with ice to lower the
5 batching temperature. The mixing time usually ranges from 7 to 18 minutes (Russell & Graybeal, 2013).
The way that UHPC is placed can influence its fiber orientation and,
consequently, the element mechanical properties. Kim et al. (2008) reported that higher ultimate strengths were achieved when the concrete castings were made in the direction of the load in the bending test. Stiel et al. (2004) found that beams have better flexural strengths when casted horizontally, when the fibers would be aligned with the tensile strength, instead of vertically.
Graybeal (2011) pointed out that it internal vibration in UHPC is not
recommended due to the fibers, but external vibration is recommended so any entrapped air can be released.
2.1.5. Curing Methods. The curing process that is used in UHPC can
significantly affect the final properties of the concrete product. LaFarge recommended that Ductal® should be cured in a steam regime for 48 hours at a temperature of 194 °F (90 °C) and 95% relative humidity before de-molding occurs. Graybeal (2006) tested UHPC cylinders in several types of steam curing and with no steam treatment. Untreated UHPC had a significantly lower compressive strength compared to the ones that were steam treated.
2.1.6. Behavior in Flexural and Shear Loads. Extensive research was already made on UHPC nonprestressed beams and prestressed girders. Graybeal (2006) tested a 36-in. (0.91 m) deep AASHTO Type II prestressed girder made of UHPC in flexure using four-point load. It failed by a combination of fiber pullouts and tensile fracture of the strands with considerable deflection. Using the data of this test it was possible to conclude that the flexural strength capacity of the section could be calculated using traditional mechanical of materials approach.
Meade and Graybeal (2010) tested the sixteen 6-in. (152 mm) by 15-in. (381 mm) rectangular UHPC beams reinforced with mild steel. The variable parameters were fiber content and reinforcement ratio. The results showed that the beams with fibers had higher first crack strength and higher peak loads compared to the ones without fibers.
Aaleti et al. (2011) tested three 33-in. (838 mm) deep pi-girders under low shear span, three-point load bending. Although all three girders showed shear cracks, only one of them failed in flexure rather than loss of diagonal tensile capacity in the web.
Harris and Roberts-Wollmann (2008) tested twelve square 45-in. (1,140 mm) UHPC slabs with no reinforcement expect for the fiber under punching shear. The variable parameters were slab thickness and load plate dimensions. Seven of the
specimen failed in punching shear, while five of them failed in flexure. It was concluded that 1-in. (25.4 mm) slab thickness is enough to provide punching shear capacity for bridge deck applications.
2.2. EMPIRICAL MODELS
2.2.1. Moment Capacity in Conventional Concrete. The moment section capacity on flexural elements can be calculated using the ACI 318-11 method. This method is based on the condition of equilibrium and compatibility of forces and strains. A rectangular stress block in the compression zone is used for simplification and the maximum compressive strain that can be used is 0.003. The tensile strength of the concrete is neglected. The equation for a singly tension reinforced member is as follows:
= − 2 (1)
2.2.2. Moment Capacity in UHPC. It is already known that the steel fibers in UHPC can bridge cracks, increasing the structure ductility and moment capacity. Extensive research has been done on nonprestressed beams and prestressed girders (Russell & Graybeal, 2013). Still, at the structural level, there is little research available about the flexural behavior and deflection of UHPC slabs.
Considerably more data is available for steel fiber reinforced concrete (SFRC), which has a similar behavior. ACI 544.4R-88 states that SFRC beams with longitudinal reinforcement should be designed using the method developed by Henager and Doherty (1976) for predicting flexural strength. This method is similar to the ACI 318-11 ultimate strength design method: the tensile strength computed for the fibrous concrete is added to
7 that contributed by the reinforcing bars to obtain the ultimate moment. The equation is as follows:
= − 2 + (ℎ − ) ℎ2 + 2 − 2 (2)
where:
= + 0.003 (3)
= 1.12 (inch/ pound units, psi) (4)
Similar to ACI 544.4R-88, JSCE (2008) takes into account the contribution of the tensile stress of the UHPC. The fiber strain is proportional to the distance from the neutral axis. Figure 2.1 illustrates the concept.
For UHPC structures without steel reinforcement there is little research data. ACI 544.4R-88 indicates the equations developed by Swaymy et al. (1974), but it alerts that those equations are applicable only to small, laboratory sized beams, and the designer should not attempt extrapolation to different structures outside the normal range of the data used in the regression analysis and in the equations development.
Figure 2.1. Schematic representations of strain and stress distributions (JSCE, 2008)
c d
2.2.3. Shear Capacity in Conventional Concrete. The shear capacity of
concrete panels can be calculated using the ACI 318-11 method equation. It involves the contribution to shear resistance from concrete and transverse or shear reinforcement. The concrete contribution can be calculated using the following equation, in United States customary units:
= 2 (5)
where λ = 1 for normal weight concrete.
2.2.4. Shear Capacity in UHPC. The behavior of the UHPC members in shear is improved because of the high compressive strength and the use of fibers. This was stated in various studies conducted on prestressed girders and beams without stirrups.
When it comes to SFRC, extensive research has already been conducted on shear behavior. According to ACI 544.4R-88, it is known that there are several advantages in using steel fibers as supplement or replacement of stirrups for increasing shear capacity, like the following:
Because of the random distribution of the fibers, they happen to be spaced much closer than what can be achieved with conventional stirrups;
The ultimate tensile strength and the first crack tensile strength are increased with the use of fibers.
The shear friction in the structure is increased.
The ACI 544.4R-88 committee recommends the equation proposed by Sharma (1986), who tested FRC beams with and without stirrups. Based on the results and collected data from other studies, the researcher developed an equation to predict the shear strength. Although Shahnewaz et al. (2014) pointed out that the equation ignored some important parameters that contribute to shear strength, such as fiber volume, fiber aspect ratio and tensile reinforcement, it was considered in this present research as it was one of the ones chosen by ACI 544.4R-88. The equation is as follows, in United States customary units:
9
=23 × × . × × (6)
Narayanan and Darwish (1987) tested 33 steel fiber reinforced concrete beams by varying the volume fraction of the fibers, fiber aspect ratio, concrete strength,
longitudinal reinforcement ratio and shear span-depth ratio. Equations were suggested to predict failure for different shear span-depth ratio based on the results. For an element of a/d > 2.8, the equation is, in metric units:
= 0.24
20 − √ + 0.7 + √ + 80 + 0.41 (7)
where τ = 4.15 MPa and F is the fiber factor proposed originally by Narayanan and Darwish (1987) and is calculated using the following equation, in metric units:
= (8)
where Df is 0.5 for plain fibers.
Ashour et al. (1992) studied several high-strength fiber reinforced beams without stirrups that were subjected to combined flexure and shear. The authors varied the steel fiber content, longitudinal steel ration and shear-span to depth ratio. The results were used to propose an empirical equation, which is as follows, in metric units:
= 0.7 + 7 + 17.2 (9)
Shin et al. (1994) investigated the behavior of high-strength concrete beams with and without steel fibers. The parameters that were varied were the volumetric ratio of steel fibers, shear span-depth ratio, longitudinal reinforcement, and shear reinforcement.
The authors came up with an empirical for the concrete shear strength after analyzing the results, in metric units:
= 0.19 + 93 + 0.834(0.41 ) (10)
Khuntia et al. (1999) proposed shear equations for high-strength fiber reinforced concrete beams based on previously published experimental data. The equation for low shear span-depth ratio elements is, in metric units:
= (0.167 + 0.25 ) (11)
Kwak et al. (2002) conducted a test on fiber reinforced beams with different steel fiber volume fractions, shear span-depth ratios, and concrete compressive strength. These results along with the results of the other tested beams were compiled to develop an empirical equation for shear capacity, in metric units:
= 3.7
20 − √ + 0.7 + √ + 0.8(0.41 ) (12)
For UHPC, JSCE (2008) addressed recommendations for shear design. They stated that the shear capacity of a UHPC beam is the sum of the capacity exerted by the concrete matrix, the fibers and the steel reinforcement. The equation is below, in metric units:
= + (13)
where:
11
= 1 < 1.5 (15)
= 100 < 1.5 (16)
= 0.7 × 0.20 ≤ 50 (17)
= (18)
For UHPC structures without stirrups and longitudinal reinforcement there is little research data.
2.3. BRIDGE DECK PANELS
2.3.1. Stay-In-Place Formwork for Bridge Deck. Stay-in-place (SIP) formwork (also known as partial-depth concrete deck panel) has been used in many US states in recent years. Around 85 percent of all bridges built in Texas used this kind of method in their construction (Merrill, 2002). It is usually fabricated in a precast plant where
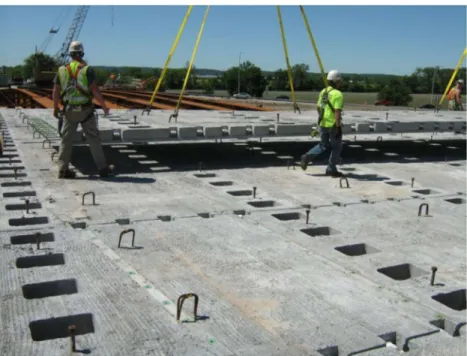
conditions for casting and curing are controlled. It consists of a concrete panel that spans between girders and simultaneously acts as form and as positive reinforcement for the cast-in-place deck. The negative reinforcement is placed on top of the panels before the casting of the cast-in-place concrete. There is no connection between panels at the girder, but the cast-in-place concrete is cast at that region to give composite action between it and the panels. The panel surface is also intentionally roughened for composite action. When supported by steel girders, shear studs are used as showed in Figure 2.2 (Chavel, 2012). Because of this isostatic setup, it is important to protect the positive reinforcement from corrosion.
Figure 2.2. Stay-in-place formwork on a steel girder layout (Chavel, 2012)
MoDOT guidelines for SIP panels are 3-in. (76.2 mm) thick prestressed concrete panels toppled by a 5.5-in. (139.7 mm) cast-in-place concrete, and this applies to nearly all types of girders. Figure 2.3 shows a typical square SIP panel detailing while Figure 2.4 shows the panel-concrete girder joint detailing. There is no information regarding MoDOT’s nonprestressed SIP panels.
2.3.2. Full-Depth Precast Panel Systems. Full-depth precast panel systems are another alternative for cast-in-place concrete decks. They can be used in new bridge construction (as shown in Figure 2.5) and in the substitution of deteriorated cast-in-place decks, and they are also made in a precasting plant. The total thickness is usually 8-in. (203.2 mm). The panels typically span the whole width of the bridges and can use either mild steel or pretension in the transverse direction. Some applications use post-tension in longitudinal reinforcement which puts the joints in compression to improve durability and to give a monolithic behavior (Hieber et al., 2005).
Another application for full-depth precast panels is on buildings such as parking garages. In those cases what is typically used is a precast, prestressed concrete “double T”, which is 2 beams and a slab linked monolithically.
13
Figure 2.3. Typical square SIP panel detailing (MoDOT, 2016) Conversion: 1 in. = 25.4 mm
Figure 2.4 Typical panel-concrete girder joint detailing (MoDOT, 2016) Conversion: 1 in. = 25.4 mm
Figure 2.5. Bridge deck being constructed with full-depth precast concrete deck panels (Chavel, 2012)
2.3.3. UHPC Bridge Deck Panels. Several studies have been developed on bridge deck panels made of UHPC with promising results. Naaman and Chandrangsu (2004) studied a two-span deck system that did not use any reinforcing bars on the top surface to resist the negative moments. It also did not use any shrinkage and temperature reinforcement. Instead, it counted only on the tensile strength of UHPC to balance part of the negative moment and to allow the development of a plastic hinge the middle support. Figure 2.6 illustrates and shows the test setup. The variable parameters were the
reinforcement type (mild steel, prestressed steel strands, carbon bars and carbon prestressed strands), fiber type and fiber parameters. The control panel was made of conventional concrete and two layers of mild steel. As can be seen on Figure 2.7, the results showed that the prestressed panels had higher ultimate capacity and less cracks than the control panel. Also, the nonprestressed panels showed lower ultimate capacity but higher ductility.
15
Figure 2.6. Test setup (Naaman & Chandrangsu, 2004)
Aaleti et al. (2015) evaluated the performance of a full-depth prefabricated UHPC waffle deck that was constructed for the Dahlonega Road Bridge, located in Wapello County, Iowa. The panels were 16-ft.-2.5-in. (5.5 m) wide and 8-ft. (2.44 m) long, as can be seen on Figure 2.8 and used nonprestressed steel as reinforcement. They were
connected along the bridge length by field-cast UHPC joints. Strain transducers were placed on high positive and negative moments and potentiometers were positioned on the girders to monitor the global behavior of the bridge. The load was applied by a loaded dump truck that was drove across the bridge. Dynamic amplification effects were also quantified. With the data obtained it was possible to conclude that the overall
performance could be considerable acceptable as no strain gauges registered strains close to ultimate when the live load was applied.
Ghasemi et al. (2016) studied the behavior of a lightweight UHPC deck panel reinforced with high-strength steel for movable bridges application. The variables parameters were overall depth, rib spacing and slab thickness. Figures 2.9 illustrates the deck system proposed. The panels were single span and single loaded through a 10-in. x 20-in. (254 mm x 508 mm) steel plate so it could simulate a dual tire wheel load of an HS20 truck. The failure mode for most of the panels were by shear cracks near the supports on the webs, as it can be seen on Figure 2.10. Overall, all panels met load, serviceability and weight requirements for movable bridges.
Harris and Roberts-Wollmann (2008) tested three 3-in. (76.2 mm) thick UHPC slabs, bolted to beams along the longer edges to simulate the slab of a double-tee section, with a total span length of 7-ft. (2.13 m). A wheel patch load was used to apply the load so it could be able to determine the design wheel load and the failure mechanism. Figures 2.11 shows the test setup. It was concluded by the test results that the failure mode for all panels were flexure. Figures 2.12 shows that the cracks from the middle towards the free ends. The research team concluded that this happened because either the supports were not full restrained or the fiber orientation descendant from flow of the material during the casting provided a flexural strength in one direction smaller than the orthogonal direction. It was considered a good results as the slab was expected to fail in punching shear.
17
Figure 2.8. Dahlonega Road Bridge (a) plan view; (b) cross section; (c) during construction (Aaleti et al., 2015)
Conversion: 1 ft. = 30.48 cm; 1 in. = 2.54 cm
Figure 2.10. Test procedure (a) test setup; (b) failure mode (Ghasemi et al., 2016)
19
Figure 2.12. Typical cracking pattern on bottom surface of the panels (Harris & Roberts-Wollmann, 2008)
3. SCOPE OF WORK
The research study investigated how UHPC panels behave under flexure and shear loads compared to conventional concrete (CC) panels. To achieve that, several types of panels were fabricated with varying concrete types, thicknesses and
reinforcement types. In the later case, the use of welded wire mesh (WWM)
reinforcement was chosen for a low reinforcement ratio option for flexure testing only. Panels were also investigated with no reinforcement to study how the tensile strength of the UHPC impacted the panel behavior.
The panels that were selected for the study were 3 in. (76.2 mm) and 2 in. (50.8 mm) in thickness. Although AASHTO LRFD (2012) specifies that a minimum thickness for a stay-in-place concrete form is 3.5 in. (88.9 mm), lower thickness values were selected because of the capacity of mixer that was available for use.
Panels were tested in a single span configuration. Different load configurations were used to achieve a higher bending moment or shear. Panels are identified as flexure panels if the load is located at the mid span and shear panels if the load is located at a quarter of the span.
Figure 3.1 breaks down how the panels were named, and Table 3.1 summarizes the test matrix under taken in this research study.
F – U – N – 3
Test type:
(F) Flexure (S) Shear
Concrete type:
(C) Conventional (U) UHPC Reinforcement type:
(C) Conventional (W) Wire mesh (N) No reinforcement
Panel thickness, in inches
21 Table 3.1. Test matrix
Test Type
Concrete
Type Reinf. Type Reinf. Detail
Reinf. Steel Grade (ksi) Panel Thickness (in.) Panel Designation Flexure
Conventional Conventional No. 3 @ 3 in. 60 3 FCC3 Conventional WWM 4x4 – W5.5xW5.5 65 3 FCW3 UHPC Conventional No. 3 @ 3 in. 60 3 FUC3 UHPC WWM 4x4 – W5.5xW5.5 65 3 FUW3 UHPC WWM 4x4 – W5.5xW5.5 65 2 FUW2
UHPC None - - 3 FUN3
UHPC None - - 2 FUN2
Shear
Conventional Conventional No. 3 @ 2 in. 60 3 SCC3 UHPC Conventional No. 3 @ 2 in. 60 3 SUC3 UHPC Conventional No. 3 @ 2 in. 60 2 SUC2
UHPC None - - 3 SUN3
UHPC None - - 2 SUN2
Conversion: 1-in. = 25.4 mm; 1 ksi = 6.89 MPa
The comparison between the test data and prediction models is presented after the analysis of the test results. The models used in this study are the ones described in section 2 on equations (1) to (18). A cost study comparing the panels is also presented.
4. MIX DESIGN 4.1. CONVENTIONAL CONCRETE MIX DESIGN
The conventional concrete mix design used to cast the control panels is a modified version of a standard DOT mix and it is shown in Table 4.1. The mix design was developed to achieve a compressive strength of 4 ksi (27.6 MPa). The choice of using 3/8-in. (9.53 mm) crushed stone as coarse aggregate for this mix was made because of the scale of the panels.
Table 4.1. Conventional concrete mix design
Material Amount [lb./yd3 (kg/m3)] Type I cement 517 (307)
Crushed stone 1558 (924) River sand 1588 (924)
Water 284 (169)
w/c 0.55
4.2. UHPC MIX DESIGN
The UHPC mix design used is this research were developed with locally available materials and designed by Meng and Khayat (2015). The mix is shown in Table 4.2. The design compressive strength of the mix was 22 ksi (151.7 MPa) when steam cured. However, the specimen were not steam cured as it can be seen on section 5.
4.3. MATERIALS
4.3.1. Portland Cement. The cement used for the CC was type I from QUIKRETE. A Type III cement from Lonestar was used for UHPC. Its gradation is shown on Figure 4.5 along with the gradation of the others cementitious materials used in this research.
23 Table 4.2. UHPC mix design
Material Amount [lb./yd3 (kg/m3)]
Type III cement 924 (548)
Silica fume 70 (41)
Ground-granulated Blast-furnace Slag 902 (535)
River sand 1,194 (708) Masonry sand 523 (310) Superplasticizer 117 (69) Steel fibers 263 (156) Water 246 (146) w/c 0.20
4.3.2. Crushed Stone. The 3/8-in. (9.53 mm) crushed stone used in the CC mix is shown in Figure 4.3 and was provided by Rolla Ready Mix, a local concrete premix company. The material properties are shown on Table 4.3. The material gradation is shown in Figure 4.2 along with the data from the others aggregates.
Table 4.3. Material properties of crushed stone
Specific gravity 2.685
Absorption 1.56%
4.3.3. River Sand. The river sand used in both mixes was from the Missouri River and was also provided by Rolla Ready Mix. The material properties are shown on Table 4.4. The material gradation is shown in Figure 4.2 along with the data from the other aggregates.
Table 4.4. Material properties of river sand
Fineness modulus 3.31
Absorption 0.5%
4.3.4. Masonry Sand. The masonry sand used in the UHPC mix was also provided by Rolla Ready Mix. The material properties are shown in Table 4.5. The material gradation is shown on Figure 4.2 along with the data from the other aggregates.
Table 4.5. Material properties of masonry sand
Fineness modulus 1.73
Absorption 0.5%
4.3.5. Ground-granulated Blast-furnace Slag. The ground-granulated blast-furnace slag (GGBS) used in this research was donated by Illinois Cement Company. It is an ASTM C989 100 grade slag, and it can be seen in Figure 4.3. Its gradation is shown on Figure 4.5 along with the gradation of the others cementitious materials used in this research.
25
Figure 4.2. Gradation of the aggregates used
Figure 4.3. Ground-granulated blast-furnace slag
0 20 40 60 80 100 0.01 0.1 1 10 100 Pa ss in g (% ) Sieve Size (mm) Crushed Stone River Sand Masonry Sand
4.3.6. Silica Fume. The silica fume used in the UHPC is the Elkem Microsilica grade 900, from Elkem Materials Inc, and it can be seen on Figure 4.4. Its gradation is shown on Figure 4.5 along with the gradation of the others cementitious materials used in this research.
Figure 4.4. Silica fume
4.3.7. Superplasticizer. The high-range water-reducer (HRWR) or
superplasticizer used in this research was the Glenium 7500 manufactured by BASF of St Louis, MO.
4.3.8. Steel Fibers. The steel fibers used were the Bekeart Corporation’s Dramix OL 13/.20. They are shown in Figure 4.6, and their specifications are listed in Table 4.6.
27
Figure 4.5. Gradation of the cementitious materials used
Figure 4.6. Steel fibers
Table 4.6. Steel fiber properties
Length 0.5 in. (13 mm)
Diameter 0.0079 in. (0.2 mm)
Tensile Strength 313 ksi (2,160 MPa)
Modulus of Elasticity 30,450 ksi (210,000 MPa)
Specific Gravity 7.85 0.00 20.00 40.00 60.00 80.00 100.00 0.01 0.1 1 10 100 1000 Pa ss in g (% ) Sieve Size (mm)
Type III Cement GGBS
5. EXPERIMENTAL PROGRAM
5.1. CONVENTIONAL CONCRETE MECHANICAL PROPERTIES
All specimens used to find the mechanical properties of the conventional concrete were submitted to the same curing regime as their respective panels. They were all tested using the 200,000 lb. (889.6 kN) Tinius Olsen machine (shown in Figure 5.1) located in the Load Frame Laboratory in Butler-Carlton Hall at Missouri S&T.
29
5.1.1. Compressive Strength. Compressive strength specimens were cast and tested according to ASTM C39/C39M-15a, “Standard Test Method for Compressive Strength of Cylindrical Concrete Specimens.” The specimens used in this test were 4 in. x 8 in. (101.6 mm x 203.2 mm) cylinders. The mold used that is shown in Figure 5.2. The load rate used in the test machine was 500 lb./sec (2.22 kN/sec). Because of the drum mixer’s volume limitations, as explicated in Item 5.4.3, there were only enough cylinders to test the strength of the concrete at 7 and 28 days of age (which was the test day age). The results were:
f’c, 7 days = 3.95 ksi (27.2 MPa)
f’c, 28 days = 5.18 ksi (35.7 MPa)
Figure 5.2. Cylinder mold for 4-in. x 8-in. (101.6 mm x 203.2 mm) cylinders
5.1.2. Modulus of Elasticity. Modulus of elasticity test specimens were cast and tested according to ASTM C469/C469M-14, “Standard Test Method for Static Modulus
of Elasticity and Poisson’s Ratio of Concrete in Compression.” The specimens used in this test were 4 in. x 8 in. (101.6 mm x 203.2 mm) cylinders and the mold was the same that is shown in Figure 5.2. The load rate used in the test machine was 440 lb./sec (1.96 kN/sec). The result was E = 4,352 ksi (30.0 GPa).
5.2. UHPC MECHANICAL PROPERTIES
Like the conventional concrete ones, all specimens used to find the mechanical properties of the UHPC were submitted to the same curing regime as their respective panels. They were all tested using the same Tinius Olsen machine (shown in Figure 5.1) located in the Load Frame Laboratory in Butler-Carlton Hall at Missouri S&T.
5.2.1. Compressive Strength. Compressive strength specimens were cast and tested according to ASTM C109/C109M-13, “Standard Test Method for Compressive Strength of Hydraulic Cement Mortars (Using 2-in. or [50-mm] Cube Specimens)”.
At first, the molds used for the cubes are the plastic ones shown in Figure 5.3. Later in the research, it was found that those molds were difficult to demold, clean, and reassemble, so they were replaced with the steel ones that are shown in the same figure.
31 The choice of using 2 in. (50 mm) cubes was due to the limited capacity of the testing equipment. It saved material as each batch needed a separate set of cubes and each panel needed a separate batch. It is important to point out that the UHPC’s compressive strength is not affected by the specimen geometry used in the compression testing (Graybeal, 2006).
Tests were made for every panel at concrete ages of 7 and 28 days and test day age. Figure 5.4 shows the test setup. The results are shown in Table 5.1:
Figure 5.4. UHPC compressive strength setup
5.2.2. Modulus of Elasticity. UHPC modulus of elasticity test specimens were cast and tested according to ASTM C469/C469M-14, “Standard Test Method for Static Modulus of Elasticity and Poisson’s Ratio of Concrete in Compression.” The specimens used in this test were 4 in. x 8 in. (101.6 mm x 203.2 mm) cylinders, and the mold was the same as is shown in Figure 5.2. The load rate used in the test machine was 440 lb./sec (1.96 kN/sec). The results are in Table 5.2.
Table 5.1. UHPC compressive strength summary
Specimen 7 days [ksi (MPa)]
28 days [ksi (MPa)]
Test day [ksi (MPa)] FUC3 9.90 (68.3) 13.4 (92.4) 14.3 (98.6) FUW3 9.91 (68.3) 13.6 (93.8) 13.7 (94.5) FUN3 9.86 (68.0) 13.8 (95.1) 14.2 (97.9) FUW2 12.7 (87.6) 15.4 (106.2) 16.2 (111.7) FUN2 12.7 (87.6) 16.9 (116.5) 18.0 (124.1) SUC3 13.9 (95.8) 18.1 (124.8) 18.2 (125.5) SUN3 12.8 (88.3) 17.8 (122.7) 18.4 (126.9) SUC2 11.8 (81.4) 16.8 (115.8) 16.7 (115.1) SUN2 11.7 (80.7) 18.1 (124.8) 18.1 (124.8)
Table 5.2. UHPC modulus of elasticity summary
Specimen Modulus of elasticity at test day [ksi (GPa)]
FUC3 7,075 (48.8) FUW3 5,800 (40.0) FUN3 6,325 (43.6) FUW2 6,425 (44.3) FUN2 6,600 (45.5) SUC3 6,525 (45.0) SUN3 6,700 (46.2) SUC2 6,550 (45.2) SUN2 6,775 (46.7)
33
5.2.3. Splitting Tensile Strength. Splitying tensile specimens were tested according to ASTM C496/C496M-11 “Standard Test Method for Splitting Tensile Strength of Cylindrical Concrete Specimens.” The specimens were 3 in. x 6 in. (76.2 mm x 152.4 mm) cylinders. The size of the specimen was chosen because of the loading capacities of the testing equipment. The test setup can be seen in Figure 5.5. The specimens were tested at test age, and the results are in Table 5.3.
Figure 5.5. Split tensile strength test setup
5.3. STEEL REINFORCEMENT MECHANICAL PROPERTIES
Tensile strength tests conducted on the steel reinforcement used on the panels were performed according to ASTM A370-15, “Standard Test Methods and Definitions for Mechanical Testing of Steel Products.” The results for yield strength and tensile strength are shown in Table 5.4.
Table 5.3. UHPC Split tensile strength summary
Specimen Splitting tensile strength at test day [ksi (MPa)]
FUC3 2.24 (15.4) FUW3 2.09 (14.4) FUN3 2.37 (16.4) FUW2 2.55 (17.5) FUN2 2.85 (19.6) SUC3 2.88 (19.9) SUN3 2.74 (18.9) SUC2 2.98 (20.5) SUN2 2.64 (18.2)
Table 5.4. Steel reinforcement strength summary
Reinforcement type Yield strength [kips (MPa)] Tensile strength [kips (MPa)] Yield strain (in/in) No. 3 rebar 70 (482) 78 (538) 0.00241
Welded wire mesh 72 (596) 92 (634) 0.00310
5.4. PANELS DEVELOPMENT
5.4.1. Panel Formwork. The formwork used to cast the panels was made by outlining the bottom of the 0.72-in.-(18.3 mm) thick water-resistant OSB panels and attaching them on the same sides as the OSB were panels cut to achieve the desired concrete panel height. First, all 3-in.-(76.2 mm) thick panels were cast. Then the formwork sides were cut to adjust the height of the panels to 2 in. (50.8 mm).
Because both panels for flexure and shear testing have the same dimensions, the same formwork was used for all panels.
35
5.4.2. Panel Reinforcement. The reinforcements used for the conventional concrete panels were chosen based on the type of failure desired (flexure or shear). All panels were detailed respecting minimum reinforcement ratio and minimum and
maximum spacing recommended by ACI 318-11. Also, all flexure panels were designed to have the failure mode controlled by concrete crushing after the yield of the reinforcing steel. Every reinforcement layout set for the conventional concrete panels was replicated for the UHPC panels so the test results could be better compared.
The flexure testing panels, FCC3, FUC3 and FUC2 used No. 3 rebars spaced at 3 in. (76.2 mm) as reinforcement, while panels FCW3, FUW3, and FUW2 used welded wire mesh (WWM) W5.5xW5.5 spaced at 4 in. (101.6 mm). Panels FUN3 and FUN2 didn’t have reinforcement, so it was possible to analyze better the effect of the tensile strength of UHPC on the moment capacity.
For shear testing panels, only conventional rebars were used. Panels SCC3, SUC3, and SUC2 used No. 3 rebars spaced 2 in. (50.8 mm) as reinforcement. The objective of the panel design was to make sure that shear failure would happen before flexural failure. A higher reinforcement ratio than the one present in the flexure testing panels was used to achieve this. Panels SUN3 and SUN2 didn’t have reinforcement, so the shear capacity given by the UHPC alone could be studied better.
Minimum shrinkage and temperature reinforcement were used in all CC panels following ACI 318-11 specifications. All UHPC panels were made without any shrinkage and temperature reinforcement. This choice was made because it was expected that the steel fibers in the UHPC panels would bridge any cracks that resulted from shrinkage. The use of these panels without this kind of reinforcement provides a lighter, easier panel with a higher constructional productivity. This does not apply to WWM panels, as the mesh already provides reinforcement in both ways.
Table 5.5 is the summary of how each panel was reinforced and Figure 5.6 shows the cross-section of the panels with reinforcement and the location of the reinforcement.
Table 5.5. Specimen reinforcement setup Panel Designation Longitudinal reinforcement Transverse reinforcement
FCC3 No. 3 @ 3 in. No. 3 @ 10 in.
FCW3 4x4 – W5.5xW5.5 -
FUC3 No. 3 @ 3 in. None
FUW3 4x4 – W5.5xW5.5 -
FUW2 4x4 – W5.5xW5.5 -
FUN3 None None
FUN2 None None
SCC3 No. 3 @ 2 in. No. 3 @ 10 in.
SUC3 No. 3 @ 2 in. None
SUC2 No. 3 @ 2 in. None
SUN3 None None
SUN2 None None
Conversion: 1 in. = 25.4mm
5.4.3. Conventional Concrete Panel Casting and Curing. The conventional concrete panels were the first group of panels that was cast. The batching was done using the concrete mixer located at Missouri S&T’s concrete laboratory, as shown in Figure 5.7. Its current capacity is 3.5 ft.3 (99,000 cm3), so 2 batches with a total of 7 ft.3 (198,000 cm3) were necessary to fill all 3 panels and the test cylinders. The 2 batches were hand-mixed together in a pool so they would be homogenous. The average of the slump test from the 2 batches was 2.25-in. (57.2 mm), which was below the target slump. Still, the concrete had enough workability to be cast.
37
(a) Panel FCC3
(b) Panels FCW3 and FUW3
(c) Panel FUC3
(d) Panel FUW2
(e) Panel SCC3
(f) Panel SUC3
(g) Panel SUC2
Figure 5.6 Cross-section of the panels with reinforcement Conversion: 1 in. = 25.4mm 0.75 in 3.0 in (typ.) 0.75 in 4.0 in (typ.) 0.75 in 3.0 in (typ.) 0.75 in 4.0 in (typ.) 0.75 in 2.0 in (typ.) 0.75 in 2.0 in (typ.) 0.75 in 2.0 in (typ.)
Figure 5.7. Conventional concrete mixer
Conventional concrete panels were deformed 3 days after casting. They were cured inside the form with wet burlap.
5.4.4. UHPC Panel Casting and Curing. The UHPC batching was done using a high-shear mixer located at Missouri S&T’s concrete laboratory (shown in Figure 5.8). The nominal capacity of the mixer is 3.5 ft.3 (99.1 dm3). However, because of the high volume of material that is added to the batch before the superplasticizer, the limit for this kind of concrete is 2.5 ft.3 (70.8 dm3), which is what was needed to fill one panel and the test cubes and cylinders. Because of that, only one panel could be cast at a time.
39
Figure 5.8. High-shear mixer
Figure 5.9 shows the UHPC mixing. The material pouring during the batch was performed using the following procedure:
First, all aggregates (river and masonry sand) were poured into the pan until it became a homogenous mix.
Then the GGBS slag and the silica fume were added.
At this point, the pan was full of material. Half of the water and superplasticizer were added to lower the material volume.
Then, the cement was added.
Then the mixer was allowed sufficient time to mix the cement with the previous mix so it could react with the plasticizer. From this point to the end of the batch, the other half of the water and plasticizer were added in small amounts. Also,
during this period, a tool was used to scrape any material left unmixed at the bottom of the pan.
When the mix got a homogenous paste-like look, the steel fibers were added.
At last, the mix was allowed to mix for 5 minutes. After that, a visual inspection was performed to determine the necessity of adding more superplasticizer to the mix. The amount added, if any, was documented.
Figure 5.9. UHPC batching
The amount of superplasticizer that was added closer to the end of each batch varied. Panels FUC3, FUW3, and FUN3 were the first ones to be cast and a considerable amount of superplasticizer was added because it was thought that the concrete was not mixing properly. As a result, the concrete mechanical properties from those panels were compromised, as observed in section 5.2. Table 5.6 shows the amount of superplasticizer added in each batch.
41 Table 5.6. Superplasticizer added beyond mix design
Specimen Amount of SP added [lb. (g)] New SP mix design value [lb./yd3 (kg/m3)] FUC3 1.985 (900) 138.6 (82.2) FUW3 2.491 (1134) 144.1 (85.5) FUN3 1.980 (898) 138.6 (82.2) FUW2 0.111 (50) 118.4 (70.2) FUN2 0.129 (59) 118.6 (70.4) SUC3 -0.517 (-234) (subtracted) 111.6 (66.2) SUN3 0.065 (30) 117.9 (69.9) SUC2 None - SUN2 None -
The UHPC panels were cured using wet burlaps placed under plastic sheets as can be seen in Figures 5.10 and 5.11. The plastic sheet was applied at after the end of the casting. The burlap was applied around 3 hours after casting, when the UHPC was already hard enough to not get stuck on the burlap. Panels were demolded after 24 hours. The curing lasted for 7 days.
The UHPC panels were not steam-cured made because doing so in the field or in a precast plant would be considered impracticable.
Figure 5.10. Wet burlap on top of concrete surface
Figure 5.11. Plastic sheet on top of burlap
5.5. TEST SETUP AND DATA ACQUISITION
Figures 5.12 and 5.13 illustrates the test setup. The panels were tested in a 3 point load configuration. A hydraulic jack was used to input the load. A 10-in. x 5-in. x 0.425-in. (254 mm x 127 mm x 10.8 mm) piece of plywood followed by a 10-0.425-in. x 5-0.425-in. x 1.75-in. (254 mm x 127 mm x 44.45 mm) steel plate were used to transfer the load from the jack to the panel. After panels FCC3, FCW3, and SCC3 were tested, it was observed that
43 the plywood was too thin to properly transfer the load between the steel plate and the concrete surface. Because of that, the plywood was substituted by a 10-in. x 5-in. x 1-in. (254 mm x 127 mm x 25.4 mm) neoprene pad.
The dimensions of the steel plate and the neoprene were chosen to simulate an AASHTO HS20 half scale truck tire. The jack reacted on a beam that was supported by 2 steel rods fixed in the laboratory floor. It is important to note that in the field the stay-in-place panel is located underneath a later cast-in-stay-in-place concrete layer. This would cause the load to propagate into a larger area when it reaches the panel. Still, this size of load plate was chosen because it is more critical to punching shear load.
It is important to point that because the width of the plate is considerably smaller than the width of the panel, the applied load is not constant across the specimen width, and, therefore, a plate action takes place in opposed to one-way beam action. This may have resulted in reactions that are not uniform along the length of the support (width of panel).
The panels tested for flexure had their load located at the center of the panel, with the longer dimension of the loading plate parallel to the span. The shear panels had their load located at a quarter of the span, so it would achieve a higher shear load. With that configuration it was possible to achieve a shear-span to depth ratio of 4.67 when using the centerline of both support and load as reference, and a shear-span to depth ratio of 1.33 when considering the border of both support and load plate. If the load was
allocated closer to the support, it would start to develop an arching behavior, which is not of interest for this research. A plumb line was used to align the jack to the right position.
A load cell was placed between the steel plate and the jack to monitor the evolution of the load applied on the panel. Linear variable differential transformers (LVDTs) were placed on the direction of the load 2 in. (50.8 mm) away from the border of the panel to monitor displacement.
Figure 5.12. Test setup for flexure panels Conversion: 1 in. = 25.4mm
Figure 5.13. Test setup for shear panels Conversion: 1 in. = 25.4mm 10.0-in. 48.0-in. 24.0-in. 2.0 - 3.0-in. 1.0-in. 3.0-in. 3.0-in. 24.0-in. 5.0-in. HYDRAULIC JACK REACTION BEAM STEEL PLATE PANEL NEOPRENE PAD SUPPORTS SUPPORT NEOPRENE PAD 10.0-in. 48.0-in. 13.5-in. 3.0-in. 24.0-in. 5.0-in. NEOPRENE PAD SUPPORT
45 Strain gauges were applied at the reinforcement and at the concrete surface. Their arrangement varied in function according to the type of reinforcement that was used. Panels FCC3 and FUC3 had one strain gauge attached on the middle of one of the middle bars, one on the other middle bar but offset 1.5 in. (38.1 mm), and one on the concrete compression surface on middle of the panel, offset 4.5 in. (114.3 mm) from the center of the load. A similar strain gauge setup was used on panels SCC3, SUC3, and SUC2, but with the strain gauges located closer to the load center for the shear panels. Panels FCW3, FUW3, and FUW2 had one strain gauge on the middle of each middle bar, one strain gauge on each subsequent bar but offset 1.5 in. (38.1 mm), and one strain gauge on the concrete compression surface on the middle of the panel, offset 4.5 in. (114.3 mm) from the center of the load. Panels FUN3, FUN2, SUC3, and SUC2 had just one strain gauge each on the compression surface in the direction of the center of the load but offset 4.5 in. (114.3 mm). Figures 5.14 to 5.18 illustrate the strain gauge arrangement on the reinforcement, unless stated otherwise, for each specimen.
Figure 5.14. Strain gauge setup for panels FCC3 and FUC3 Conversion: 1 in. = 25.4mm 4.5-in. 1.5-in. SG2 SG1 24.0-in. 48.0-in. LOAD CENTER SG3 (CONCRETE SURFACE, COMPRESSION SIDE)
Figure 5.15. Strain gauge setup for panels FCW3, FUW3 and FUW2 Conversion: 1 in. = 25.4mm
Figure 5.16. Strain gauge setup for panels FUN3 and FUN2 Conversion: 1 in. = 25.4mm 4.5-in. SG1 SG5 (CONCRETE SURFACE, SG4 1.5-in. SG3 SG2 24.0-in. 48.0-in. LOAD CENTER COMPRESSION SIDE) 4.5-in. 24.0-in. 48.0-in.
47
Figure 5.17. Strain gauge setup for panels SCC3, SUC3 and SUC2 Conversion: 1 in. = 25.4mm
Figure 5.18. Strain gauge setup for panels SUN3 and SUN2 Conversion: 1 in. = 25.4mm 4.5-in. SG2 SG1 1.5-in. 24.0-in. 48.0-in. LOAD CENTER SG3 (CONCRETE SURFACE, COMPRESSION SIDE) 4.5-in. 24.0-in. 48.0-in. LOAD CENTER SG1 (CONCRETE SURFACE, COMPRESSION SIDE)
6. RESULTS AND DISCUSSION 6.1. FLEXURE TESTING RESULTS
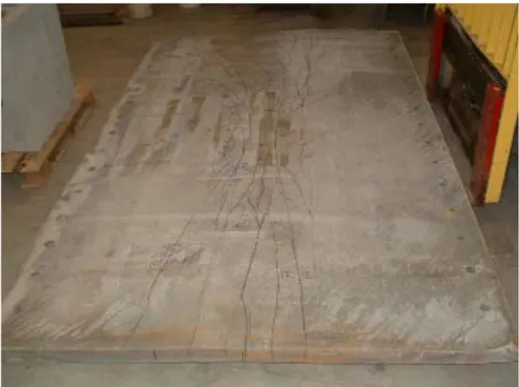
6.1.1. Panel FCC3 Testing Procedure. The first crack in panel FCC3 appeared at the load of 4.6 kips (20.5 kN). At the load of 7.7 kips (34.3 kN), the test needed to be stopped because the reaction beam started to twist laterally. It occurred due to an eccentricity between the jack and the reaction beam. The panel had to be fully unloaded to align the jack properly. After the adjustment, the test was restarted.
It was considered that the panel failed when the load began to decrease at the same time as a compression crack perpendicular to the load plate appeared (as shown on Figure 6.1), clearly showing a flexural failure. Figure 6.2 shows the crack pattern on the bottom side of the panel.
A problem occurred after the peak load so the test could not be continued, which is why, as can be seen in Figure 6.3, there is no data after this point.
49
Figure 6.2. Crack pattern formation at the tension face of panel FCC3 Figure 6.3 shows the load versus displacement curve, and Figure 6.4 shows the load versus strain curve, both obtained from data acquisition. The peak load attained was 8,709 lb. (38.7 kN). Strain gauges SG1 and SG2 did not registered yielding in the
reinforcing bars. Strain gauge SG 3 malfunctioned during the test.
Figure 6.3. Load versus displacement for panel FCC3 Conversion: 1 in. = 25.4mm; 1 lb. = 4.45 N 0 1000 2000 3000 4000 5000 6000 7000 8000 9000 0 0.05 0.1 0.15 0.2 0.25 0.3 Lo ad (l b. ) Displacement (in.)
Figure 6.4. Load versus strain for panel FCC3 Conversion: 1 lb. = 4.45 N
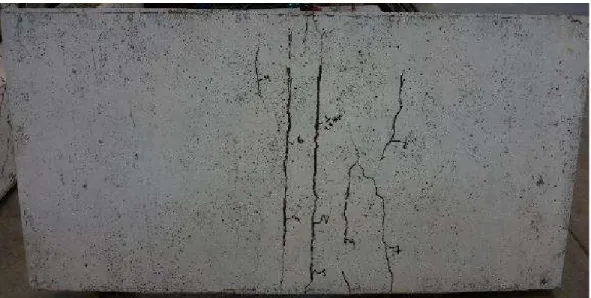
6.1.2. Panel FCW3 Testing Procedure. Panel FCW3 had it first crack at 2.0 kips (8.9 kN). The failure was achieved when a compression crack perpendicular to the end of the steel plate appeared, followed by a load drop. The crack was not at the center because of the stiffness of the steel and the small thickness of the plywood, which caused a 4-point load configuration.
The panel separated in two parts and collapsed on the ground, as Figure 6.5 shows, when the jack and the plates from the top of the panel were removed.
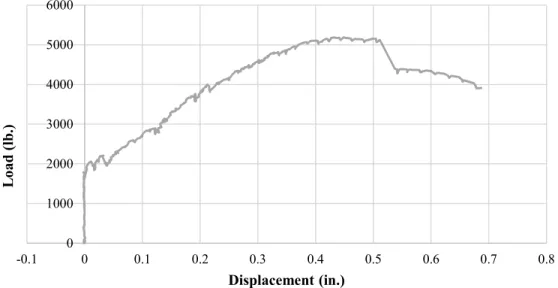
The results are shown on Figures 6.6 and 6.7. As can be seen, the panel had little deflection until around 2,000 lb. (8.9 kN). It can be assured that it was not a defect on the LVDTs because both of them had the same reading, and the steel also only started to deform after 2,000 lb. (8.9 kN). The peak load attained was 5,189 lb. (23.1 kN), and it was followed by a sudden load drop. Strain gauges SG 2, 4, and 5 did not work properly during the test.
0 1000 2000 3000 4000 5000 6000 7000 8000 9000 0 500 1000 1500 2000 2500 3000 Lo ad (l b. )
Strain (10e-6 in./in.)
SG 1 SG 2 Yield of reinforcing steel
51
Figure 6.5. Panel FCW3 split after failure
Figure 6.6. Load versus displacement for panel FCW3 Conversion: 1 in. = 25.4mm; 1 lb. = 4.45 N 0 1000 2000 3000 4000 5000 6000 -0.1 0 0.1 0.2 0.3 0.4 0.5 0.6 0.7 0.8 Lo ad (l b. ) Displacement (in.)
Figure 6.7. Load versus strain for panel FCW3 Conversion: 1 lb. = 4.45 N
6.1.3. Panel FUC3 Testing Procedure. Panel FUC3 had its first visible crack at the load of 14.1 kips (62.1 kN). The failure mechanism was a crack at the mid-span with the fibers pulling out from the matrix, as shown in Figures 6.9 to 6.11, characterizing a bending moment failure. Figure 6.8 shows the test setup.
Figure 6.8. Panel FUC3 test setup 0 1000 2000 3000 4000 5000 6000 0 2000 4000 6000 8000 10000 12000 14000 Lo ad (l b. )
Strain (10e-6 in./in.)
SG 1 SG 3 Yield of reinforcing steel
53
Figure 6.9. Panel FUC3 after failure
Figure 6.10. Tensile crack on panel FUC3
Figures 6.12 and 6.13 show the results. The load versus displacement curve shows an elastic range that lasted until around 17,000 lb. (75.6 kN). The peak load attained was 19,158 lb. (85.2 kN).
Figure 6.11. Crack pattern formation at the tension face of panel FUC3
Figure 6.12. Load versus displacement for panel FUC3 Conversion: 1 in. = 25.4mm; 1 lb. = 4.45 N
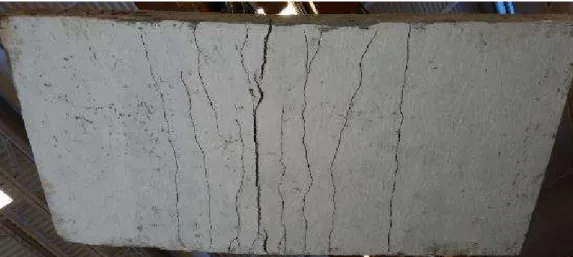
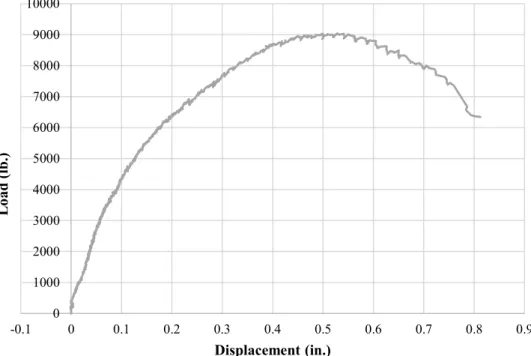
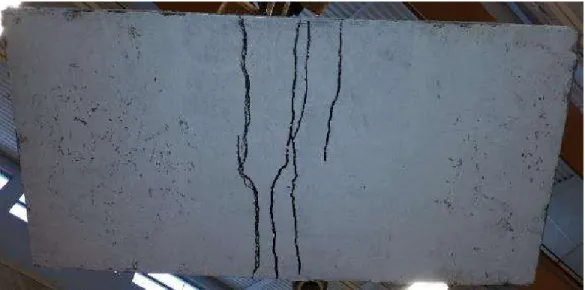
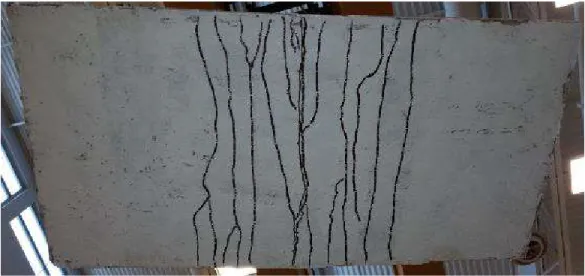
6.1.4. Panel FUW3 Testing Procedure. Panel FUW3 had its first crack at 2.9 kips (12.7 kN). The failure mode was also bending moment, as can be seen in Figures 6.15 and 6.16. Figure 6.14 shows the test setup.
0 2000 4000 6000 8000 10000 12000 14000 16000 18000 20000 -0.2 0 0.2 0.4 0.6 0.8 1 1.2 1.4 1.6 1.8 Lo ad (l b. ) Displacement (in.)
55
Figure 6.13. Load versus strain for panel FUC3 Conversion: 1 lb. = 4.45 N
Figure 6.17 and 6.18 shows the test results. The load versus deflection curve had a parabolic shape, with its peak load at 9,042 lb. (40.2 kN). Strain gauge SG 1 did not work on the test.
Figure 6.14. Tensile crack on panel FUW3 0 2000 4000 6000 8000 10000 12000 14000 16000 18000 20000 -4000 -2000 0 2000 4000 6000 8000 Lo ad (l b. )
Strain (10e-6 in./in.)
SG 1 SG 2 SG 3 Yield of reinforcing steel
Figure 6.15. Panel FUW3 test setup
57
Figure 6.17. Load versus displacement for panel FUW3 Conversion: 1 in. = 25.4mm; 1 lb. = 4.45 N
Figure 6.18. Load versus strain for panel FUW3 Conversion: 1 lb. = 4.45 N 0 1000 2000 3000 4000 5000 6000 7000 8000 9000 10000 -0.1 0 0.1 0.2 0.3 0.4 0.5 0.6 0.7 0.8 0.9 Lo ad (l b. ) Displacement (in.) 0 1000 2000 3000 4000 5000 6000 7000 8000 9000 10000 -4000 -2000 0 2000 4000 6000 8000 Lo ad (l b. )
Strain (10e-6 in./in.)
SG 2 SG 3 SG 4 SG 5 Yield of reinforcing steel