A PREDICTIVE MODEL OF REDEMPTION AND LIABILITY IN
LOYALTY REWARD PROGRAMS INDUSTRY
Aaron Luntala NSAKANDA Sprott School of Business
Carleton University Ottawa, ON, Canada, K1S5B6
Moustapha DIABY School of Business Administration,
University of Connecticut Storrs, CT 0629-2041, USA [email protected]
Yuheng CAO Sprott School of Business
Carleton University Ottawa, ON, Canada, K1S5B6
Abstract
Loyalty reward programs (LRPs), initially developed as marketing programs to enhance customer retention, have now become an important part of customer-focused business strategies. With the growth in these programs, the complexities in their management and control have also increased. One of the challenges faced by LRPs managers is that of developing models to address various forecasting issues to support short, medium, and long term planning and operational decision-making. We propose in this paper a predictive model of redemption and liability in LRPs. The proposed approach is an aggregate inventory model in which the liability of points is modeled as a stochastic process. An illustrative example is discussed as well as a real-life implementation of the methodology to facilitate use and deployment considerations in the context of a frequent flyer program, an airline industry based LRP.
1
Introduction
Loyalty reward programs (LRPs) have increasingly become prevalent in recent years. For instance, in the airline industry alone, more than 130 companies currently have a LRP, and 163 million people throughout the world are enrolled in their programs [1]. Geographically, LRPs have been quite popular in the United States, United Kingdom, Canada, and a host of other countries. Some studies show that 90% of Americans and 92% of UK consumers are members of at least one LRP [2]. In the Canadian market settings, a special article featuring loyalty programs1 reports that according to
Visa Canada Association, more than 25 million VISA cards are in circulation in Canada and about 78% of
1 National post newspaper article on Loyalty programs published
on October 7, 2005.
all card holders belong to one or more LRPs. A study from ACNielsen reports that 95% of Canadians belonged to LRPs of department stores, mass retailers, general merchandisers, or warehouse clubs in 2005 [2].
Although different types of LRPs exist today across a spectrum of industries (travel, hotel, retail, telecommunication, banking, gasoline, etc.), most of the modern systems have their roots from AAdvantage®, the loyalty program introduced by American Airlines in 1981 (also called frequent flyer program in the airline industry). Consumers in these systems are given incentives or rewards for repeat business, which in turn serve as motivation for them to continue buying a product or service [1]. In general, these systems involve at minimum a promotional currency (e.g. points or miles); single or multiple reward tier(s); a comprehensive database of individual consumers’ demographics and detailed transaction information; and an advanced technology to manage the program (e.g. redeem rewards directly or through internet), operate the contact center, and to analyze the members’ database.
Despite the increased complexities in LRP management and control, there are few academic models that specifically deal with LRPs to support planning and operational decision making. One of the challenges faced by LRP enterprises is that of developing aggregate and disaggregate models to address predictive modeling issues, such as liability forecasting, accumulation forecasting, redemption forecasting, and prediction of rewards supply and demand. Broadly, in a typical LRP, customers become members of the program, earn points (based on some specified “accumulation scheme”) on their purchases of products or services throughout the network of LRP’s commercial partners. These points can be redeemed based on a “reward chart” pre-established by the firm that owns the LRP. Points that are not redeemed are saved in the customer’s account (under some conditions, e.g., being active) and constitute the LRP outstanding balance (“liability”).
Points earned by customers during a given period (e.g., a year) constitute the LRP issued points (“accumulation”), whereas points redeemed by customers for rewards during a given period (e.g., a year) constitute the LRP redeemed points (“redemption”). At strategic level, LRPs are operated as profit center or cost center. A profit center LRP derives its revenue primarily from the sale of points to commercial partners and incurs its main costs at the time a member redeems points. In this latter situation, the LRP firm purchases the pre-determined product or service from its commercial partners in order to award it to the member. A cost center LRP generally operates as an internal unit (department) of a firm. It incurs its costs at the time a member redeems points.
Hence, for LRPs operating either as cost or profit centers, predictions of redemption, accumulation, and liability are key components to support short, medium, and long term planning and operational decision-making. For instance, LRPs’ managers rely on good predictions of redemption to set a balance between the customer expectations for rewards and the overall costs of rewarding customers. The lack of availability of rewards at the time of redemption will result in a poor service level and/or an increase of the reward supply costs to meet customers’ demand, since the LRP firm will have to acquire additional rewards, but at a cost higher than that of volume discount purchasing. Similarly, too much availability will result in excellent level of customer services, but a penalty cost may be incurred by the firm for unused rewards. Moreover, good predictions of redemption provide LRPs managers with the ability to develop promotion plans that seek for better management of redemption demand between peak and off-peak periods. To establish budgeting plans or forward financial statements, good forecasts of redemption are also required to estimate the planned costs of rewards. Good predictions of accumulation and redemption provide managers with the ability to anticipate the growth of the program in terms of liability and the related risk. Therefore, risk mitigation plans can be developed which may include strategies such as a revision of the reward scheme, the bonus policy, the reward policy or a mix of these strategies. In a nutshell, with good predictions, robust budgeting plans, revenue and cost estimates, forward financial statements, promotion plans, demand management plans, risk mitigation plans, program growth assessment plans, and more, can be developed.
This paper aims to provide a predictive model of redemption and liability. The plan of the paper is as follows. We present a brief literature review in Section 2. The overview of the modeling is discussed
in Section 3. The proposed predictive model is described in Section 4. An illustrative example is discussed in Section 5. A real-life implementation of the model in the context of a frequent flyer program is discussed in Section 6. Finally, conclusions are presented in Section 7.
2
Literature Review
Loyalty reward programs are marketing programs aimed at rewarding customers for using a product or a service. Several papers have been published on various aspects of LRPs. The majority of the existing papers are from the Marketing and the Economic literatures, respectively.
One set of papers are focused on offering insights into issues such as understanding and designing LRPs [2,4], the effectiveness and profitability of LRPs [5,6], the management of the LRP firm’s excess capacity [7], the impact of LRPs on repeat-purchase patterns [8], and the fairness of LRPs for customers [9]. However, none of these models support planning and operational decisions, such as those related to planning, managing, and controlling rewards supply and demand; optimizing LRP’s revenue and cost; designing and evaluating various promotion strategies; and assessing long term growth of the program. This has left LRP’s managers addressing these questions more on the basis of their experience and intuition than on analytical-based approaches.
Another set of the literature focuses on the need to gain customer insights through the analysis of the clients’ purchases and personal information accumulated in the LRP databases. A marketing perspective has been taken in most of these works [10-12] to address diverse issues, such as the selection of promising customers for targeting, the customization of direct marketing campaigns in terms of prices or promotions, the planning of promotion campaigns, and the promotional design decisions (e.g., choice of promotional vehicle, magnitude of discount, promotion frequency, the duration of frequency, etc.). Although relevant to the general management of LRPs, as in the works listed above, the proposed models do not directly address planning and operational decision making challenges faced by LRPs’ managers.
3
Modeling Overview
The main methodology in this paper is to consider the LRP as a dynamic system, where members are divided into tiers at the beginning of each qualifying period t, based on the analysis of the
members’ accumulation activities in period t-1, which we consider to be of the duration of one year. In effect, it is a common practice in many LRPs to offer a top-tier program to its members with a full range of exclusive privileges, which vary according to the “status” of each member in the system. For example, frequent flyer loyalty programs in airline industry allow members to qualify for a predefined top-tier status during a given qualifying period t (generally one year), after achieving a threshold level of accumulation activities in period t-1. A qualifying status comes with a number of privileges, such as priority boarding, seat selection, airport check-in, personalized luggage tags, airport lounge access, etc. For instance, AAdvantage®, the American Airline’s frequent flyer program, offers the following qualifying status: Gold, Platinum, and Executive Platinum. Whereas, Aeroplan®, the award-winning frequent flyer program of Air Canada has the following status: Prestige, Elite, and Super Elite. Similarly, frequent guest loyalty programs in the hotel industry allow members to qualify for a higher status in a qualifying period t based on the number of nights stayed in the period t-1 (a calendar year) and earn in return a number of privileges, including early check-in, late check-out, guaranteed room types, room upgrade, exclusive reservation line, bonus points, week-end discount, etc. For instance, Marriott Rewards®, the award-winning frequent guest program of Marriott offers the following qualifying status: Silver, Gold, and Platinum.
Over time, existing members migrate to other tiers (including staying in the same tier) and new members join the LRP system. The reasons for this are that a person’s socio-economic and demographic situation usually changes over time. For instance, a person enrolled in the program as a student will have a different economic situation after graduating and joining the workforce. Another example would be a person who is single at the time of enrolment and eventually becomes married with children. Therefore, the inter-tiers’ migrations are a function of socio-economic and demographic characteristics such as age, gender, marital status, education, profession, annual earnings, seniority in the program, for example. Furthermore, members in given tier, say j, can be partitioned into a finite number of segments based, for example, on their transactional activity level and seniority in the LRP system.
Hence, if the tiers are thought of as states of nature in a Markov chain, and the probabilities associated with the members’ migration are assumed to be time-invariant, then the process of the inter-tier migrations can be modeled as a stationary Markovian process. Statistical analyses or Pareto analyses can be
conducted to obtain estimates of the probabilities of these migrations or the proportion of points by members in each segment. Hence, the approach we propose in this paper can be viewed as a semi-stationary Markovian modeling approach in which the probabilities of transition are assumed to be time-invariant over the short and medium ranges (e.g., up to 4 years), while they are allowed to change over the long term. The justifications for this approach are that (a) due to the aggregate nature of information at the states of nature, their respective homogeneities cannot be ensured in the long term, and (b) members’ socio-economic and demographic characteristics evolve over time.
We describe the LRP system in terms of stock and flows. The stocks in the system are given by the following state variables, divided into appropriate categories –e.g., tiers, segments, etc: (a) number of points accrued in the system during a given qualifying period t; (b) number of points redeemed in the system during a given qualifying period t; (c) number of points balance in the system at the end of a qualifying period t. These state variables are hereafter referred to as accumulation, redemption, and liability, respectively. The goal of this paper is to provide a methodology of forecasting the latter two state variables, while considering the first state variable as an input parameter. The flows are given by (a) the new members joining the system; and (b) the migrations of existing members in the system to other tier status (including remaining in the same tier status).
Our modeling approach is in line with the increasing attention in the operations management literature to explore the dynamics in customer buying behaviour and the triggers behind these dynamics (see for example, [12-13]).
4 Predictive Model
In developing our proposed predictive model, we assume that the migrations between tiers occur at discrete times and that every transition takes one unit of time. In addition, we assume that the LRP offers one type of rewards (single product structure) rather than multiple types of rewards (multiple product structure). This is commonly found in airline industry (frequent flyer programs), hotel industry (frequent guest programs), or retail industry (frequent buyers programs), where rewards are only limited to the company’s core products. We assume that the reward scheme is known (and will not change during the planning horizon) and the probability of migration between tiers is given. Furthermore, we assume that the estimates of proportion of points
accrued and redeemed per tier status and segments are given as well as the estimates of proportion of points balance. As pointed out earlier, statistical analyses or Pareto analyses can be used to obtain these estimates. Finally, we assume that the segments of members between tiers are the same.
The notation we use is as follows: ij
p : probability of migration from tier status i to tier status j;
) (t j
a number of points accrued (i.e., accumulation) by members with tier status j during the qualifying period t;
) (t
akj number of points accrued (i.e., accumulation) by members with tier status j and segment k during the qualifying period t;
k j
pa proportion of points accrued by members with tier status j and segment k;
) (t j
r number of points redeemed (i.e., redemption) by members with tier status j during the qualifying period t;
) (t
rjk number of points redeemed (i.e., redemption) by members with tier status j and segment k during the qualifying period t;
k j
pr proportion of points redeemed by members with tier status j and segment k;
) (t j
n number of points balance (i.e., liability) by members with tier status j at the beginning of qualifying period t;
) (t j
n number of points balance (i.e., liability) by members with tier status j at the end of qualifying period t; )
(t
njk number of points balance (i.e., liability) by members with tier status j and segment k at the beginning of qualifying period t;
k j
po : proportion of points balance by members with tier status j and segment k;
a(t):
total number of points accrued (i.e. accumulation) during the qualifying period t;r(t):
total number of points redeemed (i.e. redemption) during the qualifying period t;n(t):
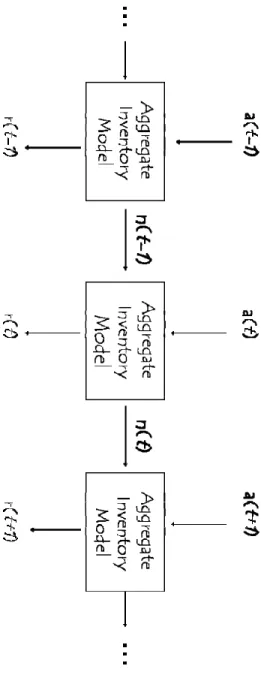
total number of points balance (i.e. liability) at the end of qualifying period t.Using the notation above, the basic of our modeling is shown in Figure 1, where the following inventory balance can be derived:
n(t)=n(t-1) + a(t) – r(t)
(1) Relation (1) stipulates that the number of points balance (liability) at the end of qualifying period t is equal to the number of points balance available at the end of qualifying period t -1 plus the number of points accrued by members during the qualifying period t minus the number of points redeemed by members during the qualifying period t.Insert Figure 1 Here
We propose the following 8-step procedure to predicting the state variables of accumulation, redemption, and liability, respectively:
(a) Predict the state variables of accumulation divided into tier status,aj(t), j=1,..,J, using time series methodology or any other approach.
(b) Partition the state variables of accumulation per tier status into segments as follows:
⎥ ⎥ ⎥ ⎥ ⎥ ⎥ ⎥ ⎥ ⎥ ⎦ ⎤ ⎢ ⎢ ⎢ ⎢ ⎢ ⎢ ⎢ ⎢ ⎢ ⎣ ⎡ × = ⎥ ⎥ ⎥ ⎥ ⎥ ⎥ ⎥ ⎥ ⎥ ⎦ ⎤ ⎢ ⎢ ⎢ ⎢ ⎢ ⎢ ⎢ ⎢ ⎢ ⎣ ⎡ j k j 2 j 1 j j j k j 2 j 1 j pa . . . pa pa (t) a t a . . . t a t a ) ( ) ( ) ( , j=1,…,J (2)
where kj denotes the number of segments in tier status
j. Relation (2) stipulates that the number of points accrued by members with tier status j and segment k during the qualifying period t is given by the product of number of points accrued by members with tier status j during the qualifying period t and the proportion of points accrued by members with tier status j and segment k.
(c) Predict the liability per tier status at the beginning of period t: p 1) -(t n t n i i ij j( )=
∑
× , j=1,…,J (3) Relation (3) stipulates that number of points balance by members with tier status j at the beginning ofqualifying period t comprise the number of points balance of members from all tiers status who have migrated into tier status j (including those remaining in the same tier status j).
(d) Partition the state variables of liability per tier status at the beginning of a given qualifying period into segments as follows:
⎥ ⎥ ⎥ ⎥ ⎥ ⎥ ⎥ ⎥ ⎦ ⎤ ⎢ ⎢ ⎢ ⎢ ⎢ ⎢ ⎢ ⎢ ⎣ ⎡ × = ⎥ ⎥ ⎥ ⎥ ⎥ ⎥ ⎥ ⎥ ⎦ ⎤ ⎢ ⎢ ⎢ ⎢ ⎢ ⎢ ⎢ ⎢ ⎣ ⎡ j k j 2 j 1 j j j k j 2 j 1 j po po po (t) n t n . . . t n t n . . . ) ( ) ( ) ( , j=1,…,J (4)
Relation (4) stipulates that the number of points balance by members with tier status j and segment k at the beginning of qualifying period t is given by the product of the number of points balance by members with tier status j at the beginning of qualifying period t and the proportion of points balance by members with tier status j and segment k.
(e) Predict the redemption by tier status and segment as follows (for j=1,…,J):
[
]
[
]
⎥ ⎥ ⎥ ⎥ ⎥ ⎥ ⎥ ⎥ ⎥ ⎦ ⎤ ⎢ ⎢ ⎢ ⎢ ⎢ ⎢ ⎢ ⎢ ⎢ ⎣ ⎡ × ⎥⎦ ⎤ ⎢⎣ ⎡ +γ × γ + × γ + = ⎥ ⎥ ⎥ ⎥ ⎥ ⎥ ⎥ ⎥ ⎥ ⎦ ⎤ ⎢ ⎢ ⎢ ⎢ ⎢ ⎢ ⎢ ⎢ ⎢ ⎣ ⎡ kj j j k j j k j j k j 2 j j j 2 j 1 j j j 1 j j k j 2 j 1 j pr t a t n . . . pr t a t n pr t a t n t r . . . t r t r ) ( ) ( ) ( ) ( ) ( ) ( ) ( ) ( ) ( 2 2 1 1 (5) where, 0≤γkj ≤1Relation (5) stipulates that the number of points redeemed by members with tier status j and segment k during the qualifying period t is given by the sum of two products. In one hand, the product of the number of points balance by members with tier status j and segment k at the beginning of qualifying period t and the proportion of points redeemed by members with tier status j and segment k. In the other hand, the product of the number of points accrued by members with tier status j during the qualifying period t and the proportion of points redeemed by members with tier status j and segment k.
(f) Compute the state variables of redemption per tier status during a given qualifying period as follows:
( )
t r (t) r (t) ... r (t)rj = 1j + j2 + + jk , j=1,…,J (6) Relation (6) stipulates that the redemption per tier status during a given qualifying period is given by the sum, over all segments, of the redemption per tier status and segment during a given qualifying period. (g) Compute the state variables of liability per tier status at the end of a qualifying period as follows:
(t) r (t) a t n t nj( )= j( )+ j j , j=1,…,J (7) Relation (7) stipulates that the number of points balance (liability) by members with tier status j remaining at the end of qualifying period t is equal to the number of points balance available at the beginning of qualifying period t plus the number of points accrued by members with tier status j during the qualifying period t minus the number of points redeemed by members with tier status j during the qualifying period t.
(h) Compute the total liability at the end of a qualifying period as follows:
( )
t n (t) n (t) ... n (t)n = 1 + 2 + + J (8)
Relation (8) stipulates that the liability at the end of qualifying period t is equal to the sum, over all tiers, of the liability per tier status at the end of qualifying period t.
5 Illustrative Example
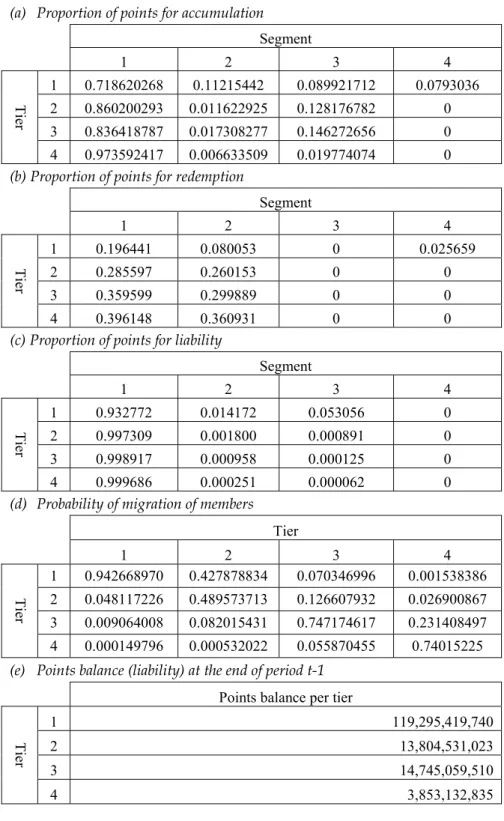
To illustrate our approach, let’s apply our predictive model to the data shown in Table 1, which are derived from the descriptive statistic analyses of 5 years historical data of a real-life LRP in the airline industry (frequent flyer program). The customers for the LRP company are classified at the beginning of each qualifying period of a given year into 4 tiers status (i.e., J = 4), based on their accumulation activities in the previous period. The customers in a given tier status were also divided into 4 segments (i.e., kj = 4, j=1,…,J) based on the minimum number
of points (x) required for them to qualify for redemption and based on whether or not they are new "entrants" into the LRP program. These segments are defined as follows: (1) existing members with more than x points balance at the beginning of the
qualifying period; (2) existing members with less than x points balance at the beginning of the period, but eligible for redemption; (3) existing members with less than x points balance at the beginning of the period, but not eligible for redemption; (4) new members joining the program. Members in segment (1) are, per default, eligible for redemption, since their points balance is higher than the minimum threshold value (x) required to apply for redemption. Members in segment (2) are expected to accumulate enough points during the period, so they can become eligible for redemption. Finally, members in segment (3) are not expected to accumulate enough points during the period to become eligible for redemption. In Table 1, our analysis to derive the estimation of the transition probabilities pij is similar to that of
Bartholomew [14] for stochastic processes in discrete time. It consists of taking the ratio over several time intervals of the total flow of members’ points from tier status i to tier status j to the total stock (i.e.,
members’ points) in tier status i. These estimators are the maximum likelihood estimators. In the study, it was assumed that pij is time-invariant over the
planning horizon period. Note that this assumption can be verified using the constancy tests described in [14]. The other data in Table 1, in exception of the points balance (liability) at the end of period t-1, were derived in the similar manner. Finally, the set of data about the points balance (liability) at the end of period t-1 was directly obtained from the members’ status at the time of the analysis.
At this stage, it is worthwhile to stress that although tiers and segments are defined in terms of members, the state variables (accumulation, redemption, and liability) are defined in terms of members’ points. Therefore, without loss of generality, our approach involves predicting these state variables at the aggregate level, i.e., no individual members are considered. We set x = 15 000 points.
Insert Table 1 Here
Assuming that the predictions of accumulation per tier status (in points) are as follows: a1(t) =
28,715,820,624; a2(t) = 5,617,136,543; a3(t) =
8,737,767,956; and a4(t) = 2,496,505,130. These
forecasts were obtained with the use of three exponential smoothing approaches (Holt-Winters double exponential smoothing approach, multiplicative Winters’ approach, and no trend Winters’ approach). In order to increase the sampling, monthly forecasts were instead considered and then summed up to obtain annual forecasts. Our modeling approach yields the following results (some
minor differences in number due to rounding errors are possible):
(a) number of points accrued by members with a given tier status and segment (as per relation (2)): 960 2,277,267, ) t ( a 742 2,582,175, ) t ( a 211 , 606 , 220 , 3 ) t ( a 711 , 770 , 635 , 20 ) t ( a 4 1 3 1 2 1 1 1 ⎥ ⎥ ⎥ ⎥ ⎥ ⎥ ⎦ ⎤ ⎢ ⎢ ⎢ ⎢ ⎢ ⎢ ⎣ ⎡ = = = = 0 ) t ( a 6 719,986,48 ) t ( a 5,287,555 6 ) t ( a 503 , 862 , 831 , 4 ) t ( a 4 2 3 2 2 2 1 2 ⎥ ⎥ ⎥ ⎥ ⎥ ⎥ ⎦ ⎤ ⎢ ⎢ ⎢ ⎢ ⎢ ⎢ ⎣ ⎡ = = = = 0 ) t ( a 524 1,278,096, ) t ( a 51,235,710 1 ) t ( a 275 , 433 , 308 , 7 ) t ( a 4 3 3 3 2 3 1 3 ⎥ ⎥ ⎥ ⎥ ⎥ ⎥ ⎦ ⎤ ⎢ ⎢ ⎢ ⎢ ⎢ ⎢ ⎣ ⎡ = = = = 0 ) t ( a 49,366,078 ) t ( a 6,560,589 1 ) t ( a 463 , 578 , 430 , 2 ) t ( a 4 4 3 4 2 4 1 4 ⎥ ⎥ ⎥ ⎥ ⎥ ⎥ ⎦ ⎤ ⎢ ⎢ ⎢ ⎢ ⎢ ⎢ ⎣ ⎡ = = = =
(b) Points balance per tier status at the beginning of qualifying period t (after taking into account the migration flow of members between tiers (as per relation (3)): 366 3,700,932, ) t ( n ,088 14,122,261 ) t ( n 316 4,468,994, 1 ) t ( n 339 , 955 , 405 , 119 ) t ( n 4 3 2 1 ⎥ ⎥ ⎥ ⎥ ⎥ ⎥ ⎦ ⎤ ⎢ ⎢ ⎢ ⎢ ⎢ ⎢ ⎣ ⎡ = = = =
(c) Points balance per tier status and segment at the beginning of qualifying period t (as per relation (4)): 0 ) 1 t ( n 678 6,335,242, ) t ( n 88 ,692,180,8 1 ) t ( n 773 , 531 , 378 , 111 ) t ( n 4 1 3 1 2 1 1 1 ⎥ ⎥ ⎥ ⎥ ⎥ ⎥ ⎦ ⎤ ⎢ ⎢ ⎢ ⎢ ⎢ ⎢ ⎣ ⎡ = − = = = 0 ) t ( n 12,888,602 ) t ( n 6,040,997 2 ) t ( n 716 , 064 , 430 , 14 ) t ( n 4 2 3 2 2 2 1 2 ⎥ ⎥ ⎥ ⎥ ⎥ ⎥ ⎦ ⎤ ⎢ ⎢ ⎢ ⎢ ⎢ ⎢ ⎣ ⎡ = = = = 0 ) t ( n 1,771,128 ) t ( n 3,525,938 1 ) t ( n 023 , 964 , 106 , 14 ) t ( n 4 3 3 3 2 3 1 3 ⎥ ⎥ ⎥ ⎥ ⎥ ⎥ ⎦ ⎤ ⎢ ⎢ ⎢ ⎢ ⎢ ⎢ ⎣ ⎡ = = = = 0 ) t ( n 230,542 ) t ( n 30,373 9 ) t ( n 451 , 771 , 699 , 3 ) t ( n 4 4 3 4 2 4 1 4 ⎥ ⎥ ⎥ ⎥ ⎥ ⎥ ⎦ ⎤ ⎢ ⎢ ⎢ ⎢ ⎢ ⎢ ⎣ ⎡ = = = =
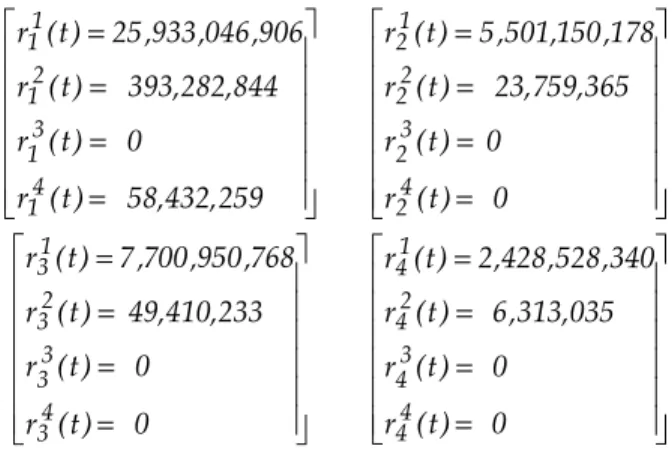
(d) Points redeemed per tier status and per segment during the qualifying period t (as of relation (5), where γkj =1): 259 58,432, ) t ( r 0 ) t ( r 93,282,844 3 ) t ( r 906 , 046 , 933 , 25 ) t ( r 4 1 3 1 2 1 1 1 ⎥ ⎥ ⎥ ⎥ ⎥ ⎥ ⎦ ⎤ ⎢ ⎢ ⎢ ⎢ ⎢ ⎢ ⎣ ⎡ = = = = 0 ) t ( r 0 ) t ( r 3,759,365 2 ) t ( r 178 , 150 , 501 , 5 ) t ( r 4 2 3 2 2 2 1 2 ⎥ ⎥ ⎥ ⎥ ⎥ ⎥ ⎦ ⎤ ⎢ ⎢ ⎢ ⎢ ⎢ ⎢ ⎣ ⎡ = = = = 0 ) t ( r 0 ) t ( r 9,410,233 4 ) t ( r 768 , 950 , 700 , 7 ) t ( r 4 3 3 3 2 3 1 3 ⎥ ⎥ ⎥ ⎥ ⎥ ⎥ ⎦ ⎤ ⎢ ⎢ ⎢ ⎢ ⎢ ⎢ ⎣ ⎡ = = = = 0 ) t ( r 0 ) t ( r ,313,035 6 ) t ( r 340 , 528 , 428 , 2 ) t ( r 4 4 3 4 2 4 1 4 ⎥ ⎥ ⎥ ⎥ ⎥ ⎥ ⎦ ⎤ ⎢ ⎢ ⎢ ⎢ ⎢ ⎢ ⎣ ⎡ = = = =
(e) Points redeemed per tier status during the qualifying period t (as per relation (6)):
375 2,434,841, ) t ( r 001 7,750,361, ) t ( r 42 ,524,909,5 5 ) t ( r 008 , 762 , 384 , 26 ) t ( r 4 3 2 1 ⎥ ⎥ ⎥ ⎥ ⎥ ⎥ ⎥ ⎦ ⎤ ⎢ ⎢ ⎢ ⎢ ⎢ ⎢ ⎢ ⎣ ⎡ = = = =
(f) Points balance per tier status at the end of qualifying period t (as per relation (7)):
122 3,762,596, ) t ( n ,043 15,109,668 ) t ( n 317 4,561,221, 1 ) t ( n 955 , 013 , 737 , 121 ) t ( n 4 3 2 1 ⎥ ⎥ ⎥ ⎥ ⎥ ⎥ ⎥ ⎦ ⎤ ⎢ ⎢ ⎢ ⎢ ⎢ ⎢ ⎢ ⎣ ⎡ = = = =
(g) Points balance at the end of qualifying period t (as per relation (8)):
436 , 499 , 170 , 155 ) t ( n = 6 Real-life Implementation
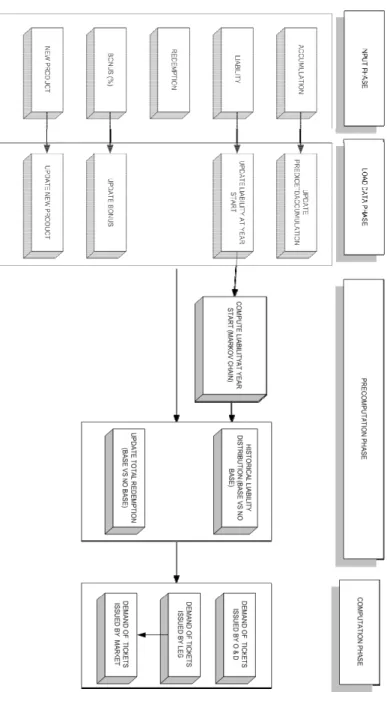
To facilitate use and deployment considerations in the context of a frequent flyer program (i.e., an airline industry based LRP), the modeling procedure described in this paper was embedded in a decision support system and implemented using Visual Basic Application (VBA) on Microsoft Excel®. Figure 2
presents some of the components of such a decision support system. Its implementation requires a procedure for converting forecasts for redemption in reward types, demand by market, etc. To that end, one may use point estimates from historical data of demand by market or demand by origin & destination (O&D).
In Figure 2, the input phase allows the user to introduce, for a selected tier status, changes for accumulation, redemption, liability, percentage for bonus points, and new products (e.g., promotions for a special event). The load data phase consists of updating the worksheets were changes have been made. The pre-computation phase consists of predicting the liability per tier status at the beginning of each qualifying period, the redemption during each qualifying period, and the liability at the end of each qualifying period. The computation phase consists of predicting, using the appropriate distribution, the demand of awards by market (e.g., domestic, south, etc.) or by origin and destination.
Insert Figure 2 Here
The decision support system was used with the data shown in the illustrative example to predict the redemption as well as the number of rewards from the reward codes which represent 80% of the historical demand. Table 2 shows the results of model prediction and actual outcomes from the system for a period up to 5 months (note: the model generates annual forecasts, which are in turn translated into monthly forecasts). Variance to actual redemption Variance to actual rewards issued First quarter 0.76% -0.84% 4th Month 1.24% N/A 5th month -2.63% N/A
Year up to the end of
the 5th month 0.15% N/A
N/A = actual outcomes not available
Table 2: Summary results of comparison of model prediction and actual observations
As per the preliminary outcomes shown in Table 2, findings from the model seem to be very promising given the small forecast error observed so far. However, further testing is required in order to take full advantage of the predictive model discussed in this paper and to assess its quality of solution.
7 Conclusions
We have proposed an aggregate model for predictions of redemption and liability in LRPs, and provided a brief numerical illustration of the proposed approach. We also discussed a real-implementation of the methodology to facilitate use and deployment considerations in the context of a frequent flyer program (i.e., an airline industry based LRP). We are currently in the process of testing the approach using further real-life data to assess its quality of solution.
We have assumed in this paper that the probabilities of transition remain time-invariant over the short and medium range time frames. While the constancy tests described in [14] can be used to verify this assumption, it is not guaranteed that the assumption will always hold. In such case the setting up of such time frames may be challenging in practice. Moreover, given the inputs parameters of the predictive model (probability of migration of members, proportion of points accrued/redeemed/balance over tiers and customer segments), its applicability in practice has limits when there is no or insufficient historical data (e.g., when introducing a new LRP).
The model discussed in this paper can be expanded to accommodate more complex situations, such as when there are multiple products for example, or when points have limited duration. We are currently exploring such developments, as well as the development of a disaggregate model (at the individual member level). We are also considering an extended version consisting of modeling the probabilities of transition of members as decision variables instead. The estimates of redemption and liability can then be derived in each period given the probabilities of migration. However, such study must be done at the disaggregate level, given the large variability that may exist between members in a given state of nature (tier status) in terms of points accrued/redeemed during a qualifying period as well as in terms of balance of points (liability) at the beginning of a qualifying period.
References:
[1] “Funny Money,” Economist, December 24, 2005, 102-103.
[2] Berman, B. [2006]. Developing an effective customer loyalty program. California Management Review 49(1) 123-148.
[3] Keh, H. T. and Lee, Y. H.: [2006]. Do reward programs build loyalty for services? The moderating effect of satisfaction on type and timing of rewards, Journal of Retailing 82(2), pp 127-136.
[4] Kadar, M. and Kotanko, B. [2001]. Designing loyalty programs to enhance value growth, Mercer on Transport & Travel 8(2) pp 28-33. [5] Suzuki, Y. [2003]. Airline frequent flyer
programs: equity and attractiveness. Transportation Research, Part E 39 pp 289-304. [6] Kim, B. D., Shi, M., and Srinivasan, K. [2001].
Reward Programs and Tacit Collusion, Marketing Science 20(4) pp 99-120.
[7] Kim, B.D., Shi, M., and Srinivasan, K. [2004]. Managing capacity through reward programs, Management Science 50(4) pp 503-520.
[8] Sharp, B. and Sharp, A. [1997]. Loyalty programs and their impact on repeat-purchase loyalty patterns. International Journal of Research in Marketing 14 pp 473-486.
[9] Lacey, R. and Sneath, J. Z. [2006]. Customer loyalty programs: are they fair to consumers? Journal of Consumer Marketing 23(7) pp 458-464.
[10] Terui, N. and Dahana, W. D. [2006]. Price customization using price thresholds estimated from scanner panel data. Journal of Interactive Marketing 20(3-4) pp 58-70.
[11] Ziliani, C. [2006]: Price Target promotions: how to measure and improve promotional effectiveness through individual customer information. Journal of Targeting, Measurement and Analysis for Marketing 14(3) pp 249-259.
[12] Labbi, A. and Berrospi, C. [2007]: Optimizing marketing planning and budgeting using Markov decision processes. IBM Journal of Research & Development, 51(3/4) pp 421-431. [13] Shen, Z. M. and Su, X. [2007]: Customer
behavior modeling in revenue management and auctions: a review and new research opportunities.
[14] Bartholomew, D. J. [1977]: The analysis of data arising from stochastic processes. In O’Muircheartaigh & Payne (eds): The analysis of survey data – model fitting. John Wiley & Sons, New York, Chapter 5, pp145-174.
(a) Proportion of points for accumulation Segment 1 2 3 4 Tier 1 0.718620268 0.11215442 0.089921712 0.0793036 2 0.860200293 0.011622925 0.128176782 0 3 0.836418787 0.017308277 0.146272656 0 4 0.973592417 0.006633509 0.019774074 0
(b) Proportion of points for redemption
Segment
1 2 3 4
Tier 1 0.196441 0.080053 2 0.285597 0.260153 0 0 0.025659 0
3 0.359599 0.299889 0 0
4 0.396148 0.360931 0 0
(c) Proportion of points for liability
Segment
1 2 3 4
Tier 1 0.932772 0.014172 0.053056 2 0.997309 0.001800 0.000891 0 0
3 0.998917 0.000958 0.000125 0
4 0.999686 0.000251 0.000062 0
(d) Probability of migration of members Tier
1 2 3 4
Tier 1 0.942668970 0.427878834 0.070346996 0.001538386 2 0.048117226 0.489573713 0.126607932 0.026900867
3 0.009064008 0.082015431 0.747174617 0.231408497 4 0.000149796 0.000532022 0.055870455 0.74015225 (e) Points balance (liability) at the end of period t-1
Points balance per tier
Tier 1 119,295,419,740 2 13,804,531,023
3 14,745,059,510 4 3,853,132,835