Lifting Australian performance in mathematics
Dr Sue Thomson
Australian Council for Educational Research
Dr Sue Thomson is the Director of the Educational Monitoring and Research Division at the Australian Council for Educational Research, and a ChiefInvestigator in the Science of Learning Research Centre, in which ACER is a lead institution. She is also the Research Director for the National Surveys research program at ACER, overseeing Australia’s participation in all international and national sample surveys.
Dr Thomson has also fulfilled the roles of National Research Coordinator for Australia in the IEA Trends in International Mathematics and Science Study (TIMSS) since 2002, National Project Manager for Australia in the OECD Programme for International Student Assessment (PISA) since 2004, and National Research Coordinator for Australia in the IEA Progress in International Reading Literacy Study (PIRLS) since 2008. In these roles she has contributed to the development of the instruments
and questionnaires, particularly for TIMSS, where she is a member of the Questionnaire Review Committee. Dr Thomson’s research at ACER has involved extensive analysis of large-scale national and international data sets – the Longitudinal Surveys of Australian Youth (LSAY) as well as TIMSS and PISA – and she is also involved in several projects involving analysis of the longitudinal data collection associated with the PISA surveys. She was engaged as an expert writer on the National Numeracy Review, and has consulted with a variety of government departments at both Commonwealth and state level, as well as with the Catholic Education Commission, on a variety of data analysis projects related to TIMSS and PISA.
Abstract
One in five Australian 15-year-old students was found to be failing to achieve what the OECD describes as a basic level of mathematical literacy to enable students to actively participate in 21st century life. In many cases, these students are also unmotivated and disengaged with schooling, perceive their school experience in a negative light, and have low aspirations for the future. In a disproportionate
number of cases, low-achieving students come from low socio-economic backgrounds, have an Indigenous background, and live in rural areas. This paper investigates the relationship of these and other demographic and educational background variables with being a low achiever, using data from PISA 2012. Lifting achievement in mathematics may also improve motivation and engagement.
In late 2016, new reports on student performance in the 2015 Trends in International Mathematics and Science Study (TIMSS) and the 2015 Programme for International Student Assessment (PISA) will be released. TIMSS focuses on Year 4 and Year 8 and tests students in mathematics and science. PISA focuses on mathematics, science and reading literacy for students who are 15 years old. Both studies have now been carried out for a substantial period of time – TIMSS every four years since 1995 and PISA every three years since 2000. Both studies show that Australia’s scores in maths and science are not what we would want them to be. TIMSS has shown scores that have stagnated over the past 20 years, PISA that there has been slow but significant decline in Australia’s scores in maths and reading literacy. It has been argued that these results are due to Australia’s long ‘tail’ of underperformance (for example, Masters, 2016), particularly in the area of STEM (Office of the Chief Scientist, 2013), and while this performance is not different to that of many other countries, Australia does have a substantial proportion of students who are not achieving a standard that the OECD deems is sufficient to ensure active participation in the 21st century economy (OECD, 2014, p. 68). There are many costs to having a substantial pool of low achievers in a country. Students who perform poorly at school are more likely not to complete school at all and to have poorer outcomes in life. OECD and Australian research has found that poor proficiency in numeracy and literacy not only means a much lower likelihood of a well-paying and rewarding job, but also poorer health outcomes and a lower level of participation in social and political life (OECD, 2013). As well as these negative outcomes for the individual, economic modelling carried out for the OECD by Hanushek and Woessman (OECD, 2010) argued that poor performance in tests such as PISA carries negative consequences for the whole country. They argue, ‘Nations with more human capital tend to continue to make greater productivity gains
than nations with less human capital’ (p. 11). One of the models they explore in their OECD report involves bringing all students in a country up to a minimum skill level of 400 PISA score points. If this were achieved, Australia would see an increase of 225 per cent in GDP, which would have a value to the economy of around 3 billion Australian dollars (OECD, 2010, p. 26).
What do high- and
low-performing mean?
While the mean scores on PISA provide a comparison of student performance on a numerical level, proficiency levels provide a description of the knowledge and skills that students are typically capable of displaying in each of the assessment areas. The proficiency scales typically span Level 1 (the lowest proficiency level) to Level 6 (the highest). Descriptions of each of these levels are based on the framework-related cognitive demands imposed by tasks that are located within each level. The skills and knowledge required to successfully complete these tasks can then be used as characterisations of the substantive meaning of each level.
PISA reporting generally refers to ‘high performers’ as being those students achieving proficiency Level 5 or 6; ‘low performers’ as those not achieving proficiency Level 2. Level 2 has been defined internationally as a baseline proficiency level and defines the level of performance on the PISA scale at which students begin to demonstrate the competencies that will enable them to actively participate in life situations. Reflecting this, the current study assigned students into groups based on their mathematical literacy proficiency level, and this report looks at differences between the high and low performers. Table 1 shows summary descriptions for low and high performers. A full description of all six proficiency levels for all subject domains is available in Thomson, De Bortoli & Buckley (2013).
Table 1 Basic descriptors of high and low performance on PISA
Achievement level What students can typically do at this level
High performers Students are capable of complex mathematical tasks requiring broad, well-developed thinking and reasoning skills. They can work with models for complex situations, reflect on their work and can formulate and communicate their findings.
Low performers Students can use basic mathematical algorithms, formulate procedures or conventions, and can reason mathematically. They can make literal interpretations of the results of their calculations.
Australia’s high (and low)
performers
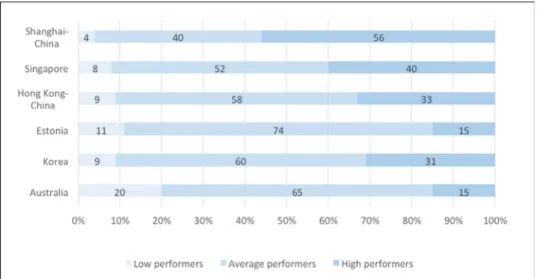
Australian students’ average score in mathematical literacy in PISA 2012 was 504 points. While this was significantly higher than the OECD average of 494 score points, it masks the fact that around 15 per cent of students are performing very well on PISA, and about 20 per cent of students are not meeting basic OECD standards. Compared to the highest-achieving countries, Australia has a much higher proportion of students not performing at the base level and, compared to most of the highest-performing countries, a substantially lower proportion of students performing at the high proficiency levels. Figure 1 shows the proportion of high, average and low performers for Australia and the top five performers in PISA 2012. Figure 2 provides an example of a Level 2 PISA item that a low performer would be likely to not answer correctly. One in five Australian students would not be able to provide the correct answer, in comparison to just four per cent of students in Shanghai-China.
Helen the cyclist
Helen has just got a new bike. It has a speedometer which sits on the handlebar.
The speedometer can tell Helen the distance she travels and her average speed for the trip.
On one trip, Helen rode 4km in the first 10 minutes and then 2km in the next 5 minutes.
Which one of the following statements is correct?
A. Helen’s average speed was greater in the first 10 minutes than in the next 5 minutes
B. Helen’s average speed was the same in the first 10 minutes and in the next 5 minutes
C. Helen’s average speed was less in the first 10 minutes than in the next 5 minutes
D. It is not possible to tell anything about Helen’s average speed from the information given.
Source OECD, 2014
Figure 2 Example of a PISA item at proficiency Level 2
The PISA 2012 average represented a significant decline of 20 score points from when mathematical literacy was first measured in PISA 2003. This decline is shown in a combination of a significant decrease in the proportion of high achievers and a significant increase in the proportion of low achievers (see Figure 1). In terms of actual numbers, the bar for low achievers in 2012 in Figure 3 represents about 57 000 Australian students.
Who are Australia’s
low-performing students?
Who and where are Australia’s low performers? Table 2 shows the proportion of students at each level for the background variables collected in PISA. What is evident from this summary is that while there are some gender differences, these pale into insignificance when compared to differences by Indigenous background, by geographic location, by socio-economic background, and by school sector.
It is clear from Table 2 that low performers come from all manner of backgrounds; however, they are disproportionally from an Indigenous background, from a low socio-economic background, attend rural schools, and attend government schools. Interestingly, students who have a language background other than English fall into two groups: a group of low performers, and another group of high performers.
Figure 3 Percentage of students at mathematics proficiency levels, PISA 2003 and PISA 2012 Table 2 Proportion of low, average and high performing students, PISA 2012, by background variables
Low performers Average performers High performers
Males 18 65 17 Females 20 67 13 Indigenous 48 49 3 Non-Indigenous 18 66 16 Metropolitan 18 65 17 Provincial 22 68 10 Rural 37 57 6 Government 25 63 13 Catholic 14 71 15 Independent 9 68 23
Lowest quartile SES 33 61 6
Second quartile SES 22 68 10
Third quartile SES 13 69 18
Highest quartile SES 8 66 27
Australian-born 19 68 13
1st Generation 16 64 20
Foreign-born 20 62 18
Single-parent family 21 67 12
Two-parent family 17 67 16
English spoken at home 18 68 14
Relationships with achievement
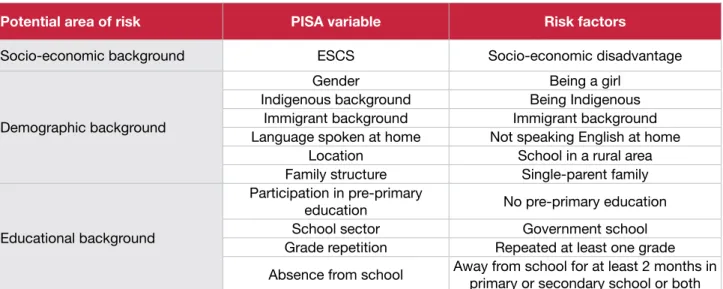
Of course, a student’s performance is affected by a combination and accumulation of factors andexperiences at home and at school, and while social and demographic variables do not determine achievement, they provide opportunities that influence a student’s success in the education system. Based on the data in Table 2, Table 3 shows the potential areas of risk for mathematical literacy, specifically for the Australian PISA data.
Binary logistic regression models were constructed to examine what factors differentiated the sample members who did not have a successful outcome (that is, low performers) from those sample members with more positive outcomes. Table 4 shows the results of the logistic regression.
Table 3 Student background and low performance – risk factors
Potential area of risk PISA variable Risk factors
Socio-economic background ESCS Socio-economic disadvantage
Demographic background
Gender Being a girl
Indigenous background Being Indigenous Immigrant background Immigrant background Language spoken at home Not speaking English at home
Location School in a rural area
Family structure Single-parent family
Educational background
Participation in pre-primary
education No pre-primary education
School sector Government school
Grade repetition Repeated at least one grade Absence from school Away from school for at least 2 months in primary or secondary school or both
Table 4 Logistic regression model for low achievement
Predictor Comparison group B SE(B) eB
Low ESCS*** High ESCS -1.43 0.10 4.2
Girl*** Boy -0.34 0.08 1.4
Indigenous*** Non-Indigenous -0.99 0.11 2.7
Immigrant background Born in Australia -0.11 0.12
-Language at home not English English spoken at home -0.08 0.11
-Single-parent family Two-parent family 0.05 0.12
-Rural school Metropolitan or provincial school -0.07 0.32
-Did not attend pre-primary*** Attended at least one year of pre-primary -0.63 0.16 1.9 Repeated at least one grade*** Never repeated a grade -0.92 0.12 2.5 Attends a government school*** Attended an independent or Catholic school -0.56 0.11 1.8 Absent for 2 months at least once*** Never absent for large block of time -0.61 0.08 1.8 Asterisks denote significant results
In this model, having an immigrant background, speaking a language other than English at home, attendance at a rural school and being a member of a single-parent family did not have a significant influence on being in the low achievement group. Seven of the factors described in this model were significant. Holding other factors constant:
• Disadvantage was found to have the strongest relationship with performance, with a
socio-economically disadvantaged student more than four times as likely as a socio-economically advantaged student to be a low performer.
• Girls were about one and a half times as likely as boys to be low performers.
• Indigenous students were almost three times as likely as non-Indigenous students to be low performers.
• Students who did not attend pre-primary education were about twice as likely to be in the low
performers group than those who had attended pre-primary education for at least one year.
• Students who had repeated at least one grade were two and a half times as likely to be a low performer than those who had not.
• Students who attended a government school were almost twice as likely to be a low performer than those who attended an independent or Catholic school.
• Students who had missed at least two months of school at some stage of their school lives were also almost twice as likely to be a low performer than those who had never done so.
Relationships with engagement
and motivation
On every indicator of motivation and engagement used in PISA, low-performing students are much more negative than their high-achieving counterparts. They are less likely to aspire to university study, more likely to truant or skip classes, and perceive their classrooms and schools in a different light.
Conclusions
These findings are important for policy. One in five 15-year-old students in Australia fails to achieve the level described by the OECD as the minimum needed for active participation in 21st century life. The benefits of substantially decreasing the proportion of students at this level vastly outweigh the cost of doing so. At the individual level, higher achievement leads to better job opportunities and better life outcomes. For the community as a whole, raising achievement for the lowest achievers brings many benefits, including higher
levels of GDP. A number of countries – Brazil, Germany, Italy, Mexico, Poland, Portugal, Russian Federation, Tunisia and Turkey – all decreased their proportion of low achievers in mathematics, showing that it is possible, with the will and the right policies, to change things.
References
Masters, G. (2016). The ‘long tail’ of underachievement. https://www.teachermagazine.com.au/geoff-masters/ article/the-long-tail-of-underachievement
OECD. (2010). The high cost of low educational performance. Paris: OECD Publishing.
OECD. (2013). OECD skills outlook 2013: First results from the survey of adult skills. Paris: OECD Publishing. http://dx.doi.org/10.1787/9789264204256-en
OECD. (2014). PISA 2012 Results: What students know and can do – Student performance in mathematics, reading and science (Volume I, Revised Edition, February 2014). Paris: OECD Publishing. https:// www.oecd.org/pisa/keyfindings/pisa-2012-results-volume-I.pdf
Office of the Chief Scientist. (2012). Health of Australian Science. Australian Government. http://www. chiefscientist.gov.au/2012/05/health-of-australian-science-report-2
Office of the Chief Scientist. (2013). STEM: Country comparisons. http://www.chiefscientist.gov.au/ wp-content/uploads/STEM-recommendations-for-PMSEIC.pdf
Thomson, S., De Bortoli, L. & Buckley, S. (2013). PISA 2012: How Australia measures up. Camberwell: ACER.