Glyndŵr University
Glyndŵr University Research Online
Computing
Computer Science
4-1-2007
Robustness of HEAF(2) for Estimating the
Intensity of Long-Range Dependent Network
Traffic
Karim Mohammed Razaul
Vic Grout
Glyndwr University, [email protected]
Follow this and additional works at:
http://epubs.glyndwr.ac.uk/cair
Part of the
Computer and Systems Architecture Commons
,
Digital Communications and
Networking Commons
,
Hardware Systems Commons
, and the
Systems and Communications
Commons
This Conference Paper is brought to you for free and open access by the Computer Science at Glyndŵr University Research Online. It has been accepted for inclusion in Computing by an authorized administrator of Glyndŵr University Research Online. For more information, please contact
Recommended Citation
Mohammed Rezaul, K., and Grout, V. (2007) ‘Robustness of HEAF(2) for Estimating the Intensity of Long-Range Dependent Network Traffic’. [Paper presented to the Second IEEE Information and Communication Technologies International Conference (ICTIS'07), held at Fez, Morocco, 3rd -5th April 3-5 2007].
Robustness of HEAF(2) for Estimating the Intensity of Long-Range
Dependent Network Traffic
Abstract
The intensity of Long-Range Dependence (LRD) for communications network traffic can be measured using
the Hurst parameter. LRD characteristics in computer networks, however, present a fundamentally different
set of problems in research towards the future of network design. There are various estimators of the Hurst
parameter, which differ in the reliability of their results. Getting robust and reliable estimators can help to
improve traffic characterization, performance modelling, planning and engineering of real networks. Earlier
research [1] introduced an estimator called the Hurst Exponent from the Autocorrelation Function (HEAF)
and it was shown why lag 2 in HEAF (i.e. HEAF (2)) is considered when estimating LRD of network traffic.
This paper considers the robustness of HEAF(2) when estimating the Hurst parameter of data traffic (e.g.
packet sequences) with outliers.
Keywords
ACF, HEAF(2), LRD, Self-similarity
Disciplines
Computer and Systems Architecture | Digital Communications and Networking | Hardware Systems |
Systems and Communications
Comments
Copyright © ICST 2007. This is the author’s version of the work. It is posted here by permission of ICST for
personal use. Not for redistribution. Copyright © 2007 IEEE. Paper presented to the Second IEEE
Information and Communication Technologies International Conference (ICTIS'07), held at Fez, Morocco,
3rd -5th April 3-5 2007 This material is posted here with permission of the IEEE. Such permission of the IEEE
does not in any way imply IEEE endorsement of any of Glyndŵr University Wrexham's products or services.
Internal or personal use of this material is permitted. However, permission to reprint/republish this material
for advertising or promotional purposes or for creating new collective works for resale or redistribution must
be obtained from the IEEE by writing to [email protected]. By choosing to view this document, you
agree to all provisions of the copyright laws protecting it.
1
Abstract—The intensity of Long-Range Dependence
(LRD) for communications network traffic can be measured using the Hurst parameter. LRD characteristics in computer networks, however, present a fundamentally different set of problems in research towards the future of network design. There are various estimators of the Hurst parameter, which differ in the reliability of their results. Getting robust and reliable estimators can help to improve traffic characterization, performance modelling, planning and engineering of real networks. Earlier research [1] introduced an estimator called the Hurst Exponent from the Autocorrelation Function (HEAF) and it was shown why lag 2 in HEAF (i.e. HEAF (2)) is considered when estimating LRD of network traffic. This paper considers the robustness of HEAF(2) when estimating the Hurst parameter of data traffic (e.g. packet sequences) with outliers.
Index Terms—ACF, HEAF(2), LRD, Self-similarity.
I. INTRODUCTION
he Long-Range Dependence (LRD) property of traffic fluctuations has important implications on the performance, design and dimensioning of the network [2]. A simple, direct parameter characterizing the degree
of long-range dependence is the Hurst parameter. The
Hurst exponent (or Hurst parameter, H), which more than a half-century ago was proposed for analysis of long-term storage capacity of reservoirs [3], is nowadays used to
measure the intensity of LRD in network traffic. A
number of methods have been proposed to estimate the Hurst parameter. Some of the most popular include the aggregated variance time (V/T) [4], Rescaled-range (R/S) [2, 3], Higuchi method [5], wavelet-based method [6, 7] although there are many othrs. In all these methods, H is calculated by taking the slope from a log-log plot. So far the wavelet-based Hurst parameter has acquired popularity in estimating LRD traffic. However the study [8] explores the advantages and limitations of wavelet estimators and found that a traffic trace with a number of deterministic shifts in the mean rate results in steep wavelet spectrum which leads to overestimating the Hurst parameter. The intensity of long-range dependence is measured for file size or document size [9], packet counts (number of packets per unit time) [10, 11, 12], interarrival time [13, 14], frame size [15], connection size [16], packet length [17], number of bytes per unit time [2], Bit or byte rate [18] and so on.
Manuscript submitted on November 20, 2006. This work is a part of PhD research work undertaken by Karim Mohammed Rezaul. He is with the school of computing and communications Technology and Centre for Applied Internet Research (CAIR), NEWI, University of Wales, UK (Tel: +44-07960272886, email: [email protected]). Vic Grout, Reader in Computer Science and the leader of Centre for Applied Internet Research (CAIR), University of Wales, NEWI Plas Coch Campus, Mold Road, Wrexham, LL11 2AW, UK (Tel: +44(0)1978293203 , Fax: +44(0)1978293168, email: [email protected]).
This paper continues work on the new estimator introduced earlier which is named Hurst Exponent by
Autocorrelation Function (HEAF) [1]. HEAF estimates H
by a process which is simple, quick and reliable. In order to investigate the robustness of HEAF(2), two different types of simulation studies were performed. The first one is using fractional Gaussian noise (fGn) sequences generated by the Dietrich-Newsam algorithm [19, 20], which generates exact self-similar sequences. The second one is using a fractional autoregressive moving average
(FARIMA) process [21, 22].Stationarity is assumed for
these kinds of classical models (FARIMA and fGN) because it is convenient from a theoretical point of view, especially to check the validity of any hypothesis. The sequences generated by these models show a bell -shaped (i.e. Gaussian) curve either exactly or with small variation. However, our concern in this research is to determine whether, in the case that the underlying process is not FARIMA or fGN, HEAF(2) can still capture the long-range dependency of the traffic. We investigate what role HEAF(2) can play to yield an estimate with a good degree of accuracy if the traffic is nonstationary. For instance, if the data traffic possesses outliers, we consider how to estimate H by eliminating these outliers to have satisfactory and reliable information.
The paper is organised as follows. Section II describes the definitions of self-similarity, long-range dependence and autocorrelation function. Section III introduces the HEAF estimator. Section IV describes about the robust versions of autocorrelation function. Finally the results are presented in section V.
II. SELF-SIMILARITY ,LONG-RANGE DEPENDENCE AND AUTOCORRELATION FUNCTION
In general two or more objects having the same characteristics are called self-similarity. A phenomenon that is self-similar looks the same or behaves the same when viewed at different degrees of magnification or different scales on a dimension and bursty over all time scales. Self-similarity is the property of a series of data points to retain a pattern or appearance regardless of the level of granularity used and is the result of long-range dependence in the data series. If a self-similar process is bursty at a wide range of timescales, it may exhibit long-range- dependence. In general lagged autocorrelations are used in time series analysis for empirical stationary tests. Self-similarity manifests itself as long-range dependence (i.e., long memory) in the time series of arrivals. The evidence of very slow, linear decay in the sample lag autocorrelation finction (ACF) indicates the nonstationary behaviour [23]. The research [24] show that Internet traffic is nonstationary.
Long-range-dependence means that all the values at any time are correlated in a positive and non-negligible way with values at all future instants. For a continuous
Robustness of HEAF(2) for Estimating the
Intensity of Long-range Dependent Network Traffic
Karim Mohammed Rezaul, Vic Grout
time process Y =
{
Y( )
t ,t ≥0}
is self-similar if it satisfies the following condition [25]:( )
=a−HY( )
at , ∀a >0, and 0< H <1d t
Y
where H is the index of self-similarity, called Hurst
parameter and the equality is in the sense of finite-dimensional distributions.
The stationary process X is said to be a long-range
dependent process if its autocorrelation function (ACF) is
non-summable [26] meaning that ∑∞ = ∞
∞ − =
k ρk
The details of how ACF decays with k are of interest
because the behaviour of the tail of ACF completely determines its summability. According to [3], X is said to exhibit long-range dependence if
∞ → − − k as H k t L k , ) 2 2 ( ) ( ~ ρ (2.1) where 1 2 1 <
< H and L(.) slowly varies at infinity, i.e.,
, 1 ) ( ) ( lim = ∞ → L t xt L t for all
x
>
0
Equation (2.1) implies that the LRD is characterized by an autocorrelation function that decays hyperbolically rather than exponentially fast.
III. HEAF: A ‘HURST EXPONENT BY
AUTOCORRELATION FUNCTION’ ESTIMATOR
A new estimator has been introduced [1] by extending the approach of Kettani and Gubner [27]. As in [27], for a given observed data Xi (i.e. X1,...,Xn), the sample autocorrelation function can be calculated by the following method: Let ∑ = = n i Xi n n 1 1 ˆ µ (3.1) and
( )
(
)
(
)
n k i X k n i Xi n n k n µ µ γ ˆ 1 ˆ 1 ˆ ∑− + − = − = , (3.2) where k=0,1, 2, ….., n, with σˆn2 =γˆn( )
0 . (3.3)Then the sample autocorrelations of lag k are given by
( )
2 ˆ ˆ ˆ n k n k σ γ ρ = (3.4)(Equations (3.1), (3.2), (3.3) and (3.4) denote the sample mean, the sample covariance, the sample variance and the sample autocorrelation, respectively). A second-order stationary process is said to be exactly second-order self-similar with Hurst exponent 1/2< H <1 if
] 2 ) 1 ( 2 2 2 ) 1 ( [ 5 . 0 k H k H k H k = + − + − ρ (3.5)
From equation (3.5), Kettani and Gubner suggest a moment estimator of H . They consider the case where k =1 and replace
ρ
1 by its sample estimateρ
ˆ
1, as defined in equation (3.4). This gives an estimate for H of the form) 1 ˆ 1 ( log 2 log 2 1 2 1 ˆ = + +ρ e e H (3.6)
Clearly, this estimate is straightforward to evaluate, requiring no iterative calculations. For more details of the properties of this estimator, see Kettani and Gubner [27].
An alternative estimator of H is proposed based upon
equation (3.5), by considering the cases where k>1. Note that the sample equivalent of equation (3.5) can be expressed as . 0 } 2 ) 1 ( 2 2 2 ) 1 {( 5 . 0 ˆ ) ( = − + − + − = H k H k H k k H f ρ (3.7)
Thus, for a given observed
ρ
ˆ
k, k>1, a suitable numerical procedure can be used to solve this equation, and find an estimate of H. This is denoted as a HEAF(k) estimate ofH.
To solve equation (3.7) for H the well-known
Newton-Raphson (N-R) method is used. This requires the derivative of f(H). Here note that k ? 1,
( )
(
) (
)
( ) ( )
(
) (
)
− − + − + + − = ′ H k k H k k H k k H f 2 1 ) 1 log 2 ( 2 ) log 4 ( 2 1 ) 1 log 2 ( 5 . 0 (3.8)Hence, the algorithm to estimate HEAF(k), for any lag k,
consists of the following steps:
1. Compute the sample autocorrelations for lag k of a
given data set by equation (3.4). (Note that
X
i can be denoted as the number of bits, bytes, packets or bit rates observed during thei
th interval. IfX
i is a Gaussian process, it is known as fractional Gaussian noise).2. Make an initial guess of H, e.g. H1 = 0.6, then
calculate H2, H3, H4,….., successively using
) ( / ) ( 1 Hr f Hr f Hr r H + = − ′ , until convergence, to
find the estimate Hˆ for the given lag k. An initial consideration is of the case where k = 2 in equation (3.2); i.e. HEAF(2) is considered first.
One of the major advantages of the HEAF estimator is speed, as the NR-method converges very quickly to a root. There is no general convergence criterion for NR. Its convergence depends on the nature of the function and on the accuracy of the initial guess. Fortunately the form of the function (i.e., equation (3.7)) appears to converge quickly (within at most four iterations) for any initial guess in the range of interest, namely H in (0.2, 1). If an iteration value, Hr is such that f′
( )
Hr ≅0, then one canface “division by zero” or a near-zero number. This will give a large magnitude for the next value, Hr+1 which in
turn stops the iteration. This problem can be resolved by increasing the tolerance parameter in the N-R program. A HEAF(k), for k = 2, …,11, have been considered and no difficulty in finding the root in (0.5, 1) have been encountered.
IV. ROBUST AUTOCORRELATION FUNCT ION
The forecasting of network traffic and Quality of Service (QoS) can be affected by the additive outliers. The sample ACF that was used in HEAF (2) is sometimes controversy. In this research we test the performance of HEAF (2) by using three robust ACF such as Trimmed ACF [28], variance-ratio of differences and sums which is known as D/S variance estimator [29, 30], weighted
3
sample autocorrelation function (shorten as WACF) [31]. Polasek [32] showed in his paper how to eliminate these additive outliers by different robust acf. According to his findings the sample acf (i.e. moment based) was surprisingly ranked as 2 after TACF for eliminating additive outliers. Due to space limitation we only present the results from Trimmed ACF.
The Trimmed ACF can be calculated by the following procedure:
Let
z
(1)≤
z
(2)≤
...
≤
z
(n) be the ordered observations of the given time series z1, z2, …., and zn.Chan and Wei [28] introduced the
α
-trimmed sampleautocorrelation function (shorten as TACF) defined by
)
0
(
ˆ
)
(
ˆ
)
(
ˆ
T T Tk
k
γ
γ
ρ
=
where∑
∑
+ = − + = −−
−
−=
n k t t k t n k t t k t t k t TL
L
L
L
z
z
z
z
k
1 ) ( ) ( 1 ) ( ) ( ) ( ) ()
(
)
(
)
(
ˆ
α α α α α αγ
∑
∑
= ==
n t t t n t tL
L
z
z
1 ) ( ) ( 1 ) (/
α α α and
≤
≥
=
− +otherwise
z
z
or
z
z
if
L
t t g t n g,
1
,
0
( ) ( 1) ) (αwhere
g
=
[
α
n
]
is the integer part ofα
n
and05
.
0
0
≤
α
≤
. Chan and Wei showed that TACF is, ingeneral, very successful in removing the adverse effect of outliers on the estimation of ACF. The parameter called, automatic alpha can be estimated by trimmean filter (TMF) [33, 34].
The procedure for estimating alpha by TMF is as follows:
1. Sort the data in ascending order.
2. Calculate the parameter Q according to the equation below %)] 50 ( %) 50 ( %)] 20 ( %) 20 ( [ L U L U Q − − =
- where U(x%) is the average of the upper x% of the ordered sample and L(x%) is the average of the lower x% of the ordered sample.
- Q is a measure of the departure of the distribution contained in the sample from a normal distribution. - Trim off each tail of the ordered distribution according to the value of the trimmean parameter alpha.
≥
<
<
−
+
≤
=
0
.
2
05
.
0
0
.
2
75
.
1
25
.
0
)
75
.
1
(
*
01
.
0
04
.
0
75
.
1
04
.
0
)
(
Q
Q
Q
Q
Q
α
Note that the alpha parameter given in [33, 34] is modified here for estimating a good degree of accuracy when considering network traffic data. The TMF assumes the distribution to be symmetric, but not necessarily Gaussian. For a pure Gaussian distribution of data, 4 percent of the data is trimmed from each tail of the original sorted distribution. For a given segment of time, a maximum of 5 percent of the data is trimmed off each tail.
V. RESULTS AND DISCUSSION
In [1, 35, 36], the results show that HEAF(2) is an
estimator of H with relatively good bias and mse, when
estimating fractional Gaussian noise or FARIMA processes. Because of its simplicity and reliability it is believed that HEAF (2) can be used for real time network traffic control. Of course, a real process will be unlikely to be exactly an fGn process or even FARIMA process. Indeed, a real process may suffer from a ‘noise’, discrepant values or other outliers. This section presents the robustness of the proposed estimator, HEAF(2), against departures from ideal assumptions.
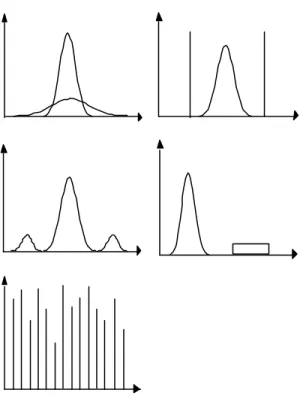
In order to test the robustness of HEAF (2) we generate some noisy sequences by mixing with the data sequences generated by FARIMA (0, d, 0) and fGn processes for a particular Hurst parameter (H). Obviously H will be changed when making noisy data, meaning that the process (FARIMA or fGN) no longer exists as it holds additive outliers. Figure 1 shows a pictorial view of noisy data to be analysed in order to explore the robustness of the HEAF(2).
Fig. 1. Pictorial view of noisy samples (i.e. data with additive outliers)
-5 -4 -3 -2 -1 0 1 2 3 4 0 200 400 600 800 1000 1200 1400 -20 0 20 40 60 80 100 0 200 400 600 800 1000 1200 1400 -2 -1 0 1 2 3 4 0 200 400 600 800 1000 1200 1400
Fig. 2. Top left figure - Data generated by FARIMA (0,d, 0) process for H =0.6 (H measured by HEAF (2) = 0.585), N = 16384. Top right figure – generated Noisy sample (measured H = 0.8993). Bottom figure - H = 0.576 (after elimination of the outliers) where alpha = 0.048
-5 -4 -3 -2 -1 0 1 2 3 4 0 200 400 600 800 1000 1200 1400 -40 -30 -20 -10 0 10 20 30 40 0 200 400 600 800 1000 1200 -2.50 -2 -1.5 -1 -0.5 0 0.5 1 1.5 2 2.5 200 400 600 800 1000 1200 1400
Fig. 3. Top left figure - Data generated by fGN process for H =0.6 (H measured by HEAF (2) = 0.795), N = 16384. Top right figure – generated Noisy sample (measured H = 0.556). Bottom figure - H = 0.77 (after elimination of the outliers) where alpha = 0.048
In Figure 2, the top left figure shows a histogram of FARIMA (0, d, 0) process with H = 0.6. The estimated H by HEAF(2) is 0.585. The top right figure represents a histogram for a noisy samples generated by mixing with FARIMA (0,d, 0) process for H = 0.6 having the sample length, N = 16384. The histogram at the bottom of Figure 2 is plotted after elimination of the outlie rs shown in the top right figure. The estimated H for noisy samples (top right figure) and samples after elimination are 0.8993 and
0.576 respectively. The outliers from noisy samples are eliminated by automatic alpha and then the alpha value is used in TACF which in turn applied in HEAF(2).
-4 -3 -2 -1 0 1 2 3 4 5 0 200 400 600 800 1000 1200 1400 -30 -20 -10 0 10 20 30 0 200 400 600 800 1000 1200 1400 -2.50 -2 -1.5 -1 -0.5 0 0.5 1 1.5 2 2.5 200 400 600 800 1000 1200 1400
Fig. 4. Top left figure - Data generated by FARIMA (0,d, 0) process for H =0.7 (H measured by HEAF (2) = 0.683), N = 16384. Top right figure – generated Noisy sample (measured H = 0.573). Bottom figure - H = 0.65 (after elimination of the outliers) where alpha = 0.041
-6 -4 -2 0 2 4 6 0 200 400 600 800 1000 1200 -6 -4 -2 0 2 4 6 0 100 200 300 400 500 600 700 800 900 1000 -5 -4 -3 -2 -1 0 1 2 3 4 0 100 200 300 400 500 600 700 800 900 1000
Fig. 5. Top left figure - Data generated by FARIMA (0,d, 0) process for H =0.9 (H measured by HEAF (2) = 0.858), N = 16384. Top right figure – generated Noisy sample (measured H = 0.701). Bottom figure - H = 0.857 (after elimination of the outliers) where alpha = 0.045
In Figure 6, uniform random numbers are chosen to generate FARIMA (0,d,0) sequences for various Hurst parameters. Due to uniform random function used in the process, FARIMA (0,d,0) generates only positive sequences, which can imitate real Internet packet
5
sequences. It is clear from the results presented in this research that additive outliers can be removed by applying robust ACF and after elimination of these outliers from different case study, it is evident that HEAF(2) yields a reliable value of H.
0.8 1 1.2 1.4 1.6 1.8 2 0 20 40 60 80 100 120 140 160 180 200 7.2 7.4 7.6 7.8 8 8.2 8.4 8.6 8.8 9 9.2 0 20 40 60 80 100 120 140 160 180 200
Fig. 6. Left figure - FARIMA (0,d,0) for H = 0.6 ( measured H by HEAF(2) = 0.579), N = 8192. Right figure – FARIMA (0, d, 0) for H = 0.8 (measured H by HEAF(2) = 0.774), N = 8192.
VI. CONCLUSION
It is possible to end up with wrong conclusions and wrong models when measuring the intensity of the LRD with unreliable estimators. In this research we have shown that the plausible H for given data can be overestimated or underestimated due to additive outliers possessing in the data. These outliers can be removed by applying robust ACF in HEAF(2) and in this case HEAF(2) yields a consistent and reliable results. Because of the simplicity, robustness and reliability, we believe that HEAF(2) can be used to estimate the intensity of LRD in real time network traffic.
REFERENCES
[1] Karim M. Rezaul, Algirdas Pakštas, Robert Gilchrist, Thomas M. Chen, HEAF: A Novel Estimator for Long-Range Dependent Self-similar Network Traffic, Y. Koucheryavy, J. Harju, and V.B. Iversen (Eds.): Next Generation Teletraffic and Wired/Wireless Advanced Networking (NEW2AN), May 29 - June 2, 2006, LNCS 4003, pp. 34 – 45.
[2] Leland Will E. Taqqu M. S., Willinger W. and Wilson D. V., On the Self-similar nature of Ethernet Traffic (Extended version), IEEE/ACM Transactions on Networking, February 1994, Vol. 2, No. 1, pp. 1-15.
[3] Hurst H. E., Long-term storage capacity of reservoirs, Transactions of the American Society of Civil Engineers, 1951, vol.116, pp 770-808.
[4] Ton Dieker, Simulation of Fractional Brownian Motion, Masters Thesis, Department of Mathematical Sciences, University of Twente, The Netherlands, 2004.
[5] T. Higuchi, Approach to an irregular time series on the basis of the fractal theory, Physica D, 1988, vol.31, pp. 277-283. [6] P. Abry, P. Flandrin, M. S. Taqqu and D. Veitch, Wavelets for the
Analysis, Estimation, and Synthesis of Scaling Data, K. Park and W. Willinger (editors), Self-Similar Network Traffic and Performance Evaluation. John Wiley & Sons, New York, 2000, pp. 39-88.
[7] P. Abry and D. Veitch, Wavelet Analysis of Long-Range Dependent traffic. IEEE Transactions on Info rmation Theory, 1998, vol.44, No 1, pp.2-15.
[8] Stilian Stoev, Murad Taqqu, Cheolwoo Park and J.S. Marron, Strengths and Limitations of the Wavelet Spectrum Method in the Analysis of Internet Traffic, Technical Report #2004-8, March 26, 2004.
[9] Kihong Park, Gitae Kim, Mark Crovella, On the relationship between file sizes, transport protocols, and self-similar network traffic, Fourth International Conference on Network Protocols
(ICNP'96). 1996, pp. 171-180.
[10] Vern Paxson and Sally Floyd, Wide-Area Traffic: The Failure of Poisson Modeling, IEEE/ACM Transactions on Networking, June 1995, Vol. 3 No. 3, pp. 226-244.
[11] UNC Network Data Analysis Study Group, University of North Carolina, http://www- dirt.cs.unc.edu/net_lrd/ (visited on May 23, 2005).
[12] W. Willinger, M. S. Taqqu, W. E. Leland, and D. V. Wilson, Self-similarity in high speed packet traffic: Analysis and modeling of ethernet traffic measurements, Statistical Science, 1995, Vol. 10, pp. 67-85.
[13] Dario Rossi, Luca Muscariello, Marco Mellia, On the Properties of TCP Flow Arrival Process, IEEE International Conference on Communications (ICC 2004), Paris - France, June 20-24, 2004. [14] Ashok Erramilli, Onuttom Narayan, and Walter Willinger,
Experimental Queueing Analysis with Long-range Dependent Packet Traffic, IEEE/ACM Transactions on Networking, April 1996, Vol. 4, No. 2, pp. 209-223.
[15] O. Rose, Estimation of the Hurst Parameter of Long-Range Dependent Time Series, Report No. 137, February 1996, Institute of Computer Science, University of Wurzburg.
[16] E. Willekens and J. Teugels, Asymptotic expansions for waiting time probabilities in an M/G/1 queue with longtailed service time, Queueing Systems 10, 1992, pp. 295-312.
[17] An Ge, Franco Callegati, and Lakshman S. Tamil, On Optical Burst Switching and Self-Similar Traffic, IEEE Communications Letters, March 2000, Vol. 4, No. 3, pp. 98-100.
[18] R.J. Gibbens, Traffic characterisation and effective bandwidths for broadband network traces, Stochastic Networks, Theory and Applications, 1996, pp. 169-179, Oxford Science Pub.
[19] Dietrich C. R. and Newsam G. N., A fast and exact method for multidimensional Gaussian Stochastic simulations, Water Resources Research, 1993, vol. 29, No. 8, pp.2861-2869. [20] C.R. Dietrich and G.N. Newsam, Fast and exact simulation of
stationary Gaussian processes through circulant embedding of the covariance matrix, SIAM Journal on Scientific Computing, 1997, vol.18, pp.1088-1107.
[21] Kokoszka, P. S. and Taqqu, M. S., Fractional ARIMA with stable innovations, Stochastic Processes and their Applications, 1995, vol.60, pp.19–47.
[22] Stilian Stoev and Murad S. Taqqu, Simulation methods for linear fractional stable motion and FARIMA using the Fast Fourier Transform, Fractals, 2004, vol.12, No 1, pp.95-121.
[23] Brocklebank J. and D. Dickey. SAS System for Forecasting Time Series. SAS Institute Inc. Cary NC. 1986.
[24] Jin Cao, William S. Cleveland, Dong Lin, and Don X. Sun, On the Nonstationarity of Internet Traffic, Proc. ACM SIGMETRICS `01, 102-112, 2001.
[25] Walter Willinger, Vern Paxson, and Murad Taqqu, Self-similarity and Heavy Tails: Structural Modeling of Network Traffic, Adler, R., Feldman, R., and Taqqu, M.S., (editors), In A Practical Guide to Heavy Tails: Statistical Techniques and Applications, Birkhauser, 1998.
[26] Cox D., Long-Range Dependence: a Review. H. A. David and H. T. David (eds.), In Statistics: An Appraisal, Iowa State Statistical Library, The Iowa State University Press, 1984, pp.55-74. [27] H. Kettani and J. A. Gubner, A Novel Approach to the Estimation
of the Hurst Parameter in Self-Similar Traffic, Proceedings of the 27th Annual IEEE Conference on Local Computer Networks (LCN 2002), Tampa, Florida, November, 2002, pp.160-165. [28] Chan, W. S. and Wei, W. W. S., A comparison of some estimators
of time series autocorrelations, Computational Statistics & Data Ananlysis, vol. 14, 1992, pp. 149-163.
[29] Gnanadesikan, R. and Kettenring, J.R. (1972) Robust estimates,residuals, and outlier detection with multiresponse data, Biometrics 28, 81-124.
[30] Polasek W., Robust and Resistant measures for the autocorrelation function, mimeo, Institute of Statistics and Informatics, University of Vienna, 1982.
[31] Wang W. and Wei W.S.W., ASA proceedings of Business and Economic Statistics Section, pp. 175-180, 1993.
[32] Polasek, W. - Mertl, R. Robust and jackknife estimators for the autocorrelation function. Österreichische Zeitschrift für Statistik und Informatik 20, 1990, pp. 351-364.
[33] Hogg Robert V., Adaptive Robust procedures: A practical Review and some suggestions for future applications and theory, Journal of the American Statistical Association, vol. 69, December 1974, pp.909-927
[34] Vic Barnett and Toby Lewis, Outliers in Statistical data, 1994, 3rd Edition, John Wiley & Sons Ltd.
[35] Karim M. Rezaul , Algirdas Pakštas, Robert Gilchrist, “Investigation of the Properties of the HEAF Estimator Using Simulation Experiments and MPEG-encoded Video Traces”, 10th IEEE International Conference on Intelligent Engineering Systems (INES 2006), London, UK , June 26-28, 2006, pp. 276-281.
[36] Karim M. Rezaul, Robert Gilchrist and Algirdas Pakštas, “Long-range Dependent Self-similar Network Traffic: A Simulation Study to Compare Some New Estimators”, 7th Annual PostGraduate Symposium on the Convergence of Telecommunications, Networking and Broadcasting (PGnet 2006), Liverpool, UK, June 26-27, 2006, pp. 323-329.
Karim Mohammed Rezaul was born in Bangladesh on November, 1972. He is a Member of Royal Institution of Naval Architects (RINA), UK and Institution of Engineers Bangladesh (IEB), Bangladesh. In 1998, he graduated in the field of Naval Architecture and Marine Engineering from Bangladesh University of Engineering and Technology (BUET), Dhaka, Bangladesh. In 2001, he received an MSc in Marine Technology from Norwegian University of Science and Technology, Trondheim, Norway.
In February 2002, Mr. Karim was appointed as visiting lecturer in the department of computing, communications Technology and Mathematics at London Metropolitan Universit y and continued until June 2005. Now he is a visiting lecturer in the department of computing at Central College London. His research interests include Network Traffic Engineering, Statistical analyses of data, Heavy tail distribution of network traffic, Long-range dependent network traffic, Modelling network traffic by Fractal and wavelet method, Traffic control mechanism and Stochastic process and probability distribution.
Vic Grout was awarded the BSc(Hons) degree in Mathematics and Computing from the University of Exeter (UK) in 1984 and the PhD degree in Communication Engineering from Plymouth Polytechnic (UK) in 1988.
He has worked in senior positions in both academia and industry for twenty years and has published and presented over 100 research papers. He is currently a Reader in Computer Science at the University of Wales NEWI, Wrexham in the UK, where he leads the Centre for Applied Internet Research (CAIR). His research interests and those of his research students span several areas of computational mathematics, particularly the application of heuristic principles to large-scale problems in network design and management.
Dr. Grout is a Chartered Engineer, Chartered Scientist, Chartered Mathematician and Chartered IT Professional, a Member of the IMA, IET(IEE), ACM, IEEE, IEEE Computer and Communications Societies and a Fellow of the British Computer Society (BCS). He chairs the biennial international conference series on Internet Technologies and Applications (ITA 05 and ITA 07).