European Listed Exchange Traded Funds
ETF Liquidity Trends
ETF Volume
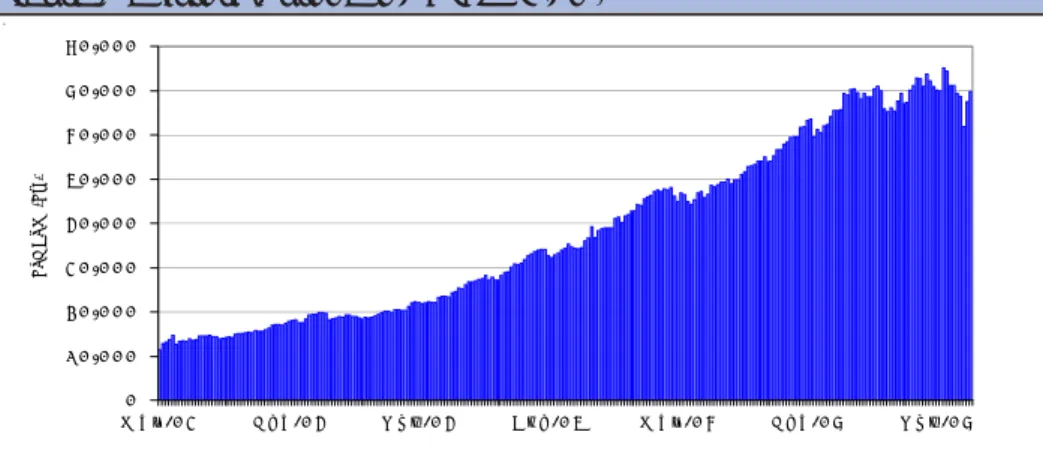
Exchange based European Equity ETF turnover rose by 4.9% on last week to a
new all time high with total monthly average daily turnover of E1.78bn (figure 9
on page 3 shows historic European ETF turnover). European fixed income ETF
turnover rose slightly on last week to E147m with money market ETFs continuing
to be the main focus. Total European ETF turnover is now over E2bn.
There were six new ETFs launched during the week from db x-trackers on a
new selection of short fixed income ETFs (on Deutsche Borse) and two new
money market ETFs linked to US$ and £ rates, listed on both the Deutsche
Borse and Borse Italiana (see page 2 for details).
European Country ETFs remain the leading product area with total turnover of
E715m accounting for just over 40% of total ETF turnover. The DAX ETFs remain
the dominant country products with total average daily volume of E295m across
the four listed products and accounting for 16.5% of all Equity ETF volume.
Euro STOXX 50 ETFs accounted for 31% of turnover trading E559m per day
with liquidity split across nine ETFs and 29 different listings on 9 exchanges.
Market Share
The Euronext NextTrack platform continues to have the largest on exchange
transaction market share with 37.53% of total turnover continuing to dominate
flows in regional ETFs. Deutsche Borse market share is now 34.55% having leading
market share in country and sector ETFs. The LSE’s combined Italian Exchange and
London market share has fallen to 16.11%.
Assets under Management (AUM)
Total European Equity related AUM rose by 3% to E69.7bn. AUM for DJ Euro
STOXX 50 ETFs were almost E15.6bn accounting for over 22% of total European
AUM. Fixed Income ETF AUM rose by 2.4% on the previous week to E16.66bn.
Source: Deutsche Bank, Reuters
Figure 2: ETF Equity Turnover by Index
Figure 1: Top 10 European Equity ETFs by volume
0 5 0 1 0 0 1 5 0 2 0 0 2 5 0 3 0 0 3 5 0 4 0 0 4 5 0 5 0 0 5 5 0 6 0 0 M S C I In d ia M S C I B ra zil D J S T O XX 5 0 S & P 5 0 0 S M I F T S E 1 0 0 O M XS 3 0 C A C 4 0 D A X D J E u ro S T O XX 5 0 Vo lu m e (€ m )
Deutsche Bank AG/London
All prices are those current at the end of the previous trading session unless otherwise indicated. Prices are sourced
from local exchanges via Reuters, Bloomberg and other vendors. Data is sourced from Deutsche Bank and subject
companies.
Deutsche Bank does and seeks to do business with companies covered in its research reports. Thus, investors should
be aware that the firm may have a conflict of interest that could affect the objectivity of this report.
Investors should consider this report as only a single factor in making their investment decision.
Independent, third-party research (IR) on certain companies covered by DBSI's research is available to customers of
DBSI in the United States at no cost. Customers can access this IR at http://gm.db.com, or call 1-877-208-6300 to
request that a copy of the IR be sent to them.
DISCLOSURES AND ANALYST CERTIFICATIONS ARE LOCATED IN APPENDIX 1.
Portfolio & Index Strategy
6 February 2008
Nizam Hamid
44 20 7545 2955
[email protected]
Yvonne Sandford
44 20 7545 1368
[email protected]
IMPORTANT: PLEASE READ DISCLAIMERS AT THE END OF THIS REPORT
Deutsche Bank AG or one of its affiliates may make a market in one or more of the ETFs mentioned in this document.
This document has been prepared for institutional investors only.
This note is not intended to promote or offer any ETF in any jurisdiction in which an offer, solicitation, purchase or sale of such
fund would be unlawful under the securities laws of such jurisdiction.
Source: Deutsche Bank, Reuters (daily average volume over past month)
Global Markets Research
Index
Research
ETF Nam e Issuer Exch TER
Daily Avg Vol (Em) iShares DAX (DE) BGI (DeutschlandDeutsche Bors 0.17% 218.81 Lyxor ETF CAC 40 Lyxor Euronext Paris 0.25% 189.58 Lyxor ETF DJ Euro STOXX 50 Lyxor Euronext Paris 0.25% 174.90 iShares DJ Euro STOXX 50 (DE) BGI (DeutschlandDeutsche Bors 0.17% 82.90 iShares FTSE 100 BGI London SE 0.40% 73.99 iShares DJ Euro STOXX 50 BGI Deutsche Bors 0.15% 63.46 Xact - Bear Xact Fonder AB Stockholmbors 0.60% 52.86 iShares DJ Euro STOXX 50 BGI Euronext Paris 0.15% 49.34 iShares DJ Euro STOXX 50 BGI Euronext Ams 0.15% 39.61 XMTCH on SMI Credit Suisse AMSw iss SE 0.38% 39.25
ETF Statistics
Source: Deutsche Bank, Reuters
Figure 4: ETF product market share summary
Source: Deutsche Bank 1 4 1 5 3 5 4 4 4 9 6 8 7 0 7 6 9 4 1 2 0 1 4 2 1 7 2 0 2 0 4 0 6 0 8 0 1 0 0 1 2 0 1 4 0 1 6 0 1 8 0 2 0 0 Euro S e ct o r Sec tor C o u n tr y Europe an Lev e ra ged G lo bal P a n-E u ro pea n R e gio nal Eu ro zo n e R egi on al E u rop ean C o unt ry G lob al R e gi on a l Ot h e r P a n-E u ro pea n Se ct o r Styl e Worl d C o u n tr y 0% 5% 10% 15% 20% 25% 30% 35% 40% 45% Eu ro S ec to r O ther S ect or Co unt ry G loba l Reg ional G lob al St yl e Pan-E uropea n Sec tor P an -European Regi on al E urop
ean Leveraged Worl
d Co unt ry E urozone Regi onal E uropea n Count ry Market Share
Contents
Statistics
2
Turnover
3
Market Share
5
AUM
6
ETF Share Changes
8
Fixed Income stats
8
Tracking errors
10
Average volume/aum
11
Reuters/BBG Codes
23
TER definitions
40
Other information
41
Sources
Sources
Sources
Sources
Sources
Assets under Management
-Bloomberg / Price and volume
used to calculate turnover
-Reuters
Volume is daily average exchange
reported volume. Daily average
calculated using 22 average,
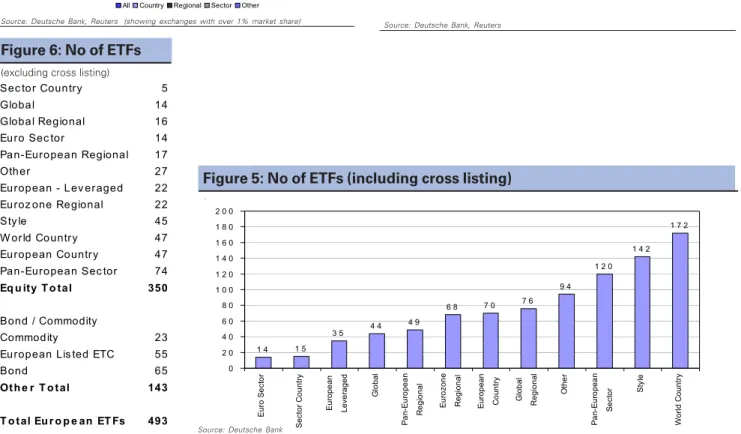
Figure 5: No of ETFs (including cross listing)
Source: Deutsche Bank, Reuters (showing exchanges with over 1% market share)Figure 3: Exchange market share summary
0.00% 10.00% 20.00% 30.00% 40.00% 50.00% 60.00% 70.00% Vi rt-X BME SW X S toc kholm LS E ETFplus XTF Ne xt T ra ck
All Country Regional Sector Other
Source: Deutsche Bank
Figure 6: No of ETFs
(excluding cross listing)
Sec tor Country
5
Global
14
Global Regional
16
Euro Sec tor
14
Pan-European Regional
17
Other
27
European - Lev eraged
22
Euroz one Regional
22
Sty le
45
W orld Country
47
European Country
47
Pan-European Sec tor
74
Eq u ity T o tal
350
Bond / Commodity
Commodity
23
European Lis ted ETC
55
Bond
65
Oth e r T o tal
143
T o tal Eu r o p e an ET Fs
493
New listings during the past week
Source: Deutsche Bank
ETF Name Issuer Exchange Bloomberg Reuters TER
db x-trackers II iTraxx Europe 5-year Short TR Index ETF db x-trackers Deutsche Borse XTE5 GY XTE5.DE 0.18% db x-trackers II iTraxx HiVol 5-year Short TR Index ETF db x-trackers Deutsche Borse XTH5 GY XTH5.DE 0.21% db x-trackers II iTraxx Crossover 5-year Short TR Index ETdb x-trackers Deutsche Borse XTC5 GY XTC5.DE 0.24% db x-trackers II iBoxx Euro Germany Covered TR Index ETFdb x-trackers Deutsche Borse XBCT GY XBCT.DE 0.15% db x-trackers II Fed Funds Effective Rate TR Index ETF db x-trackers Deutsche Borse XFFE GY XFFE.DE 0.15% db x-trackers II Sonia TR Index ETF db x-trackers Deutsche Borse XSTR GY XSTR.DE 0.15% db x-trackers II Sonia TR Index ETF db x-trackers Borsa Italiana XSTR IM XSTR.MI 0.15% db x-trackers II Fed Funds Effective Rate TR Index ETF db x-trackers Borsa Italiana XFFE IM XFFE.MI 0.15%
Tables and charts below
relate to Equity related
ETFs only
ETF Turnover - Equity related ETFs
Source: Deutsche Bank, Reuters
Table 7: Summary of Turnover
Source: Deutsche Bank, Reuters
Table 8: Summary of Market Share
Source: Deutsche Bank, Reuters
Figure 9: Historic European ETF turnover (Em)
0 2 0 0 4 0 0 6 0 0 8 0 0 1 , 0 0 0 1 , 2 0 0 1 , 4 0 0 1 , 6 0 0 1 , 8 0 0 2 , 0 0 0 M a y - 0 3 F e b - 0 4 N o v - 0 4 S e p - 0 5 J u n - 0 6 M a r - 0 7 J a n - 0 8 E T F V o lu me ( E m)
All Co u n tr y Re g io n al Se cto r Oth e r
ISE 0.04% 0.08% 0.00% 0.00% 0.00% A thex 0.05% 0.10% 0.00% 0.00% 0.00% Hels inki SE 0.11% 0.22% 0.00% 0.00% 0.00% A TX 0.14% 0.12% 0.20% 0.00% 0.11% Os lo Bors 0.14% 0.30% 0.00% 0.00% 0.00% V irt-X 0.44% 0.39% 0.53% 1.56% 0.00% BME 1.00% 1.42% 0.84% 0.02% 0.01% SW X 4.73% 6.92% 2.78% 2.20% 2.50% Stoc kholm 5.16% 2.58% 0.00% 0.00% 33.83% LSE 7.82% 12.84% 1.98% 0.14% 7.53% ETFplus 8.30% 8.58% 6.46% 13.84% 11.22% XTF 34.55% 35.37% 35.12% 57.99% 22.12% Nex tTrac k 37.53% 31.08% 52.09% 24.25% 22.69% Su m 100.00% 100.00% 100.00% 100.00% 100.00%
Turnov e r (Euro m)
A ll C o u n tr y Re g io n al Se cto r Oth e r ISE 0.68 0.68 0.00 0.00 0.00 A thex 0.87 0.87 0.00 0.00 0.00 Hels inki SE 1.91 1.91 0.00 0.00 0.00 A TX 2.52 1.02 1.28 0.00 0.22 Os lo Bors 2.56 2.56 0.00 0.00 0.00 V irt-X 7.87 3.40 3.48 0.99 0.00 BME 17.80 12.28 5.48 0.01 0.03 SWX 84.56 59.89 18.12 1.39 5.17 Stoc kholm 92.27 22.32 0.00 0.00 69.95 LSE 139.65 111.11 12.89 0.09 15.57 ETFplus 148.28 74.26 42.06 8.76 23.19 XTF 617.27 306.13 228.71 36.71 45.73 Nex tTrac k 670.51 269.00 339.24 15.35 46.91 Su m 1786.75 865.43 651.26 63.30 206.77Turnov e r (Euro m)
Source: Deutsche Bank, Bloomberg
Figure 10: Historic European ETF AUM (Em)
0 1 0 , 0 0 0 2 0 , 0 0 0 3 0 , 0 0 0 4 0 , 0 0 0 5 0 , 0 0 0 6 0 , 0 0 0 7 0 , 0 0 0 8 0 , 0 0 0 M a y - 0 3 F e b - 0 4 N o v - 0 4 A u g - 0 5 M a y - 0 6 F e b - 0 7 N o v - 0 7 ET F A U M (Em )
Source: Deutsche Bank, Reuters
Figure 16: Turnover by European Sector
Source: Deutsche Bank, Reuters
Figure 17: Turnover by Sector Index Provider
European sectors classified using STOXX economic groups
0 2,000 4,000 6,000 8,000 10,000 12,000 Cons Sers Industrial Technology Cons Goods Telecoms Oil & Gas Utilities Healthcare Basic Mats Financial
Volume (€000's) Volume (Em)
0 5 10 15 20 25 30 35 40
MSCI EURO STOXX STOXX
ETF Turnover - Equity related ETFs
Source: Deutsche Bank, Reuters
Figure 14: ETF Turnover by Exchange
0 100 200 300 400 500 600 700 ISE Athex Helsinki SE ATX Oslo Bors Virt-X BME SWX Stockholm LSE ETFplus XTF Volume (€m)
Source: Deutsche Bank, Reuters
Figure 15: Regional ETF Turnover by Exchange
0% 10% 20% 30% 40% 50% 60% AT X V irt -X BM E LS E SW X ET F p lu s XT F Ne xtT ra ck Market Share
Source: Deutsche Bank, Reuters
Figure 11: Turnover by ETF Index Type
Source: Deutsche Bank, Reuters
Figure 12: Turnover by Regional Index Type
Source: Deutsche Bank, Reuters
Figure 13: Turnover Per Country Index
0 1 0 0 2 0 0 3 0 0 4 0 0 5 0 0 6 0 0 7 0 0 8 0 0 E u ro S e c to r O th e r S e c to r C o u n try G lo b a l R e g io n a l G lo b a l S tyle P a n -E u r o p e a n S e c to r P a n- E u r o p e a n R e g io n a l E u ro p e a n L e ve ra g e d W o rld C o u n try E u r o z o n e R e g io n a l E u r o p e a n C o u n try V o lu m e ( E m ) 0 100 200 300 400 500 600 DJ STOXX 600 MSCI Euro MSCI Europe DJ STOXX 50 DJ Euro STOXX 50 Volume (Em) 0 50 100 150 200 250 300 350 MSCI Japan FTSE / Xinhua China 25 MSCI India MSCI Brazil OMXS30 S&P 500 SMI FTSE 100 CAC 40 DAX Volume (Em)Source: Deutsche Bank, Reuters
Figure 19: Market Share by European Sector
Source: Deutsche Bank, Reuters
Figure 20: Market Share of Sectors by Exchange
ETF Market Share - Equity related ETFs
Source: Deutsche Bank, Reuters
Figure 21: ETF fees versus Turnover (Em)
Source: Deutsche Bank, Reuters
Figure 22: Mkt Share of ETF Turnover by Exchange
0% 5% 10% 15% 20% 25% Co ns S e rs In d u str ia l Te chno lo gy C ons G o od s Te le co m s Oi l & Ga s U tiliti es He al th ca re B a si c M a ts F inan cia l Market Share 0% 10% 20% 30% 40% 50% 60%
LSE Virt-X SWX ETFplus NextTrack XTF Market Share 0 50 100 150 200 250 300 350 400 450 0.00% 0.20% 0.40% 0.60% 0.80% 1.00% Total Expense R atio
0% 5% 10% 15% 20% 25% 30% 35% 40% IS E At he x H e ls in ki S E AT X Os lo B or s V irt -X BM E SW X S to ckhol m LS E ETFp lu s XT F Ne xt T ra ck Market Share
Source: Deutsche Bank, Reuters
Figure 18: Mkt Share of Country ETFs by Exchange
0% 5% 10% 15% 20% 25% 30% 35% 40% IS E A thex ATX He ls in ki S E Os lo B o rs V irt -X BM E S tockho lm SW X ET Fp lu s LS E Ne xt T ra ck XTF Market Share
This note is not intended to promote or offer any ETF in any jurisdiction in which an offer, solicitation, purchase
or sale of such fund would be unlawful under the securities laws of such jurisdiction.
This document is for general information purposes only and does not constitute an offer to sell any ETFs or an invitation or
recommendation to enter into any transaction. The full terms and conditions of any ETFs can be obtained free of charge
from your investment advisor. This document is issued by Deutsche Bank and the distribution of this document in certain
jurisdictions may be restricted by law.
ETFs may not be a suitable investment for you and can involve important legal and tax consequences and investment risks.
We strongly recommend you to consult your financial advisor prior to investing in ETFs.
Source: Deutsche Bank, Bloomberg
Figure 23: AUM per Underlying Index (Em)
Source: Deutsche Bank, Bloomberg
Figure 24: AUM per index type (Em)
ETF Assets under Management- Equity related ETFs
Figure 25: Top 15 European Listed Equity ETFs by AUM
Source: Deutsche Bank, Bloomberg * Management fee as TER unavailable
ETF Nam e
Issuer
TER
Dom icile
AUM
(Em )
Lyxor ETF DJ Euro STOXX 50
Lyxor
0.25%
Fra
4,869.26
iShares DJ Euro STOXX 50 (DE)
BGI (Deutschland) AG
0.17%
Ger
3,827.70
iShares DJ Euro STOXX 50
BGI
0.15%
Ire
3,802.36
iShares DAX (DE)
BGI (Deutschland) AG
0.17%
Ger
3,372.97
Lyxor ETF CAC 40
Lyxor
0.25%
Fra
3,234.63
iShares FTSE 100
BGI
0.40%
Ire
2,175.24
iShares S&P 500 Index Fund (IUSA)
BGI
0.40%
Ire
1,869.71
db x-trackers DJ Euro STX 50
db x-trackers
0.15%
Lux
1,619.20
XMTCH on SMI
Credit Suisse AM
0.38%
Sw it
1,577.63
db x-trackers MSCI Emerging Markets TRN Index ETFdb x-trackers
0.65%
Lux
1,564.86
iShares MSCI Japan
BGI
0.59%
Ire
1,199.46
EasyETF CAC 40
AXA IM / BNP Paribas
0.25%
Fra
1,052.30
iShares Dow Jones Euro STOXX Select Dividend 30 BGI (Deutschland) AG
0.32%
Ger
999.85
iShares MSCI Emerging Markets
BGI
0.74%
Ire
886.55
SPDR Europe 350
Credit Agricole AM
0.35%
Ire
845.05
0 5,000 10,000 15,000 20,000 Sector Country Euro Sector European Leveraged Global Regional Other Global Style Pan-European Regional Pan-European Sector World Country Eurozone Regional European Country
Assets under Management (Em) 0 2,000 4,000 6,000 8,000 10,000 12,000 14,000 16,000 18,000
MSCI Europe MSCI World DJ Euro STOXX Select Dividend S&P 500 SMI FTSE 100 MSCI Emerging Markets DAX CAC 40 DJ Euro STOXX 50
Source: Deutsche Bank, Bloomberg
Figure 26: ETF volume versus AUM (Em)
Source: Deutsche Bank, Bloomberg
Figure 27: ETF Fees versus AUM (Em)
0.0 20.0 40.0 60.0 80.0 100.0 120.0 140.0 160.0 180.0 200.0 0 1,000 2,000 3,000 4,000 5,000 6,000 A ssets Unde r Manag em e nt (m )
T u rnov er ( m ) 0 2,000 4,000 6,000 8,000 10,000 12,000 14,000 0.00 % 0.10 % 0.20 % 0.30 % 0.40 % 0.50 % 0.60 % 0.70 % 0.80 % 0.90 % 1.00 % TE R A ss e ts u n der Mana gement (Em )
ETF Assets under Management - Equity related ETFs
Source: Deutsche Bank, Bloomberg
Figure 28: Top increases in Shares (ranked by Change in Em)
Source: Deutsche Bank, Bloomberg
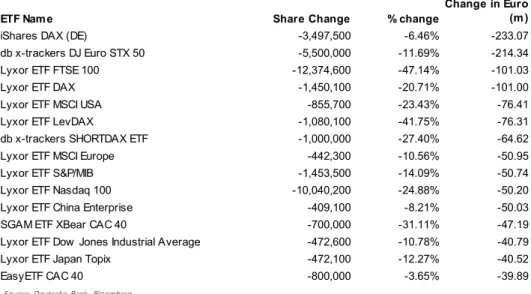
Figure 29: Top decreases in Shares (ranked by Change in Em)
Weekly ETF Share Changes
ETF Nam e
Share Change
% change
Change in Euro
(m )
Lyxor ETF CAC 40
5,985,600
10.15%
297.96
db x-trackers II EONIA TR Index ETF
1,500,000
13.19%
199.23
Lyxor ETF DJ Euro STOXX 50
4,223,800
3.48%
163.63
iShares DJ Euro STOXX 50
3,500,000
3.70%
135.66
db x-trackers MSCI Emerging Markets TRN Index ETF
4,500,000
8.52%
122.90
iShares S&P 500 Index Fund (IUSA)
11,750,000
6.27%
110.26
EasyETF Euro STOXX 50-B
2,379,400
37.33%
99.29
iShares DJ Euro STOXX 50 (DE)
1,800,000
1.88%
70.45
db x-trackers II iBoxx E Sovereigns Eurozone 1-3 TR In
400,000
46.56%
55.72
db x-trackers MSCI Europe TRN Index ETF
1,500,000
24.19%
55.13
iShares MSCI World
1,600,000
5.19%
34.45
iShares eb.rexx Jumbo Pfandbriefe (DE)
325,000
6.52%
34.40
XACT OMXS30
2,950,000
14.39%
30.71
iShares eb.rexx Government Germany 1.5-2.5 (DE)
300,000
6.58%
30.19
iShares MSCI North America
1,400,000
12.28%
25.98
ETF Name
Share Change
% change
Change in Euro
(m )
iShares DAX (DE)
-3,497,500
-6.46%
-233.07
db x-trackers DJ Euro STX 50
-5,500,000
-11.69%
-214.34
Lyxor ETF FTSE 100
-12,374,600
-47.14%
-101.03
Lyxor ETF DAX
-1,450,100
-20.71%
-101.00
Lyxor ETF MSCI USA
-855,700
-23.43%
-76.41
Lyxor ETF LevDAX
-1,080,100
-41.75%
-76.31
db x-trackers SHORTDAX ETF
-1,000,000
-27.40%
-64.62
Lyxor ETF MSCI Europe
-442,300
-10.56%
-50.95
Lyxor ETF S&P/MIB
-1,453,500
-14.09%
-50.74
Lyxor ETF Nasdaq 100
-10,040,200
-24.88%
-50.20
Lyxor ETF China Enterprise
-409,100
-8.21%
-50.03
SGAM ETF XBear CAC 40
-700,000
-31.11%
-47.19
Lyxor ETF Dow Jones Industrial Average
-472,600
-10.78%
-40.79
Lyxor ETF Japan Topix
-472,100
-12.27%
-40.52
EasyETF CAC 40
-800,000
-3.65%
-39.89
Figure 33: Top 15 European Listed Bond ETFs by AUM
Source: Deutsche Bank, Bloomberg * Management fee as TER unavailable
ETF Nam e
Issuer
TER
Dom icile
AUM
(Em )
db x-trackers II EONIA TR Index ETF
db x-trackers
0.15%
Lux
1,709.53
iShares eb.rexx Government Germany 5.5-10.5 (DE)BGI (Deutschland) AG
0.15%
Ger
1,435.32
Accion AFI Monetario Euro ETF
BBVA Gestion SA SGIIC
0.06%
Sp
1,109.87
Lyxor ETF EuroMTS Global
Lyxor
0.17%
Fra
1,108.26
Lyxor ETF Euro Cash
Lyxor
0.15%
Fra
1,045.51
Lyxor ETF EuroMTS 3-5Y
Lyxor
0.17%
Fra
766.19
Lyxor ETF EuroMTS 1-3Y
Lyxor
0.17%
Fra
764.57
iShares eb.rexx Government Germany 2.5-5.5 (DE) BGI (Deutschland) AG
0.15%
Ger
708.23
iShares € Corporate Bond
BGI
0.20%
Ire
637.00
iShares eb.rexx Government Germany (DE)
BGI (Deutschland) AG
0.16%
Ger
569.06
iShares eb.rexx Jumbo Pfandbriefe (DE)
BGI (Deutschland) AG
0.09%
Ger
561.83
iShares eb.rexx Government Germany 1.5-2.5 (DE) BGI (Deutschland) AG
0.15%
Ger
488.85
iShares eb.rexx Govt Germany 10.5+ (DE)
BGI (Deutschland) AG
0.15%
Ger
391.99
Lyxor ETF EuroMTS Infl Link
Lyxor
0.20%
Fra
363.83
db x-trackers II iBoxx E Sovereigns Eurozone 3-5 TRdb x-trackers
0.15%
Lux
314.32
Source: Deutsche Bank, DatastreamFigure 30: Top 10 European Bond ETFs by volume
Fixed Income ETF Statistics
Source: Deutsche Bank, Reuters
Figure 31: Historic Eur Bond ETF turnover (Em)
Source: Deutsche Bank, Reuters
Figure 32: Historic Eur Bond ETF AUM (Ebn)
0.00 20.00 40.00 60.00 80.00 100.00 120.00 140.00 160.00
Jun-03 Feb-04 Oct-04 Jun-05 Feb-06 Oct-06 Jun-07 Feb-08
Tru nov er (E m )
Bond ETF Growth in Turnover
0 .0 0 2 .0 0 4 .0 0 6 .0 0 8 .0 0 1 0 .0 0 1 2 .0 0 1 4 .0 0 1 6 .0 0 1 8 .0 0
J un-0 3 D e c -0 3 J un-0 4 D e c -0 4 J un-0 5 D e c -0 5 J un-0 6 D e c -0 6 J un-0 7 D e c -0 7
AU
M
(Eb
n)
B o nd E TF G ro w th in AUM
ETF Name
Exchange
Issuer
TER
Daily Avg
Vol (Em)
Accion AFI Monetario Euro ETF
ES
BBVA Gestion SA SGIIC
0.06%
39.00
Lyxor ETF Euro Cash
FR, IT
Lyxor
0.15%
21.10
db x-trackers II EONIA TR Index ETF
DE, IT
db x-trackers
0.15%
16.77
Lyxor ETF EuroMTS Global
DE, FR, IT
Lyxor
0.17%
8.88
Lyxor ETF EuroMTS 1-3Y
DE, FR, IT
Lyxor
0.17%
8.41
iShares eb.rexx Jumbo Pfandbriefe (DE)
DE
BGI (Deutschland) AG
0.09%
7.15
Lyxor ETF EuroMTS 3-5Y
DE, FR, IT
Lyxor
0.17%
5.07
Lyxor ETF EuroMTS 5-7Y
DE, FR, IT
Lyxor
0.17%
3.84
iShares eb.rexx Government Germany 5.5-10.5 (DE) DE
BGI (Deutschland) AG
0.15%
3.81
iShares € Corporate Bond
CH, DE, IT, GB, MX, NL BGI
0.20%
3.19
ETF Statistics by Issuer - Equity & Fixed Income
Figure 36: ETF Issuers Ranked by Daily Avg Volume
Figure 37: ETF Issuers Ranked by AUM
Source: Deutsche Bank, DatastreamFigure 34: Top 10 European ETF Issuers by Volume
Source: Deutsche Bank, Datastream
Figure 35: Top 10 European ETF Issuers by AUM
Source: Deutsche Bank, Reuters Source: Deutsche Bank, Reuters
0 5 , 0 0 0 1 0 , 0 0 0 1 5 , 0 0 0 2 0 , 0 0 0 2 5 , 0 0 0 L y x o r B G I B G I ( D e u t s c h la n d ) A G d b x - t r a c k e r s A X A I M / B N P P a r i b a s C r e d i t S u i s s e A M B B V A G e s t i o n S A S G I I C E T F S e c u r i t i e s L t d C r e d i t A g r i c o le A M G o ld B u lli o n H o ld i n g s L t d A U M ( E m ) 0 1 0 0 2 0 0 3 0 0 4 0 0 5 0 0 6 0 0 7 0 0 L y x o r B G I ( D e u t s c h la n d ) A G B G I d b x - t r a c k e r s X a c t F o n d e r A B E T F S e c u r i t i e s L t d C r e d i t S u i s s e A M B B V A G e s t i o n S A S G I I C S G A M G o ld B u lli o n H o ld i n g s L t d V o lu m e ( E m )
Is sue r
Daily Avg
Vol (Em )
Mk t Share
Lyxor
651.01
31.83%
BGI (Deutschland) AG
440.22
21.53%
BGI
425.76
20.82%
db x-trackers
122.03
5.97%
Xact Fonder AB
93.23
4.56%
ETF Securities Ltd
60.48
2.96%
Credit Suisse AM
51.70
2.53%
BBVA Gestion SA SGIIC
51.05
2.50%
SGAM
28.44
1.39%
Gold Bullion Holdings Ltd
28.32
1.38%
AXA IM / BNP Paribas
23.02
1.13%
UBS
15.93
0.78%
State Street Global Advisors
13.59
0.66%
Credit Agricole AM
10.76
0.53%
Zuercher Kantonalbank
9.31
0.46%
Pow erShares
8.16
0.40%
DVG
2.10
0.10%
ABN Amro Bank NV
1.92
0.09%
Seligson & Co Fund Man
1.88
0.09%
DnB NOR Kapitalforvaltning/Norw a
1.63
0.08%
JP Morgan
1.22
0.06%
Alpha Asset Man.
0.87
0.04%
NCB Stockbrokers
0.68
0.03%
Santander
0.46
0.02%
Unico Asset Man
0.41
0.02%
Beta Etfund PLC
0.38
0.02%
BNP Paribas
0.26
0.01%
SPA ETF Europe Ltd
0.23
0.01%
Erste Sparinvest KAG
0.00
0.00%
Dexia AM
0.00
0.00%
PDR Services LLC
0.00
0.00%
Issuer
AUM (Em )
Mkt Share
Lyxor
22,827.08
24.58%
BGI
19,093.90
20.56%
BGI (Deutschland) AG
18,539.32
19.96%
db x-trackers
9,061.26
9.76%
AXA IM / BNP Paribas
4,246.22
4.57%
Credit Suisse AM
3,177.96
3.42%
BBVA Gestion SA SGIIC
2,192.92
2.36%
ETF Securities Ltd
2,121.96
2.28%
Credit Agricole AM
1,775.89
1.91%
Gold Bullion Holdings Ltd
1,762.26
1.90%
Xact Fonder AB
1,631.23
1.76%
UBS
1,615.62
1.74%
State Street Global Advisors
1,450.36
1.56%
Zuercher Kantonalbank
847.98
0.91%
SGAM
467.30
0.50%
DVG
417.18
0.45%
Pow erShares
355.25
0.38%
Santander
329.93
0.36%
Unico Asset Man
187.52
0.20%
ABN Amro Bank NV
173.47
0.19%
BNP Paribas
147.54
0.16%
Seligson & Co Fund Man
138.90
0.15%
Beta Etfund PLC
120.31
0.13%
JP Morgan
92.61
0.10%
NCB Stockbrokers
50.86
0.05%
DnB NOR Kapitalforvaltning/Norw a
27.39
0.03%
SPA ETF Europe Ltd
25.80
0.03%
Alpha Asset Man.
0.00
0.00%
Erste Sparinvest KAG
0.00
0.00%
Source: Deutsche Bank, Datastream
Figure 34: Regional ETFs and Tracking Errors (1 Year)
Source: Deutsche Bank, Datastream
Figure 35: European Country Indices and Tracking Errors (1 Year)
European Country Indices
FTSE Ctry
MSCI Ctry
AEX 4.43
9.63
CAC 40
1.02
7.35
DAX
1.53
28.97
FTSE 100
7.77
0.70
HEX 25
10.73
49.77
MSCI UK
7.73
0.00
OMX
2.42
5.19
SMI
0.74
4.06
S&P MIB
1.16
4.24
Equivalent Benchm ark
Pan Europe
ETF Index
DJ STOXX
MSCI Europe
FTSE Europe
DJ STOXX 50
2.96
2.85
7.16
FTSE Eurotop 100
2.39
2.15
6.90
MSCI Pan Euro Index
1.22
0.90
6.55
Eurozone
DJ EURO STOXX
MSCI EMU FTSE Eurozone
DJ Euro STOXX 50
3.00
2.95
13.28
FTSE Euro 100
1.62
1.45
12.88
MSCI Euro
1.19
0.93
0.73
FTSEurofirst 80
2.18
2.00
0.82
Equivalent Benchm ark
Equivalent Benchm ark
European Listed ETFs
Eurozone ETFs
12
Pan-European ETFs
12
European Country ETFs
13
Regional ETFs
14
World Country ETFs
15
Country/Sector ETFs
15
Pan-European Sector ETFs
16
European Sector ETFs
18
Style ETFs
19
Other ETFs
20
Bond / Commodity ETFs
21
European Listed ETFs
Eurozone ETFs
Source: Deutsche Bank, Bloomberg, Reuters * Management fee as TER unavailable
Source: Deutsche Bank, Bloomberg, Reuters
European Listed ETFs
Pan Europe ETFs
ETF Name
Issuer
Exchange Listings
Total
Expense
Ratio Domicile
Total Daily
Avg Vol
(Em)
AUM
(Euro m)
EasyETF DJ Euro STOXX
AXA IM / BNP Paribas
FR, IT
0.35%
Fra
1.68
109.3
iShares Dow Jones Euro STOXX (DE)
BGI (Deutschland) AG
DE
0.21%
Ger
0.65
290.5
Lyxor ETF DJ Euro STOXX 50
Lyxor
AT, CH, DE, ES, FR, IT
0.25%
Fra
223.61
4,869.3
iShares DJ Euro STOXX 50
BGI
CH, DE, FR, GB, IT, NL, VX
0.15%
Ire
178.39
3,802.4
iShares DJ Euro STOXX 50 (DE)
BGI (Deutschland) AG
AT, CH, DE, FR
0.17%
Ger
122.03
3,827.7
db x-trackers DJ Euro STX 50
db x-trackers
CH, DE, IT
0.15%
Lux
23.31
1,619.2
UBS-ETF DJ Euro STOXX 50
UBS
CH, DE, VX
0.35%
Lux
5.07
326.3
BBVA-Accion DJ Euro STOXX 50
BBVA Gestion SA SGIIC
ES
0.15%
Sp
4.15
161.8
UBS-ETF Euro STOXX 50 I
UBS
CH, DE, FR
0.15%
Lux
1.01
173.8
Deutsche Bank Euro STOXX 50 DVG
DVG
DE
0.15%
Ger
0.54
269.1
EasyETF Euro STOXX 50-B
AXA IM / BNP Paribas
FR
0.25%
Fra
0.44
365.3
EasyETF Euro STOXX 50-A
AXA IM / BNP Paribas
FR
0.45%
Fra
0.17
31.9
iShares DJ EuroSTOXX MidCap
BGI
CH, DE, FR, GB, IT, NL, VX
0.40%
Ire
1.23
173.7
iShares DJ EuroSTOXX SmallCap
BGI
CH, DE, FR, GB, IT, NL, VX
0.40%
Ire
3.13
164.3
iShares FTSEurofirst 80
BGI
CH, DE, FR, GB, IT, NL, VX
0.40%
Ire
0.84
144.1
Lyxor ETF FTSEurofirst 80
Lyxor
FR
0.35%
Fra
0.57
49.4
XMTCH (Lux) on MSCI EMU Mid Cap
Credit Suisse AM
CH
0.40%
Lux
0.16
12.1
Lyxor ETF MSCI EMU Small Cap
Lyxor
CH, DE, ES, FR, IT
0.40%
Fra
1.02
96.1
XMTCH (Lux) on MSCI Euro*
Credit Suisse AM
CH, DE
0.53%
Lux
5.29
750.9
B1 - MSCI Euro
Beta Etfund PLC
IT
0.62%
Ire
0.10
57.5
streetTRACKS MSCI Eur SM Cap
State Street Global AdvisorFR
0.50%
Fra
0.01
19.5
SPDR Euro
Credit Agricole AM
FR, IT, VX
0.35%
Ire
1.47
241.1
ETF Nam e
Issuer
Exchange Listings
Total
Expense
Ratio Domicile
Total Daily
Avg Vol
(Em )
AUM
(Euro m )
iShares DJ STOXX 50
BGI
CH, DE, FR, GB, IT, NL, VX
0.35%
Ire
16.26
737.2
iShares DJ STOXX 50 (DE)
BGI (Deutschland) AG
CH, DE, FR
0.52%
Ger
8.62
278.5
EasyETF STOXX 50-B
AXA IM / BNP Paribas
FR
0.30%
Fra
0.22
41.7
EasyETF STOXX 50-A
AXA IM / BNP Paribas
FR
0.45%
Fra
0.06
20.8
iShares DJ STOXX 600 (DE)
BGI (Deutschland) AG
DE
0.19%
Ger
5.33
480.6
iShares DJ STOXX Large 200 (DE)
BGI (Deutschland) AG
DE
0.21%
Ger
0.12
29.6
iShares DJ STOXX Mid 200 (DE)
BGI (Deutschland) AG
DE
0.21%
Ger
0.27
192.2
iShares DJ STOXX Small 200 (DE)
BGI (Deutschland) AG
DE
0.21%
Ger
0.21
44.8
iShares FTSEurofirst 100
BGI
CH, DE, FR, GB, IT, NL, VX
0.40%
Ire
1.35
91.8
streetTRACKS MSCI Europe
State Street Global AdvisorFR
0.50%
Fra
4.97
664.9
db x-trackers MSCI Europe TRN Index ETF
db x-trackers
CH, DE, GB, GB$, IT
0.30%
Lux
4.81
283.0
Lyxor ETF MSCI Europe
Lyxor
CH, DE, FR, IT
0.35%
Fra
3.19
431.5
iShares MSCI Europe
BGI
CH, DE, FR, GB, NL
0.35%
Ire
0.34
33.6
Unico-MSCI Europe
Unico Asset Man
DE
0.72%
Lux
0.05
41.1
iShares MSCI Europe ex UK
BGI
CH, DE, FR, GB, IT, NL
0.40%
Ire
3.88
229.0
B1 - MSCI Pan Euro
Beta Etfund PLC
IT
0.50%
Ire
0.06
46.3
European Listed ETFs
European Country ETFs
Source: Deutsche Bank, Bloomberg, Reuters * Management fee as TER unavailable
ETF Nam e
Issuer
Exchange Listings
Total
Expense
Ratio Domicile
Total Daily
Avg Vol
(Em )
AUM
(Euro m )
streetTracks AEX
State Street Global AdvisorNL
0.30%
Fra
5.54
178.5
iShares AEX Tracker
BGI
GB, NL
0.30%
Ire
4.50
99.2
iShares ATX (DE)
BGI (Deutschland) AG
AT,DE
0.30%
Ger
0.96
42.1
Lyxor ETF BEL 20
Lyxor
BE
0.50%
Fra
0.26
31.5
Lyxor ETF CAC 40
Lyxor
FR
0.25%
Fra
189.58
3,234.6
EasyETF CAC 40
AXA IM / BNP Paribas
FR
0.25%
Fra
6.51
1,052.3
CAC40 Indexis
Credit Agricole AM
FR
0.25%
Fra
5.56
689.7
iShares DAX (DE)
BGI (Deutschland) AG
AT, DE
0.17%
Ger
219.22
3,373.0
Lyxor ETF DAX
Lyxor
CH, DE, FR, IT
0.15%
Lux
59.50
386.7
db x-trackers DAX ETF
db x-trackers
CH, DE
0.15%
Lux
15.26
361.3
Deutsche Bank DAX DVG
DVG
DE
0.15%
Ger
1.55
148.0
UBS-ETF DJ Germany Titans 30
UBS
DE
0.55%
Lux
0.17
23.2
Lyxor ETF FTSE 100
Lyxor
GB
0.30%
Fra
2.45
113.3
db x-trackers FTSE 100 ETF
db x-trackers
DE, GB
0.30%
Lux
0.51
122.3
iShares FTSE 100
BGI
GB, IT, NL, VX
0.40%
Ire
75.32
2,175.2
iShares FTSE 100 (DE)
BGI (Deutschland) AG
DE
0.51%
Ger
1.02
93.4
UBS-ETF FTSE 100
UBS
CH, DE, VX
0.55%
Lux
0.59
96.0
iShares FTSE 250
BGI
GB
0.40%
Ire
11.62
286.6
db x-trackers FTSE 250 ETF
db x-trackers
DE, GB
0.35%
Lux
0.46
174.4
Lyxor ETF FTSE 250
Lyxor
GB
0.35%
Fra
0.13
59.8
Lyxor ETF FTSE All-Share
Lyxor
GB
0.40%
Fra
0.76
92.2
db x-trackers FTSE All Share ETF
db x-trackers
DE
0.40%
Lux
0.03
27.0
Alpha ETF FTSE Athex 20 Domestic Equities Fund
Alpha Asset Man.
GR
0.38%
Gr
0.87
0.0
BBVA-Accion IBEX ETF
BBVA Gestion SA SGIIC
ES
0.33%
Sp
7.85
206.7
Lyxor ETF IBEX 35
Lyxor
ES
0.30%
Fra
3.66
106.6
Flame ETF IBEX 35
Santander
ES
0.30%
Sp
0.45
58.1
Flame ETF IBEX Mid Caps
Santander
ES
0.40%
Sp
0.00
214.8
Flame ETF IBEX Small Cap
Santander
ES
0.40%
Sp
0.00
53.7
ISEQ 20 ETF
NCB Stockbrokers
IE
0.50%
Ire
0.68
50.9
iShares MDAX (DE)
BGI (Deutschland) AG
DE
0.52%
Ger
9.71
168.3
Lyxor ETF MSCI Greece
Lyxor
DE, FR, IT
0.45%
Fra
0.32
19.4
DNB NOR OBX
DnB NOR KapitalforvaltningNO
0.60%
Nor
1.63
27.4
XACT OBX
Xact Fonder AB
NO
0.30%
Nor
0.93
49.4
Seligson & Co OMX Helsinki 25 ETF
Seligson & Co Fund Man
FI
0.23%
Fin
1.88
138.9
XACT OMXH25
Xact Fonder AB
FI
0.25%
Fin
0.03
2.1
XACT OMXS30
Xact Fonder AB
SE
0.31%
Sw ed
20.01
244.1
Lyxor ETF S&P/MIB
Lyxor
IT
0.35%
Fra
10.25
309.5
db x-trackers S&P/MIB ETF
db x-trackers
CH, DE, IT
0.30%
Lux
0.93
17.5
iShares S&P/MIB
BGI
GB
0.35%
Ire
0.00
6.1
XACT OMXSB
Xact Fonder AB
SE
0.30%
Sw ed
2.31
702.8
UBS-ETF SLI
UBS
CH
0.35%
Sw it
0.50
33.1
XMTCH on SMI
Credit Suisse AM
CH, DE
0.38%
Sw it
39.28
1,577.6
UBS-ETF SMI
UBS
CH
0.35%
Sw it
2.80
288.6
db x-trackers SMI ETF
db x-trackers
CH, DE, IT
0.30%
Lux
2.52
136.6
iShares SMI (DE)
BGI (Deutschland) AG
CH, DE
0.52%
Ger
1.21
38.4
XMTCH on SMIM
Credit Suisse AM
CH
0.51%
Sw it
3.36
319.2
European Listed ETFs
Regional ETFs
Source: Deutsche Bank, Bloomberg, Reuters
European Listed ETFs
World ETFs
Source: Deutsche Bank, Bloomberg, Reuters
ETF Name
Issuer
Exchange Listings
Total
Expense
Ratio Domicile
Total Daily
Avg Vol
(Em)
AUM
(Euro m)
iShares DJ Global Titans 50 (DE)
BGI (Deutschland) AG
DE
0.52%
Ger
0.36
62.3
Lyxor ETF DJ Global Titans 50
Lyxor
AT, DE, FR, IT
0.40%
Fra
0.25
54.7
EasyETF Global Titans 50
AXA IM / BNP Paribas
FR
0.45%
Fra
0.03
8.1
BBVA-Accion FTSE Latibex Top ETF
BBVA Gestion SA SGIIC
ES
0.55%
Sp
0.00
6.6
iShares MSCI Emerging Markets
BGI
CH, DE, FR, GB, GB$, IT, NL
0.74%
Ire
7.79
886.6
Lyxor ETF MSCI Emerging Markets
Lyxor
DE, ES, FR, GB, IT
0.65%
Fra
1.98
164.0
db x-trackers MSCI Emerging Markets TRN Index ETF
db x-trackers
CH, DE, FR, GB, GB$, IT
0.65%
Lux
1.79
1,564.9
XMTCH Lux on MSCI Emerging Markets
Credit Suisse AM
CH
0.75%
Lux
0.23
88.2
iShares MSCI World
BGI
CH, DE, FR, GB, GB$, IT, NL
0.50%
Ire
9.14
697.5
Lyxor ETF MSCI World
Lyxor
DE, FR, IT
0.45%
Fra
1.76
449.8
db x-trackers MSCI World TRN Index ETF
db x-trackers
CH, DE, GB, GB$, IT
0.45%
Lux
1.21
150.8
Unico-MSCI World
Unico Asset Man
DE
0.72%
Lux
0.36
146.5
Lyxor ETF MSCI World (USD)
Lyxor
CH
0.45%
Fra
0.25
16.3
ESPA Stock NTX
Erste Sparinvest KAG
AT
0.90% Austria
0.00
0.0
ETF Nam e
Issuer
Exchange Listings
Total
Expense
Ratio Domicile
Total Daily
Avg Vol
(Em)
AUM
(Euro m )
Lyxor ETF Eastern Europe (CECE EUR)
Lyxor
AT, CH, DE, ES, FR, IT
0.50%
Fra
4.67
325.0
Market Access DAXglobal Asia Index Fund
ABN Amro Bank NV
AT, CH, DE, NL
0.70%
Lux
0.01
5.0
Market Access DAXglobal BRIC Index Fund
ABN Amro Bank NV
AT, CH, DE, NL
0.70%
Lux
0.04
2.3
iShares DJ STOXX EU Enlarged 15 (DE)
BGI (Deutschland) AG
AT, DE
0.51%
Ger
0.45
50.0
iShares FTSE BRIC 50 Fund
BGI
CH, DE, FR, GB, GB$, IT, NL
0.74%
Ire
2.24
78.0
Lyxor ETF MSCI AC Asia Pacific ex Japan
Lyxor
DE, FR, IT
0.65%
Fra
1.33
151.0
Lyxor ETF MSCI AC Asia Pacific ex Japan
Lyxor
GB, GB$
0.65%
Fra
0.01
26.3
iShares MSCI AC Far East ex-Japan
BGI
CH, DE, FR, GB, GB$, IT, NL
0.50%
Ire
3.40
333.5
db x-trackers MSCI EM Asia TRN Index ETF
db x-trackers
CH, DE, GB, GB$, IT
0.65%
Lux
0.54
40.4
iShares MSCI Eastern Europe
BGI
CH, DE, FR, GB, GB$, IT, NL
0.74%
Ire
5.17
215.9
db x-trackers MSCI EM EMEA TRN Index ETF
db x-trackers
CH, DE, GB, GB$, IT
0.65%
Lux
0.92
33.6
db x-trackers MSCI EM Latam TRN Index ETF
db x-trackers
CH, DE, GB, GB$, IT
0.65%
Lux
0.96
53.3
iShares MSCI Latin America
BGI
GB, GB$, NL
0.74%
Ire
0.28
5.3
Lyxor ETF MSCI EM Latin America
Lyxor
DE, ES, FR, GB, IT
0.65%
Fra
1.39
60.3
iShares MSCI North America
BGI
CH, DE, FR, GB, GB$, IT, NL
0.40%
Ire
1.45
237.5
Market Access South-East Europe Traded Index Fund
ABN Amro Bank NV
AT, CH, DE, NL
0.70%
Lux
0.04
8.3
European Listed ETFs
Country / Sector ETFs
Source: Deutsche Bank, Bloomberg, Reuters Source: Deutsche Bank, Bloomberg, Reuters
World Country ETFs
European Listed ETFs
ETF Name
Issuer
Exchange Listings
Total
Expense
Ratio Domicile
Total Daily
Avg Vol
(Em)
AUM
(Euro m)
BBVA-Accion FTSE Latibex Brasil ETF
BBVA Gestion SA SGIIC
ES
0.55%
Sp
0.03
101.4
Lyxor ETF Brazil (Ibovespa)
Lyxor
CH, DE, IT, FR
0.65%
Fra
3.46
192.8
Lyxor ETF Brazil
Lyxor
GB, GB$
0.65%
Fra
0.20
33.0
iShares MSCI Brazil
BGI
CH, DE, FR, GB, GB$, IT, NL
0.74%
Ire
11.58
377.1
db x-trackers MSCI Brazil TRN Index ETF
db x-trackers
CH, DE, FR, GB, GB$, IT
0.65%
Lux
4.10
119.8
iShares Dow Jones China Offshore 50 (DE)
BGI (Deutschland) AG
DE
0.60%
Ger
1.25
24.1
iShares FTSE / Xinhua China 25 Fund
BGI
CH, DE, FR, GB, GB$, IT, NL, VX
0.74%
Ire
13.71
532.4
db x-trackers FTSE/Xinhua China 25 ETF
db x-trackers
CH, DE, FR, GB, GB$, IT
0.60%
Lux
4.39
102.6
Lyxor ETF China Enterprise
Lyxor
DE, ES, FR, IT
0.65%
Fra
10.60
559.7
Lyxor ETF China Enterprise (HSCEI) (GBP)
Lyxor
GB, GB$
0.65%
Fra
0.04
24.3
Lyxor ETF Hong Kong (HSI)
Lyxor
DE, FR, IT
0.65%
Fra
2.21
106.6
Lyxor ETF MSCI India
Lyxor
DE, ES, FR, IT
0.85%
Fra
13.26
711.0
Lyxor ETF MSCI India (USD)
Lyxor
CH
0.85%
Fra
0.74
82.0
db x-trackers S&P CNX Nifty ETF
db x-trackers
CH, DE, GB, GB$, IT
0.85%
Lux
2.09
74.8
Lyxor ETF India (S&P CNX Nifty) (GBP)
Lyxor
GB, GB$
0.85%
Fra
0.44
37.5
UBS-ETF DJ Japan Titans 100
UBS
CH, DE, VX
0.55%
Lux
2.36
294.5
UBS ETF DJ Japan Titans 100 I
UBS
CH
0.20%
Lux
0.03
206.0
iShares MSCI Japan
BGI
CH, DE, FR, GB, IT, NL, VX
0.59%
Ire
10.18
1,199.5
db x-trackers MSCI Japan TRN Index ETF
db x-trackers
CH, DE, GB, GB$, IT
0.50%
Lux
3.14
169.9
iShares Nikkei 225 (DE)
BGI (Deutschland) AG
DE
0.50%
Ger
0.77
98.6
Lyxor ETF Japan Topix
Lyxor
DE, FR, IT
0.50%
Fra
3.91
289.8
Lyxor ETF Japan Topix (YEN)
Lyxor
CH
0.50%
Fra
0.31
64.5
Lyxor ETF Japan Topix (GPB)
Lyxor
GB, GB$
0.50%
Fra
0.17
25.9
iShares MSCI Korea
BGI
CH, DE, FR, GB, GB$, IT, NL
0.74%
Ire
2.01
111.5
db x-trackers MSCI Korea TRN Index ETF
db x-trackers
CH, DE, GB, GB$, IT
0.65%
Lux
1.95
33.6
Lyxor ETF MSCI Korea
Lyxor
DE, FR, HK, IT
0.65%
Fra
1.54
105.1
Market Access DAXglobal Russia Index Fund
ABN Amro Bank NV
AT, CH, DE, NL
0.70%
Lux
0.27
10.4
Lyxor ETF Russia (DJ Rus Index Titans 10) (EUR)
Lyxor
DE, ES, FR, IT
0.65%
Fra
4.95
423.8
Lyxor ETF Russia (DJ Rus Index Titans 10) (GBP)
Lyxor
GB, GB$
0.65%
Fra
0.35
26.7
Lyxor ETF Russia (DJ Rus Index Titans 10) (USD)
Lyxor
CH
0.65%
Fra
0.29
48.7
db x-trackers MSCI Russia Capped Index ETF
db x-trackers
DE
0.45%
Lux
0.00
0.0
Market Access FTSE/JSE Africa Top 40 Index Fund
ABN Amro Bank NV
AT, CH, DE, NL
0.70%
Lux
0.03
4.5
Lyxor ETF South Africa (FTSE JSE Top40) (GBP)
Lyxor
GB, GB$
0.65%
Fra
0.93
28.8
Lyxor ETF South Africa (FTSE JSE Top40)
Lyxor
DE, FR, IT
0.65%
Fra
0.88
55.6
iShares MSCI Taiw an
BGI
CH, DE, FR, GB, GB$, IT, NL
0.74%
Ire
2.67
176.0
db x-trackers MSCI Taiw an TRN Index ETF
db x-trackers
CH, DE, GB, GB$, IT
0.65%
Lux
0.55
71.1
Lyxor ETF Turkey Titans 20
Lyxor
CH, DE, FR, IT
0.65%
Fra
2.81
159.8
Market Access DJ Turkey Titans 20 Index Fund
ABN Amro Bank NV
AT, CH, DE
0.60%
Lux
0.02
0.0
iShares MSCI Turkey
BGI
CH, DE, FR, GB, GB$, IT, NL
0.74%
Ire
2.67
87.7
UBS-ETF DJ US (Large Cap)
UBS
CH, DE, VX
0.35%
Lux
0.38
54.6
iShares DJ Industrial Average (DE)
BGI (Deutschland) AG
DE
0.52%
Ger
3.52
109.8
UBS-ETF DJ Industrial Average
UBS
CH, DE, VX
0.55%
Lux
2.37
94.6
Lyxor ETF Dow Jones Industrial Average
Lyxor
AT, CH, DE, ES, FR, IT
0.50%
Fra
2.18
337.6
DJIA Diamonds ("Diamond")
PDR Services LLC
NL
0.18%
USA
0.00
0.0
Lyxor ETF MSCI USA
Lyxor
DE, FR, IT
0.35%
Fra
1.10
249.7
db x-trackers MSCI USA TRN Index ETF
db x-trackers
CH, DE, GB, GB$, IT
0.30%
Lux
1.06
191.4
Lyxor ETF MSCI USA (USD)
Lyxor
CH
0.35%
Fra
0.12
26.8
iShares S&P 500 Index Fund (IUSA)
BGI
CH, DE, FR, GB, GB$, IT, NL, VX
0.40%
Ire
28.56
1,869.7
ETF Nam e
Issuer
Exchange Listings
Total
Expense
Ratio Domicile
Total Daily
Avg Vol
(Em )
AUM
(Euro m )
UBS-ETF DJ US Technology
UBS
CH, DE, VX
0.65%
Lux
0.64
24.8
Pow erShares EQQQ Fund
Pow erShares
CH, DE, FR, GB, IT, VX
0.20%
Ire
6.92
305.1
Lyxor ETF Nasdaq 100
Lyxor
DE, ES, FR, IT
0.30%
Fra
3.36
151.6
iShares NASDAQ-100 (DE)
BGI (Deutschland) AG
DE
0.30%
Ger
1.07
98.3
European Listed ETFs
Pan-European Sector ETFs
Source: Deutsche Bank, Bloomberg, Reuters
ETF Nam e
Issuer
Exchange Listings
Total
Expense
Ratio Domicile
Total Daily
Avg Vol
(Em )
AUM
(Euro m )
Autom obiles & Parts
Lyxor ETF DJ STOXX 600 Automobiles & Parts
Lyxor
DE, FR, IT
0.30%
Fra
0.33
42.0
iShares DJ STOXX 600 Automobiles & Parts (DE)
BGI (Deutschland) AG
DE
0.52%
Ger
0.28
34.4
iShares DJ STOXX 600 Automobiles & Parts Sw ap (DE)
BGI (Deutschland) AG
DE
0.32%
Ger
0.38
35.4
Banks
iShares DJ STOXX 600 Banks (DE)
BGI (Deutschland) AG
DE
0.52%
Ger
4.13
118.8
Lyxor ETF DJ STOXX 600 Banks
Lyxor
DE, FR, IT
0.30%
Fra
1.60
138.3
db x-trackers DJ STOXX 600 Banks ETF
db x-trackers
DE, IT
0.30%
Lux
0.58
24.2
iShares DJ STOXX 600 Banks Sw ap (DE)
BGI (Deutschland) AG
DE
0.32%
Ger
0.49
105.9
Basic Resources
iShares DJ STOXX 600 Basic Resources (DE)
BGI (Deutschland) AG
DE
0.52%
Ger
3.99
247.1
db x-trackers DJ STOXX 600 Basic Resources ETF
db x-trackers
DE, IT
0.30%
Lux
3.02
17.3
Lyxor ETF DJ STOXX 600 Basic Resources
Lyxor
DE, FR, IT
0.30%
Fra
1.82
127.0
iShares DJ STOXX 600 Resources Sw ap (DE)
BGI (Deutschland) AG
DE
0.32%
Ger
1.95
184.7
Chem icals
Lyxor ETF DJ STOXX 600 Chemicals
Lyxor
DE, FR, IT
0.30%
Fra
0.21
72.7
iShares DJ STOXX 600 Chemicals (DE)
BGI (Deutschland) AG
DE
0.52%
Ger
0.16
36.4
iShares DJ STOXX 600 Chemicals Sw ap (DE)
BGI (Deutschland) AG
DE
0.32%
Ger
0.07
15.8
Construction & Materials
iShares DJ STOXX 600 Construction & Materials (DE)
BGI (Deutschland) AG
DE
0.52%
Ger
0.41
31.0
Lyxor ETF DJ STOXX 600 Construction & Materials
Lyxor
DE, FR, IT
0.30%
Fra
0.18
40.2
iShares DJ STOXX 600 Construction & Materials Sw ap (DE)
BGI (Deutschland) AG
DE
0.32%
Ger
0.16
12.7
streetTRACKS MSCI EU Materials
State Street Global AdvisorFR
0.50%
Fra
0.57
64.8
Financial Services
Lyxor ETF DJ STOXX 600 Financial Services
Lyxor
DE, FR, IT
0.30%
Fra
0.72
43.0
iShares DJ STOXX 600 Financial Services (DE)
BGI (Deutschland) AG
DE
0.53%
Ger
0.38
37.2
iShares DJ STOXX 600 Financial Services Sw ap (DE)
BGI (Deutschland) AG
DE
0.32%
Ger
0.07
21.0
iShares DJ STOXX 600 Insurance Sw ap (DE)
BGI (Deutschland) AG
DE
0.32%
Ger
0.07
140.3
streetTRACKS MSCI Eu Financials
State Street Global AdvisorFR
0.50%
Fra
0.53
80.8
Food & Beverage
Lyxor ETF DJ STOXX 600 Food & Beverage
Lyxor
DE, FR, IT
0.30%
Fra
0.62
92.9
iShares DJ STOXX 600 Food & Beverage (DE)
BGI (Deutschland) AG
DE
0.52%
Ger
0.19
69.4
db x-trackers DJ STOXX 600 Food & Beverage ETF
db x-trackers
DE, IT
0.30%
Lux
0.00
3.4
iShares DJ STOXX 600 Food & Beverage Sw ap (DE)
BGI (Deutschland) AG
DE
0.32%
Ger
0.12
24.1
Health Care
iShares DJ STOXX 600 Health Care (DE)
BGI (Deutschland) AG
DE
0.52%
Ger
0.65
234.4
Lyxor ETF DJ STOXX 600 Healthcare
Lyxor
DE, FR, IT
0.30%
Fra
0.51
84.4
db x-trackers DJ STOXX 600 Health Care ETF
db x-trackers
DE, IT
0.30%
Lux
0.08
3.0
iShares DJ STOXX 600 Health Care Sw ap (DE)
BGI (Deutschland) AG
DE
0.32%
Ger
0.15
88.3
streetTRACKS MSCI Eu Healthcare
State Street Global AdvisorFR
0.50%
Fra
0.13
123.7
Industrial Goods & Services
db x-trackers DJ STOXX 600 Industrial Goods ETF
db x-trackers
DE, IT
0.30%
Lux
0.12
18.9
iShares DJ STOXX 600 Ind Goods & Services (DE)
BGI (Deutschland) AG
DE
0.52%
Ger
0.32
52.5
Lyxor ETF DJ STOXX 600 Ind Goods & Services
Lyxor
DE, FR, IT
0.30%
Fra
0.18
44.5
iShares DJ STOXX 600 Ind Goods & Services Sw ap (DE)
BGI (Deutschland) AG
DE
0.32%
Ger
0.13
26.4
streetTRACKS MSCI EU Industrials
State Street Global AdvisorFR
0.50%
Fra
0.30
72.0
Insurance
iShares DJ STOXX 600 Insurance (DE)
BGI (Deutschland) AG
DE
0.52%
Ger
0.77
193.2
Lyxor ETF DJ STOXX 600 Insurance
Lyxor
DE, FR, IT
0.30%
Fra
0.11
51.6
db x-trackers DJ STOXX 600 Insurance ETF
db x-trackers
DE, IT
0.30%
Lux
0.04
3.1
European Listed ETFs
Pan-European Sector ETFs
Source: Deutsche Bank, Bloomberg, Reuters
Media
iShares DJ STOXX 600 Media (DE)
BGI (Deutschland) AG
DE
0.52%
Ger
0.81
13.0
Lyxor ETF DJ STOXX 600 Media
Lyxor
DE, FR, IT
0.30%
Fra
0.24
22.9
iShares DJ STOXX 600 Media Sw ap (DE)
BGI (Deutschland) AG
DE
0.32%
Ger
0.03
43.6
Oil & Gas
Lyxor ETF DJ STOXX 600 Oil & Gas
Lyxor
DE, FR, IT
0.30%
Fra
1.33
177.9
iShares DJ STOXX 600 Oil & Gas (DE)
BGI (Deutschland) AG
DE
0.52%
Ger
0.93
198.3
db x-trackers DJ STOXX 600 Oil & Gas ETF
db x-trackers
DE, IT
0.30%
Lux
0.07
3.4
iShares DJ STOXX 600 Oil & Gas Sw ap (DE)
BGI (Deutschland) AG
DE
0.32%
Ger
0.50
198.5
streetTRACKS MSCI Eu Energy
State Street Global AdvisorFR
0.50%
Fra
0.83
116.3
Personal & Household Goods
iShares DJ STOXX 600 Pers & Household Goods (DE)
BGI (Deutschland) AG
DE
0.52%
Ger
0.10
26.8
Lyxor ETF DJ STOXX 600 Pers & Household Goods
Lyxor
DE, FR, IT
0.30%
Fra
0.10
26.2
iShares DJ STOXX 600 Pers & Household Goods Sw ap (DE)
BGI (Deutschland) AG
DE
0.32%
Ger
0.04
12.6
streetTRACKS MSCI Eu Cons Discretionary
State Street Global AdvisorFR
0.50%
Fra
0.48
41.9
Retail
iShares DJ STOXX 600 Retail (DE)
BGI (Deutschland) AG
DE
0.53%
Ger
0.26
35.5
Lyxor ETF DJ STOXX 600 Retail
Lyxor
DE, FR, IT
0.30%
Fra
0.16
48.4
iShares DJ STOXX 600 Retail Sw ap (DE)
BGI (Deutschland) AG
DE
0.32%
Ger
0.00
70.9
Technology
iShares DJ STOXX 600 Technology (DE)
BGI (Deutschland) AG
DE
0.52%
Ger
0.84
121.8
Lyxor ETF DJ STOXX 600 Technology
Lyxor
DE, FR, IT
0.30%
Fra
0.59
109.2
db x-trackers DJ STOXX 600 Technology ETF
db x-trackers
DE, IT
0.30%
Lux
0.01
6.1
iShares DJ STOXX 600 Technology Sw ap (DE)
BGI (Deutschland) AG
DE
0.32%
Ger
0.13
91.9
streetTRACKS MSCI Eu Technology
State Street Global AdvisorFR
0.50%
Fra
0.09
31.4
Telecomm unications
Lyxor ETF DJ STOXX 600 Telecoms
Lyxor
DE, FR, IT
0.30%
Fra
0.75
134.1
iShares DJ STOXX 600 Telecoms (DE)
BGI (Deutschland) AG
DE
0.52%
Ger
0.52
134.7
db x-trackers DJ STOXX 600 Telecoms ETF
db x-trackers
DE, IT
0.30%
Lux
0.01
7.9
iShares DJ STOXX 600 Telecoms Sw ap (DE)
BGI (Deutschland) AG
DE
0.32%
Ger
1.23
104.7
streetTRACKS MSCI Eu Telecommunication
State Street Global AdvisorFR
0.50%
Fra
0.35
66.7
Travel & Leisure
iShares DJ STOXX 600 Travel & Leisure (DE)
BGI (Deutschland) AG
DE
0.53%
Ger
0.36
7.9
Lyxor ETF DJ STOXX 600 Travel & Leisure
Lyxor
DE, FR, IT
0.30%
Fra
0.22
20.6
iShares DJ STOXX 600 Travel & Leisure Sw ap (DE)
BGI (Deutschland) AG
DE
0.32%
Ger
0.01
9.1
streetTRACKS MSCI Eu Consumer Staples
State Street Global AdvisorFR
0.50%
Fra
0.17
47.4
Utilities
iShares DJ STOXX 600 Utilities (DE)
BGI (Deutschland) AG
DE
0.52%
Ger
1.36
95.8
Lyxor ETF DJ STOXX 600 Utilities
Lyxor
DE, FR, IT
0.30%
Fra
1.01
73.6
db x-trackers DJ STOXX 600 Utilities ETF
db x-trackers
DE, IT
0.30%
Lux
0.14
3.5
iShares DJ STOXX 600 Utilities Sw ap (DE)
BGI (Deutschland) AG
DE
0.32%
Ger
0.86
131.7
streetTRACKS MSCI EU Utilities
State Street Global AdvisorFR
0.50%
Fra
0.39
50.3
ETF Nam e
Issuer
Exchange Listings
Total
Expense
Ratio Dom icile
Total Daily
Avg Vol
(Em )
AUM
(Euro m )
European Listed ETFs
Euro Sector ETFs
Source: Deutsche Bank, Bloomberg, Reuters