Microarray-based expression profiling:
Improving data mining and the link to biological
knowledge pools
A thesis submitted in partial
satisfaction o f the requirements for the degree o f Doctor o f Philosophy by:
Peter James Giles
UMI Number: U 200552
All rights reserved
INFO RM A TIO N TO ALL U SER S
The quality of this reproduction is dependent upon the quality of the copy submitted. In the unlikely event that the author did not send a complete manuscript
and there are missing pages, these will be noted. Also, if material had to be removed, a note will indicate the deletion.
Dissertation Publishing
UMI U 200552
Published by ProQuest LLC 2013. Copyright in the Dissertation held by the Author. Microform Edition © ProQuest LLC.
All rights reserved. This work is protected against unauthorized copying under Title 17, United States Code.
ProQuest LLC
789 East Eisenhower Parkway P.O. Box 1346
Declaration
This work has not been previously accepted in substance for any degree and is not being concurrently subm itted in candidature for any degree.
Signed: y *__________________________ (candidate)
Date: 21 Ju n e 2005___________________________
Statement 1
The thesis is th e result o f m y own investigations, except where otherwise stated. A bibliography is attached.
Signed: (candidate)
Date: 21 Ju n e _2005___________________________
Statement 2
I hereby give consent for my thesis, if accepted, to be available for photocopying and for inter-library loan, and for the title and sum m ary to be m ade available to outside organisations.
Signed: ^ __________________________ (candidate)
Abstract
Microarray based expression profiling provides a useful research tool to gain new insights into biological systems. Data analysis methods are in their infancy, with the answers to many basic questions shadowed by work on more complex computational and statistical methods. Understanding the fundamental concepts is essential in the application of statistical tests and to underpin work aiming to link microarray data to its biological annotation.
Centring on the detection of differential gene expression, the work presented in this thesis explores the effect of different statistical testing approaches and different expression metrics in their ability to correctly identify known changes in a dataset over a range of experimentally plausible sample sizes. Whilst certain combinations of methods are shown to have additional detection power in comparison to others, the results suggest th at sample size, along with variability between samples, are probably the most important factors in analysis outcomes.
Having identified differentially regulated genes, the final and most labour intensive part of the analysis process is drawing biological conclusions and hypothesises about the data. A novel solution is presented which combines experimental data with a curated annotation sources along with analysis tools to assist the researcher in exploring the information contained within their dataset.
Acknowledgements
The E nd
Hopefully I’ve ju st saved you a few precious hours of your life, but if you still have an insane desire to delve into the depths of my investigations into making sense of microarray analysis then here are the im portant people th at have made this voyage of discovery possible... for many of you this may be the only page of this thesis that will make any sense.
Above all I am indebted to Prof. David Kipling for everything he has done, taught and im parted onto me throughout the period of studentship. I think I have been very lucky in finding a supervisor with enthusiasm, inspiration, and time to fully engage with his student on a journey of joint exploration into microarray bioinformatics and feel I have learnt so much more than how to undertake good science. In return I hope th at he has been enlightened to the marvels of computing beyond that provided by Macintosh! The friendship, technical assistance and damned right stubbornness of Daniel Kirwilliam have been a fantastic asset to me over the last two years. It has been a pleasure to find somebody with similar views on the way to get the job done, how to endure basem ent existence, and a love of filling in a capella over some of music’s finest works!
Thanks m ust go to Megan Musson for her tolerance and good hum our and for enduring the undecipherable conversations in the office, along with providing valuable insight into the problems faced by average service users in analysing their data. The MADRAS project is indebted to the work from Matthew Peake and Kaye Smith in identifying our coding bugs and helping us mould a user friendly software tool.
I am thankful to Amanna, Jasper and Willow for their persistent interruptions in the pursuit of attention during my period of writing up. Many thanks you all for your love and support, and for enduring whatever negative parts of the process that I im parted in your direction, hopefully now I can now give you all the time and attention you deserve. Finally I owe much thanks to my parents, who always believed I was capable of more than I achieved and somehow succeeded in steering me on a path through life. I find it amazing th at my first work experience at the age of fourteen was in medical statistics and I’m now making a career using those skills... an inspired placement!
Contents
Microarray-based expression profiling: Improving data mining and the
link to biological knowledge pools... 1
Declaration...2 Statem ent 1...2 Statem ent 2 ...2 A bstract... 3 Acknowledgements...4 C o n ten ts... 5
List of Abbreviations U sed... 13
Chapter One Introduction...14
1.1 Gene expression profiling... 14
1.2 Introduction to microarray technologies... 15
1.2.1 Evolution of the m icroarray... 15
1.2.2 Overview of microarray technology... 16
1.2.3 Application of microarray technology...18
1.2.4 Limitations of microarray technology... 19
1.3 Affymetrix GeneChip technology... 20
1.3.1 Overview of technology features and production...20
1.3.2 Chip D esign... 21
1.3.3 Sample processing...22
1.4 Interpretation of microarray data...23
1.4.1 Computing expression values from image data... 24
1.4.2 Issues of data variability and norm alisation...25
1.4.3 Experimental approaches using microarrays...26
1.4.4 Techniques to identify differential gene expression... 27
Chapter Two Data distributions and their effect on analysis options
32
2.1 Introduction... 32
2.1.1 Introduction to differential gene expression...32
2.1.2 Application of statistical techniques to microarray data... 33
2.1.3 Reviewing key statistical assumptions and their relation to Affymetrix Gene Chip d a ta ...34
2.1.4 Application of param etric testing to microarray d a ta ...35
2.1.5 Application of non-param etric testing to microarray d a ta ...36
2.1.6 Data distributions and Affymetrix microarray data... 37
2.2 Technical Methodology... 38
2.2.1 Experimental approach...38
2.2.2 Analysis with a series of expression m etrics... 38
2.2.3 Post-analysis filtering ... 39
2.2.4 Technical Methodology... 39
2.3 Results and Explorations... 40
2.3.1 Statistical Normality Testing... 40
2.3.2 Assessing the degree of deviation from normality... 41
2.3.3 Investigating normality on a stratified MAS 5.0 dataset...48
2.3.4 Characterising the nature of the data distributions leading to deviations from normality in the MAS 5.0 d ataset...50
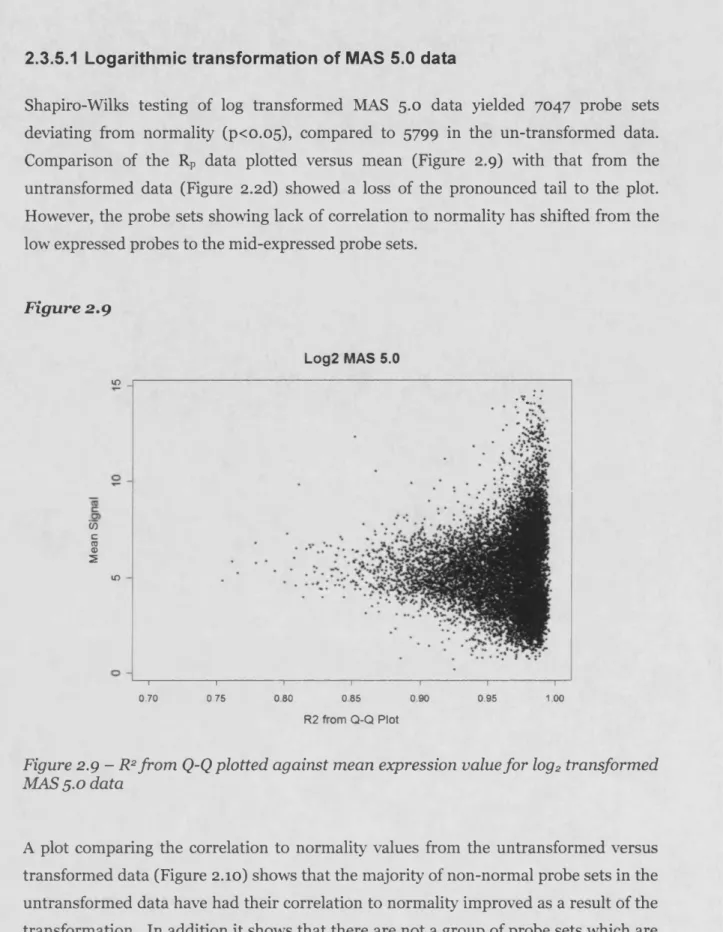
2.3.5 The effect of data transform ation filtering techniques...55
2.3.5 Application of a logarithmic transform to correct non-normality in MAS 5.0, RMA and gcRMA d atasets...55
2.3.6 Application of a Box-Cox transform ation... 59
2.4 Summaiy and Discussion... 61
4.2.1 Distributions of MAS 4.0 and dChip models d a ta ... 61
2.4.2 Distributions of MAS 5.0 d a ta ... 62
2.4.3 Distributions of RMA d a ta ...64
Chapter Three Statistical approaches to the detection of differentially
regulated genes in Affymetrix datasets... 66
3.1 Introduction... 66
3.1.1 Defining “bestpra ctice” in data analysis... 67
3.1.2 Sample size and statistical power...67
3.1.3 Application of statistics in the determ ination of differential gene expression... 68
3.1.4 Comparisons of expression m etrics... 69
3.1.5 Key questions regarding basic data analysis and experimental design... 70
3.2 Technical Methodology... 71
3.2.1 Overview...71
3.3 Exploration and R esults...73
3.3.1 Investigations into the detection sensitivity of fold change... 73
3.3.2 Does logarithmic transform ation improve power of detection?... 79
3.3.3 How does pooling variance influence detection outcom es?...84
3.3.4 How applicable are non-param etric methods to microarray datasets? 88 3.4 Discussion... 93
3.4.1 Reviewing fold change... 93
3.4.2 Issues of sample size... 93
3.4.3 Applying statistical testing to m icroarrays...94
3.4.4 Requirements and benefits of logarithmic transform ation...95
3.4.5 Comparative review of expression m etrics...96
Chapter Four Approaches to data normalisation... 100
4.1 Introduction... 100
4.1.1 W hat is norm alisation?... 100
4.1.2 Why is there a requirem ent to normalise d ata?... 100
4.1.3 Normalisation methodologies within expression metrics...101
4.1.4 Post metric analysis normalisation of Affymetrix d a ta ...102
4.2 Technical Methodology...104
4.3 Exploration and Results...106
4.3.1 Application of Quantile-Quantile (QQ) norm alisation... 106
4.3.2 Application of Variance Stabilisation Normalisation (VSN)... 112
5.3.3 The use of rank as an alternative signal m easurem ent... 117
4.4 D iscussion...126
4.4.1 Application of QQ norm alisation... 126
4.4.2 Application of VSN transform ation... 126
4.4.3 Application of rank transform ation... 127
4.4.4 Overall Conclusions... 127
Chapter Five Application of robust statistical testing...128
5.1 Introduction... 128
5.1.1 Factors contributing to the presence of outliers in microarray d a ta ... 129
5.1.1 Detecting outliers in a d a ta s e t... 130
5.2 Technical M ethodology... 132
5.3 Exploration and R esults... 133
5.3.1 Improving the robustness of the Welch t-te st...133
5.3.2 The trim m ed t-te s t... 137
5.3.3 The Winsorised t-te st... 141
5.3.4 Yuen’s t-test... 146
5.3.5 Re-sampling based testin g... 150
5.4 Discussion...163
5.4.1 Robust variants of the t-te s t... 163
5.4.2 Trimmed, Winsorised and Yuen’s t-tests... 163
5.4.4 Randomised Re-sampling based t-te s t... 164
Chapter Six Application of a Bayesian Framework... 166
6.1 Introduction... 166
6.1.4 Application of the Bayesian framework to Affymetrix D a ta... 168
6.2 Technical M ethodology... 169
6.3 R esults... 170
6.3.1 Defining an optimal Bayesian window size... 170
6.3.2 Defining an optimal blending w eighting...173
6.3.2 Application of a robust local variance estim ate...176
6.4 D iscussion...182
Chapter Seven Approaches to annotation and exploration of Affymetrix
microarray data...184
7.1 Introduction... 184
7.1.1 Making sense of experimental d a ta ... 185
7.1.2 Introduction to gene an n o tatio n ... 186
7.1.3 Linking gene functions... 190
7.1.4 Limitations of current tools... 192
7.2 Development of an analysis tool... 193
7.2.1 Developmental drivers...193
7.2.2 Requirements for an analysis environm ent... 194
7.2.3 Developmental aim s...194
7.3 MADRAS Microarray Data Review and Annotation System...195
7.3.1 Key concepts... 195
7.3.2 Technical details...197
7.4 Functional Overview of MADRAS...199
7.4.1 Data exploration... 199
7.4.2 Annotation searching... 202
7.4.3 Gene pattern finder... 202
7.4.4 Integration of pathway inform ation... 205
7.4.5 Probelist analysis...205
Chapter Eight Summary and Discussion... 212
8.1 Microarray data analysis...212
8.1.2 Analysis stages to determ ine differential gene expression... 213
8.3 Exploring best practice using the Affymetrix Latin square dataset...214
8.2.1 Factors influencing the choices of expression m etric...214
8.2.2 Application of post-metric analysis normalisation... 215
8.2.2 Data transform ation...216
8.2.3 The utility of statistical tests to identify differential gene expression... 217
8.3 Drawing conclusions on “best practice”... 219
8.3.1 Reviewing the inference obtained from the Latin square d a ta se t... 219
8.3.2 Experimental design and sample size... 220
8.3.4 The requirem ents to better define “best practice”... 221
8.3.4 Future horizons in expression analysis... 222
8.4 Making biological sense of analysis results... 223
8.4.1 Integration of resources to improve exploration efficiency...223
8.4.2 Improving overrepresentation analysis... 224
8.4.3 Building and extending the MADRAS system ... 225
8.5 Conclusions... 226
Chapter Nine Materials and Methods... 228
9.1 Introduction... 228
9.2 Data distributions and their effect on analysis o p tio n s...228
9.2.1 Introduction to the Affymetrix Latin Square dataset... 228
9.2.2 Overview of Expression M etrics... 229
9.2.3 Data filtering and preparation... 232
9.2.4 Technical M ethodologies...232
9.3 Statistical approaches to the detection of differentially regulated genes in Affymetrix datasets...234
9-3-3 Overview of analysis... 235
9.3.4 Performance assessment using FDR curves... 236
9.3.5 Development of an analysis framework...236
9.3.6 Statistical testing...239
9.4 Approaches to data norm alisation...240
9.4.1 Examination of data distributions following norm alisation... 240
9.4.2 Refinement of the analysis fram ew ork...240
9.4.3 Implementation of normalisation techniques... 240
9.4.4 Implementation of statistical testing...241
9.5 Application of robust statistical testing...242
9.5.1 Refinement of the analysis framework... 242
9.5.2 Implem entation of robust statistical te s ts ...243
9.5.3 Randomisation testing ... 243
9.6 Application of a Bayesian Framework...244
9.6.1 Refinement of the analysis framework... 244
9.6.2 Implem entation of a Bayesian framework...245
9.7 Approaches to annotation and exploration of Affymetrix microarray d a ta 245 9.7.1 Implementation of the software platform ...245
9.7.2 MADRAS database design and im plem entation...246
9.7.4 Data upload to MADRAS...248
9.7.3 Technical implementation of analysis features... 249
Appendix One Overview of R functions created for distribution and FDR
investigations... 251
File: boxcox.r... 251
Function: box.cox... 251
Function: box.cox.norm... 251
File: basic_ tests.r...252
Function: foldchange... 252
Function: welch.p...253
Function: m w u.p...253
File: ro b u st_ tests.r...254
Function: m ed_m ad.p ... 254
Function: m ed_sd.p... 254
Function: m ean _ m ad .p ... 255
Function: trim m ed.p... 255
Function: Windsor.p... 256 Function: yuen.p...256 File: bayesian_tests.r...257 Function: bayesian.t... 257 File: latin2testing.r...258 Function: makeRTindex...258 Function: m akeRTdata...258 Function: fd r.te st...259 Function: fdr.plot... 261
File: random ised.r...262
Function: random ised.p...262
Function: random ised.p.error...262
Appendix Two Overview of script and code to implement the
randomisation t-test...264
File: w rapper.pl... 264
File: randc2.exe... 265
List of Abbreviations Used
AUC Area Under the Curve
CEL Affymetrix Cell Intensity File
dChip PMMM dChip Perfect Match / Mismatch MBEI dChip PM-Only dChip Perfect Match Only MBEI
FDR False Discovery Rate
MADRAS Microarray Data Review and Annotation System
MAS Microarray Suite
MBEI Model Based Expression Indices
Q-Q Quantile-Quantile
RMA Robust Multi-Chip Average
Chapter One
Introduction
In this Chapter, the concepts, technology and implementation of gene expression profiling are introduced and explored. Section 1.1 introduces functional genomics and the biological importance of gene expression. Section 1.2 introduces the techniques of microarray expression m easurem ent and compares different technological approaches. Section 1.3 introduces the Affymetrix GeneChip system, the design and manufacture of a GeneChip, and the technological process in transferring a biological sample into experimental data. Section 1.4 discusses the analysis stages required to convert the scanned m icroarray image into a numerical result and the type of analysis th at can subsequently be applied to the data to enable biological understanding.
1.1 Gene expression profiling
Significant advances in molecular biology have occurred as a result of the application of high-throughput techniques to experimental problems. Application of these technologies has accelerated the achievements in genome sequencing over the last few years and contributed to the completion of many sequencing projects including many microbial genomes, a few from higher organisms, as well as substantial parts of other eukaryotic genomes.
To biomedical researchers, the draft release of the hum an genome sequence (Lander, et al., 2001; Venter, et al., 2001) is purported to form the firm foundation for biomedical research in the decades ahead, allowing for further study into the mechanisms of hum an biology and the study of inherited disease.
However, the genome sequence only is only the start of the biological process and can be thought of as representing the “p a rts list” for an organism (Skolnick and Fetrow, 2000). To realize the full potential of the sequencing accomplishment, the information m ust be taken forward to assist in the understanding of how genomes function and to study the many interactions within an organism.
The ability to m onitor the expression of many genes simultaneously at the transcript level has become possible due to the advent of DNA microarray technologies (Pease, et al., 1994; Schena, et al., 1995). Microarrays provide the possibility for examination of the expression patterns of many previously uncharacterised genes and may provide clues to their possible function by comparison analysis.
Combinations of this information allow for the formulation of metabolic schemas to understand how pathways are changed under varying conditions a cell is exposed to. Advancements in the application of these high-throughput technologies is set to allow data collection on a scale previously unparalleled and will allow for the comparative study of entire genomes and their resultant elements between species as well as characterise the mechanisms behind individual variations and the complex interplay that allows an organism to function.
1.2 Introduction to microarray technologies
Microarray technology makes use of the sequence resources created by the genome projects and other sequencing efforts to measure the cellular transcription of many genes simultaneously based on the principle of hybridisation. Hybridisation has been in use for many years in molecular biology and forms the basis of the established techniques of N orthern and Southern Blotting.
1.2.1 Evolution of the microarray
In Southern blotting, a short labelled nucleic acid probe (either DNA or RNA) is used to hybridise to complementary fragments of DNA th at have been separated according to size by gel electrophoresis. Radio-labelling of the oligonucleotide enables visualisation using photographic film sensitive to radiation (Southern, 1975). Northern blotting is similar b u t oligonucleotides bind to mRNA run through a gel and transferred to a membrane. The intensity of any resultant band on the film is a semi-quantitative measure of the am ount of DNA or mRNA present, in comparison to a known standard. Evolving from the insight that labelled nucleic acid molecules could be used to interrogate nucleic acid molecules attached to a solid support, arrays are based on the ideas of a mass parallel version of these blotting techniques (Lander, 1999). The principle difference between blotting techniques and arrays is the immobilisation of the probe to the substrate in a microarray. Evolution of the technique from blotting first lead to the development of “m acroarrays”, which explored expression levels by hybridizing mRNA to cDNA libraries gridded on nylon filters.
Technical improvements lead to the development of the microarray, which utilises a non-porous solid support. In addition to the m iniaturisation opportunities the rigid substrate offers, a technical advantage is obtained due to the fact that neither the target nucleic acids (normally cDNA) nor the post-hybridisation wash solutions are required to perm eate into nitrocellulose pores, and therefore the rates of the hybridisation and washing steps are increased (Southern, et al., 1999).
1.2.2 Overview of microarray technology
Microarrays exploit the binding of complementary single-stranded nucleic acid sequences. Whereas a Southern blot utilises on only one probe, in a microarray, thousands of known probes are fabricated onto a solid substrate (e.g. a glass slide) in a specified order. There may be tens of thousands of spots on an array, each containing a huge num ber of identical DNA molecules or fragments of molecules, with lengths from twenty to hundreds of nucleotides.
Whilst there are differing implementations of the fundam ental ideas behind microarray technology, the stages of production and experimentation are common between the different methodologies. Firstly the microarray m ust be designed and produced. DNA complementary to genes of interest is generated and laid out in microscopic quantities on solid surfaces at defined positions according to the array design. In the design stage, attention m ust be given to the sequences identifying genes of interest to overcome issues of families of similar genes sharing sequence and the effects of splice variants. The next stage of experimentation converts the expression mRNA into a labelled complementary DNA, enabling it to be eluted over the surface and form complementary DNA binds. The presence of bound DNA is detected by fluorescence following laser excitation and then used to form an estimate of the relative level of gene expression.
Whilst the basic technology is the same, differences exist in the types of microarray available to the researcher based on the form of sequence used for detection, and the m ethods by which the sequence is applied to a solid substrate. The sequence can be applied to the slide using a robot to spot previously produced sequences to the array, or synthesized by photo-lithography or by ink-jet printing technologies.
The second difference is in the length of DNA sequences that are laid down on the array. Either full length complementary cDNA sequence or a particular segment in the form of a unique oligonucleotide sequence is placed on the slide to enable expression specific hybridisation.
Techniques involving oligonucleotide sequences and photo-lithographic production methods are generally the proviso of commercial microarray systems whereas the full length cDNA arrays are within the rem it of the researcher to design and produce the array slides (e.g. Cheung V.G, et al. 1999) and as such are normally a cheaper solution.
1.2.2.1 cDNA microarrays
cDNA microarrays use robotic techniques to spot glass slides at precise points with complete gene/EST sequences in the form of a pre-synthesised cDNA to generate a probe. As a result of the circular probe formation left on the chip and the process of the applying liquid droplets of cDNA to the slide, these arrays are often term ed spotted arrays. cDNA arrays offer a high degree of flexibility and can be designed and implemented using off the shelf hardware in a typical research environment, allowing the researcher complete control over the array design and features (Schulze and Downward, 2001). In addition the technology is sequence independent making it ideal for species with limited genome sequence availability (Chen, et al., 2004).
Experimentally cDNA arrays are normally subjected to differential expression by use of simultaneous, two-colour fluorescence hybridisation. Fluorescent probes are prepared from two mRNA sources to be compared one channel comprising of a green dye (Cy3) and the other a red dye (Cys). The probes are mixed and then eluted over the microarray slide for an extended period to allow hybridisation to occur.
As a result of the simultaneous two-channel experimentation, complex issues of experimental design have evolved to overcome dye-biases and the general effects of simultaneous processing. It is generally accepted th at cyclic design incorporating dye- swaps between channels is the optimal solution, b u t this has the limitation of closing the experimental loop and makes extension studies more difficult to plan (Churchill, 2002). Potential problems in the use of cDNA technologies include the maintenance of cDNA libraries needed for probe manufacture, and the occasional misidentification of probe sequences (W arner and Dieckgraefe, 2002).
1.2.2.2 High-density oligonucleotide arrays
In contrast to the high level of control the researcher has over the type, number, and identity of probes when using cDNA microarray systems, high-density oligonucleotide arrays are generally purchased as ‘off the shelf solutions with chips representing a standard range of probe sets (Lipshutz, et al., 1995). Custom designed arrays are available, and have been successfully developed by consortiums of researchers working on organisms for which catalogue arrays are not available, however for the average biological researcher the additional development and production costs for this form of array will m ost likely prove prohibitive to a customised design. However, the large num ber of probe sets (>47,000 on the HG-U133+ chip) incorporated on the chips compensates for this limitation.
Oligonucleotide arrays are m anufactured using a combination of photolithographic and combinatory chemistry techniques (Lipshutz, et al., 1999), resulting in an extremely high feature density with complete control of the sequence laid down on the array. Typically, a set of unique oligonucleotide probes form a probe set providing information to represent a gene or expressed sequence tag (EST). However the array design requires sequence data to allow probe design, and there is a risk of uneven performance by individual array elements dependant on the rules used for oligo selection.
Despite potential issues of low specificity and sensitivity in short oligonucleotides and the converse issues of higher cost in purchase of large num ber of long oligonucleotides, high-density arrays offer a much more integrated system for experimental workflow by virtue of the commercial production of arrays and eliminate the potentially error-prone and time-consuming process of handling cDNA resources. Further details of the Affymetrix high-density oligonucleotide array system and the stages of experimental processing and analysis are described in Section 1.3
1.2.3 Application of microarray technology
Microarrays provide information on the relative expression levels of thousands of genes simultaneously. The information th at such an experiment obtains can be used for a variety of purposes supporting research from the basic sciences, through pharmacocgenomic drug testing to applications in clinical diagnosis (Debouck and Goodfellow, 1999). W ithin the basic sciences microarrays provide the ability to explore the gene expression between differing cell types over time and in response to differing disease states. They also provide a potential mechanism for the development of interaction maps between genes and the downstream effects these produce (Clarke, et al., 2001).
W ithin pharmacogenomics, microarrays can assist in drug discovery by identifying the exact targets and actions of drugs and provide information of toxicological effects within the cell (Ivanov, et al., 2000; Nees and Woodworth, 2001). Clinically, microarrays have presented as a method to improve the pathological classification of disease and provide the potential for patient specific treatm ent derived from the results of identified bio-markers (Perez, et al., 2004). Microarrays have been shown to be effective in this regard with the identification of additional classes of breast cancer subgroups, which whilst appearing phenotypically identical, present with different transcription profiles (Hedenfalk, et al., 2003).
1.2.4 Limitations of microarray technology
Whilst microarrays are a powerful tool to enable a snapshot of the transcription events with a cell, they do present with limitations in their scope and of the information the technique can provide. The key proviso of the techniques is th at the physiological state of an organism may not be reflected by gene expression or RNA levels. The am ount of mRNA may not correlate with am ount of translated protein and the expression of a protein may not always produce a detectable physiological activity or response.
In addition, mRNA is an unstable molecule, with the half lives of the messenger varying considerably. This makes the reproducible extraction of mRNA difficult. For mRNA th at has been extracted without due care, all th at may remain after extraction is the stable mRNA, which have not been subject to degradation and may not provide as much insight into the experimentally im portant transcription changes.
In Section 1.1.1 the concept of alternative splicing was introduced. Within the context of a microarray experiment, the researcher m ust consider to what extent changes in observed signal from a messenger are due to alternative splicing rather than a change in transcript abundance. Current knowledge of alternative splicing is limited, making array design to explore and account for this effect problematic. However, in theory the multiple probes present for each gene within high-density oligonucleotide systems should be able to reveal alternative splicing if probes span an alternative splice junction (Lee and Roy, 2004). However, looking for changes in the relative intensity of probes across a gene m ight reveal this but it doesn’t exclude the possibility of changes in cross hybridisation for some of the probes within a gene.
Technically quantification of transcription requires additional knowledge of how well each probe binds to its target before it can be used to deduce anything about the absolute mRNA concentration present in the cell. This can be achieved by using known concentrations of mRNA to calibrate each probe set. However, this is a labour intensive task if working with more than a few mRNAs. Whilst purists may argue that microarrays are therefore limited to m easurements of whether a mRNA is present or not above the detection threshold, many researchers prefer to consider the microarray as a *!snapshot view " of the current cellular transcription, one th at can be used for hypothesis generation and is often supplemented with more accurate complimentary experiments (e.g. quantitative RT-PCR).
1.3 Affymetrix GeneChip technology
The Affymetrix GeneChip system is a commercial microarray system based on oligonucleotide array targets synthesised by a photolithographic process. The design and verification of the array is done commercially and is shipped as a plastic cassette containing the array, in which all hybridisation reactions occur (Lipshutz, et al., 1999). It is data from this microarray system th at forms the basis for the work presented in this thesis.
1.3.1 Overview of technology features and production
Each gene is represented on the array by a series of different 25-mer oligonucleotide probes, which are directly synthesized onto the array. At the tim e of writing, each array contains up to 1.3 million different oligonucleotide probes (HG-U133+ array) with millions of oligonucleotide copies at a location on the array. The Affymetrix GeneChip design implements probes in pairs, consisting of a perfect match oligonucleotide and a mismatch oligonucleotide. The perfect match probe has a sequence exactly complimentary to the particular gene and thus measures the expression of the gene. The mismatch probe differs from the perfect m atch probe by a single base substitution at the centre base position.
The presence of the mismatch probe is argued to disturb the binding of the target gene transcript, help to determine the background signal and help control for any non specific hybridisation th at contributes to the signal m easured for the perfect match oligonucleotide.
GeneChip arrays are commercially manufactured using a combination of photolithographic and combinatorial chemistiy techniques building many arrays simultaneously on a 5-inch square quartz glass wafer.
In manufacture, linker molecules are applied to the glass wafer to form a covalently linked molecule-matrix which enables the synthesis of oligonucleotide strands onto the array. This process proceeds in a parallel process with the addition of A, C, T, or G nucleotides to multiple chains growing simultaneously by the programmed application of photolithographic masking techniques which expose or protect the linkers on each strand.
1.3.2 Chip Design
The design of each oligonucleotide arrays is reliant on the availability of accurate sequence information. Early chip designs (e.g. Hu68oo) were based on sequence information obtained from GenBank exemplar sequences (a single sequence that represents a cluster of different sequences) from preliminary UniGene clusters. This was improved on in the design of the U95 chip series with the alignment of UniGene data using a cluster and alignment tool to form a consensus sequence where each base had agreement from 75% of the aligned sequences. The most recent design methodology for the latest U133 chips improved on previous practice and utilised sequence information from UniGene, dbEST, WUSTL, GenBank and RefSeq to form a the consensus sequence to which probes were then designed.
The probe spacing in early chip designs was approximately equal along an expressed sequence. However, the U133 design involved spacing to favour high quality independent probes in an attempt to ensure that multiple probes give measurements independent of the target (Affymetrix, 2001a). Probe uniqueness is required in order to minimise cross hybridisation to similar targets from unintended sequences. The Hu68oo and U95 chips were designed with probes that have 21 or more bases (out of 25) matching those in other probes excluded, as they were deemed too similar. In the design of the U133 chips the criteria were altered to exclude probes with two 8mer matches (including at least one with a I2mer match).
F ig u re 1.2
5' 3'
Probes
TGTACCTAGTACTACTGGCTAGTAAGCCGTCTATCGGTATC Genome Sequnce
CATGATGACCGA TCATTCGGCAGAT Perfect Match Sequence CATGATGACCG2 ACATTCGGCAGAT Mismatch Sequence
Figure 1.2 - Overview of probe location and design in relation to the genomic sequence
Mismatch probes are identical to the perfect match ones, but with an alteration of the middle (13th) base to be different to that expected from the expressed sequence, thus forming a mismatched hybridisation. A summary of the probe makeup of a probe set is shown in Figure 1.2. As part of the design process, probes for a given probe set are randomly assigned locations on the chip in an attem pt to avoid location effects during the hybridisation process.
Improvements in the design algorithms and probe quality have allowed for a decrease in the num ber of probes in probe set from 16-20 down to 11 which has allowed for greater information density. The combination of fewer probes, along with a decrease in probe feature size on the array from 20 microns to 18 and m ost recently down to 11 microns, means th at many more probe sets can be fitted onto a single array.
1.3.3 Sample processing
The experimental stages required to extract RNA from samples and hybridise these to GeneChips varies according to the experimental organism (Affymetrix, 2004). In eukaryotic samples, the process begins with total RNA isolated from cells (e.g. a tissue sample or cell line). The total RNA is reverse transcribed in two separate stages to produce double-stranded cDNA before a cleanup procedure is then carried out on the cDNA. The next stage involves the amplification of the cDNA into biotin labelled anti sense cRNA which is also subjected to a cleanup procedure before fragmentation into segments typically 25-200 bases long.
At this stage, a num ber of controls are added which are used to locate the edges and com ers of the array (oligo B2), along with control th at can provide information on the hybridisation, washing and staining procedures (E-coli genes; BioB, bioC, bioD and ere). An additional five genes from B. subtilis, (dap, thr, trp, phe and lys) are also present on the chip, which are used by some researchers as additional controls or features used from normalisation between arrays (Hill, et al., 2001).
The fragmented biotin-labelled cRNA, along with the controls are mixed to form a hybridization cocktail which is inserted into the array cartridge before being placed in a hybridization oven for 16 hours, during which time the sample is eluted over the chip at optimal hybridisation tem peratures. During hybridisation, the fragmented cRNA and controls bind to the oligonucleotides on the array utilising the complementary binding properties of DNA.
Following hybridisation, non-hybridised cRNA is removed from the cartridge and the array is placed in a “flu id ics sta tio n”, where a series of washing and staining steps are applied to the array including the addition of a fluorescent staining agent streptavidin- phycoerythrin (SAPE) which binds with the biotin labelling on the cRNA.
After the washing and staining process the array is removed from the fluidics station and placed in a laser scanner. Laser light is applied to the array which excites the fluorescent staining agent. At locations where more cRNA is hybridised a brighter signal is observed. Each probe array is scanned twice, taking up to ten minutes, depending on the array format. The software calculates an average of the two images, defines the probe cells and computes an intensity for each cell. The double scan improves assay sensitivity and reduces background noise. The am ount of signal em itted is recorded as a value in 16 bits, with many pixels comprising a single probe. The Affymetrix control software stores this image as a D AT file.
The final stage in the experimental processing is the application of a grid to the array according to the signal obtained from the corner and edge controls. These are used to superimpose and align a grid upon the image which is then used to produce a single expression value for each probe using the 75th percentile of the pixel intensities for each probe cell. The probe intensity values are then written into a CEL file. This CEL
file forms the bases of the majority of data analysis options which are explored further in the course of this thesis.
1.4 Interpretation of microarray data
There have been several studies undertaken to validate the technology and explore the biological meanings of the resultant data. Chudin et al. compared signal level relative to spiked in transcript concentration as a sensitivity study and found linearity over the middle range of signal values with deviation at the extremes (Chudin, et al., 2002). Naef at al., undertook experiments to characterise the expression to noise ratio and found a relationship between the standard deviation of values and noise and an intensity dependence of the standard deviation of the resultant data (Naef, et al., 2002).
Li et al. examined the sensitivity and specificity between the Affymetrix oligonucleotide microarray systems and cDNA arrays and found large differences in the values produced for allegedly comparable data. They concluded th at oligonucleotide microarrays is more reliable for interrogating changes in gene expression than data from long cDNA microarrays (Li, et al., 2002).
The central concept of any m icroarray data analysis is one of data reduction. If we look at a single Affymetrix U133A chip the values for millions of oligonucleotides are reduced to a single value for each of the 267,397 probes. The data obtained from each set of (on average) eleven probes is then used to calculate a score for each of 22283 probe sets representing a transcript. This is then repeated across a num ber of chips presenting a researcher with somewhere in the region of a quarter of a million data values for further analysis, from a 10 array experiment.
Dependent on the type of experiment being undertaken, the next stage in the analysis process may be the further reduction of this data to a list of significant changes within the d ataset Due to the volume of data being produced in the course of an experiment, the analysis stages undertaken during data reduction are an essential process to make data both comparable and usable.
1.4.1 Computing expression values from image data
The first im portant analysis step in any microarray experiment (both cDNA and high- density oligonucleotide) is the conversion of the image file representing the scanned array to a numerical representation of transcript expression. As part of this process various potential experimental artefacts in the data must be tackled in an attem pt to overcome experimental variation and make data comparable between identical experiments. This is achieved with the application of normalisation and scaling methodologies.
Concentrating on the analysis of data from the Affymetrix GeneChip system, the first stage of analysis after the initial reduction of the full image to a representative CEL file image (see Section 1.3.4) are a num ber of stages resulting in the production of expression values for each probe set present on the chip. As each transcript is represented by a num ber of probes on the chip, these m ust be combined and reduced to form a single value for gene expression.
The production of an expression value requires the integration of data from numerous perfect match and mismatch probes representing both a measure of actual transcript expression and a component indicating the non-specific binding to the probes. In addition to the two methodologies for this process provided by Affymetrix within versions of their Microarray Suite software, numerous alternative methods of computing expression values have been proposed. Popular alternatives include the Model Based Expression Index (MBEI) (Li and Hung Wong, 2001a; Li and Wong, 2001b), the Robust Multi-chip Average (RMA) (Irizarry, et al., 2003) and an improved
Common to all these methods is a three stage analysis approach. Stage one applies a background correction to the array to make data comparable across the array and identification of the detection threshold. Stage two incorporates varying methodologies for the incorporation of the probe data into an expression value. Some of these methods follow a heuristic approach whilst others are strongly statistical, whilst others incorporate all the probe data and other disregard mismatch data. Stage three, overcoming data variability, is discussed in Section 1.4.2.
The varying methods for the low-level analysis of high-density oligonucleotide arrays all have a common goal; to produce biologically meaningful expression values by application of a specific blend of data manipulation and modelling of the probe intensity data. Rajagopalan compared the relative performance of different expression metrics for their accuracy in producing concentration curves and correct fold-change detection within the Affymetrix Latin square dataset. Rosetta Resolver and MAS 5.0 were found to out perform the dChip PM-Only model (Rajagopalan, 2003).
Optimally, the resultant expression values should be both precise (low variance between observations) and accurate. Chapters Three and Four concentrate on a comparison of these different expression metrics, and the ability of each to correctly identify changes within a dataset.
1.4.2 Issues of data variability and normalisation
Bakay et al. assessed the sources of variability in experimentation and experimental design using clinical biopsies and concluded th at inter-patient differences were the m ost variable effect, with only a m inor contribution from experimental variation (Bakay, et al., 2002).
However, scaling and normalisation steps are essential to overcome the effects of technical variation and systematic experimental error and aim to produce data that is comparable between arrays. Normalisation can summarised as a focused goal of getting num bers from one chip to mean the same as numbers from another chip.
Normalisation for microarrays generally makes the biological assumption th at the vast majority of genes on the array are unchanged; however, some researchers have chosen to implement normalisation based on a selection of known invariant control genes or use a set of “housekeeping genes” whose expression are believed to remain constant and are used to scale the other expression values accordingly (Geller, et al., 2003).
Normalisation steps can be applied at many differing stages of the analysis process, and are key to the methodologies for many expression metrics; however they can also be applied post-expression analysis to overcome remaining issues of dissimilarity between biologically identical chips (Bolstad, et al., 2003; Durbin, et al., 2002). Investigations into the effect of post expression analysis normalisation are discussed and explored further in Chapter Five.
1.4.3 Experimental approaches using microarrays
Analysis of the expression values obtained from a series of experiments can be split into two main areas, pattern recognition (clustering and learning techniques) and detection of differential gene expression (Nadon and Shoemaker, 2002).
Pattern recognition involves the application of cluster analysis or class discovery, which results in grouping of chips and probe sets according to the experimental data. This can then be compared to clinical phenotype data for the purposes of identifying the genetic patterns (or fingerprint) of a given clinical condition. There are a variety of techniques available for the supervised and unsupervised clustering of data including hierarchical clustering, k-means clustering, self-organising maps and principal components analysis (Dudoit and Fridlyand, 2002; Knudsen, 2002).
For the biological researcher, however, many microarray experiments are of an exploratory nature, conducted to generate hypotheses to guide future research. Experiments of this type can include prior knowledge evaluation where a researcher is examining a wide series of effects within a known system of interest and inferring new information from the results, or more generic “gene fish in g ” experiments where a researcher is looking for new interesting results to potentially explain the phenotypic differences observed in the laboratory.
The common feature between these approaches is the desire to identify differentially regulated genes th at may be of in tere st The process of data analysis is typically concerned with the reduction of this data to a fist of “significant” findings for follow up using complementary validation techniques (e.g. RT-PCR). This analysis stage forms yet another data reduction process, where the results for many probe sets across many chips are processed to a smaller list for further examination.
In many respects, data analysis methods are in their infancy, with the answers to many basic questions shadowed by work on more complex computational and statistical methods. Understanding the fundamental concepts is essential in the application of
As Quackenbush comments, “Sophisticated computational tools are available but the methods th at are used to analyse data can have a profound influence on the interpretation of the results. A basic understanding of these computational tools is therefore required” (Quackenbush, 2001).
1.4.4 Techniques to identify differential gene expression
The aim of all experiments and subsequent analysis is to make the strongest possible conclusion from limited amounts of data. Biological variability and differences in experimental accuracy can make it difficult to separate real differences from those occurring due to random variability.
The hum an brain has an exceptional ability for pattern recognition, even from random data. It is natural to conclude th at these observed differences are real effects and to exclude the possibility for random variation from our judgement. Analysis techniques and statistics exists to prevent this occurring and add a degree of certainty to any conclusions reached as well as allowing for the efficient analysis of the vast volumes of data a microarray experiment produces.
1.4.4.1 Non-specific filtering techniques
After normalization and estimation of the expression levels some anomalies may exist. For example there are sometimes estim ated expression levels th at are negative or ones th at are much too high. In addition, data obtained from the early versions of Affymetrix Microarray Suite software (prior to version five) and from certain dChip models (Li and Hung Wong, 2001a; Li and Wong, 2001b) contained some negative intensity scores in the output.
Negative num bers cause issues when working out ratios and applying transform s to data so it became customary to shift these values to positive numbers. Examples of approaches used to overcome this include the addition of a shifting factor to all signal values or the replacement of all num bers less than 20 with a signal value of 20. Whilst this overcomes the problem presenting, it also has the effect of changing the distribution of the data, and may change the outcome of analyses further downstream. Other non-specific techniques are used to reduce the am ount of data for downstream analysis, in many cases to remove potentially problematic data prior to the application of fold-change calculations (Kersten, et al., 2001; Teague, et al., 1999).
As a comprehensive example of the types of filtering th at can be applied to a data set, Golub et al. (Golub, et al., 1999) pre-processed their data in three stages. First thresholds were applied to the data, removing the upper and lower most values. Secondly genes were removed from analysis where the maximum minus the minimum intensity of a gene across arrays was less than a pre-determ ined figure and those where the ratio of maximum intensity divided by minimum intensity was less than a defined threshold.
Finally Golub et al. transform ed their data by taking base ten logarithms of the raw data. The application of a transform as part of analysis has been employed by many researchers, for a variety of heuristic reasons (Grant, et al., 2002; Katsuma, et al., 2001; Virtaneva, et al., 2001). Virtaneva comment the reasons for application of a log transform to their data was to “reduce skew and the desired variability properties”.
An investigation of the application of these techniques and specifically transformation is addressed in Chapters Three and Four.
1.4.4.2 Identification of differentially regulated genes
Early work on microarray data involved the application of non-specific filtering techniques (the removal of probe sets th at fail to adhere to a set of arbitrary rules (Golub, et al., 1999) and analysis of the ratio of gene expression between various grouped samples (Bowcock, et al., 2001; Cao, et al., 2001; Jiang, et al., 2001; Luthi- Carter, et al., 2000; Newton, et al., 2001; Porter, et al., 2001; Sandberg, et al., 2000; Unger, et al., 2001). Other researchers (Svaren, et al., 2000) simply chose the fifty highest expressed transcripts in their resultant dataset.
The lim itation of this approach is a lack of a confidence measurement in any observation obtained from a microarray experiment. For example two genes which are both very low expressed in term s of their signal m easurem ent may be identified as significant, whilst moderate changes in the m easurem ent of a higher expressed gene may be deemed insignificant.
Scientists are often presented with data with small differences in the observations compared to experimental imprecision and biological variability and large variances in their observations. Statistical methods have been designed to deal with each of these problems and provide a robust measurement of any differences p resen t Application of non biased statistical tests give both access to information of which genes are likely to be differentially expressed, , but also provide a score for confidence in any result identified.
In the early days of statistics, it was assumed that most analyses would deal with large datasets and small samples were too small to be of any value. Opinion has gradually changed with the realisation th at differences in large datasets are most often obvious. It is the smaller sample size th at w arrants the attention of statistical investigation in order to extract reliable conclusions from limited amounts of data.
Deterred by the cost of replication of comparatively expensive microarray experiments, some researchers have attem pted to develop and apply techniques to minimise the requirem ent for experimental replication. Ron et al. reported good results when comparing the Affymetrix change p-values to the t-test and concluded this was a good method of reducing the requirem ent for replication (Ron, et al., 2003), whilst Kamb and Ramaswami used the technique of difference averaging to avoid multiple replicates (Kamb and Ramaswami, 2001).
Most statistical tests have been designed for situations where the num ber of observations exceeds the num ber of factors th at may influence the result. Unfortunately microarray experiments consist of a large num ber of parallel observations. Wolkenhauer term ed this issue in relation to microarrays as “the curse o f dim ensionality” (Wolkenhauer, et al., 2002).
Despite issues with the application of statistics to microarrays, they have proven a popular and ultimately useful tool for the identification of differentially expressed genes.
Many classic statistical techniques have been applied in the identification of differentially regulated genes in microarray data sets, including several variants of Student’s t-test (Baldi and Long, 2001; Dow, 2003; Kooperberg, et al., 2002; Korn, et al., 2002; Lonnstedt and Speed, 2002; Tusher, et al., 2001) and ANOVA, an extension of the t-test for multiple groups of data. (Kerr, et al., 2000; Pavlidis and Noble, 2001). Non-parametric equivalents of these tests have also been utilised (McKay, et al., 2004). Other researchers have chosen to undertaken analysis using multiple statistical techniques and then integrate the results to draw conclusions about the changes in their data. Welsh et al. employed a variety of methods including difference of mean, fold-change, t-test and clustering methods (Welsh, et al., 2001), Wang et al. combined results from the t-test and Westfall and Young perm utation t-test for multiple correction (Wang, et al., 2002), whilst Tan et al. used the t-test and Mann-Whitney test to analyse their data for differential gene expression (Tan, et al., 2002).
The t-test and SAM technique (Tusher, et al., 2001) which implements a more robust version of the t-test have also proven popular analysis techniques (Mootha, et al., 2003; Tudor, et al., 2002).
In addition to the application of these more traditional testing approaches, research has developed novel techniques for the detection of differential gene expression. Jenssen et al. developed and applied a log rank test (Jenssen, et al., 2002), Jain et al., developed a local pooled error method and compared results versus the t-test and Westfall and Young perm utation t-test (Jain, et al., 2003). Li et al. developed a rank method based on the sums of detection calls (absent / marginal / present) (Li, et al., 2002b). Other researchers (Hatfield, et al., 2003; Saidi, et al., 2004; Tong, et al., 2001) have implemented the Baldi and Long Bayesian t-test framework (Baldi and Long, 2001). A variety of perm utation techniques have also been developed for application to microarray data including Permax, which assigns a limited num ber of perm utations to the dataset (Martin, et al., 2001; Mutter, et al., 2001). Pan utilised various perm utations of simulated dataset utilising ROC curves to access performance of a variety of methods including non-param etric techniques, SAM and an empirical Bayes method (Pan, 2003). Xu and Li reported the application of a perm utation method applied to dChip data and made comparisons of gene ranks in the output compared to non-param etric methods (Xu and Li, 2003) and Park et al. developed and applied a perm utation based ANOVA test (Park, et al., 2003).
However, the use of statistical techniques to analyse microarrays have often been applied in a somewhat ad-hoc fashion, often due to a lack of options available to validate the application of a technique to a dataset, with many researchers choosing to implement multiple tests in order to obtain a consensus confidence in the results obtained. Chapters Three to Seven are concerned with the validation of statistical methodologies and their application to Affymetrix GeneChip arrays. The investigations have followed a "back to basics” approach in an attem pt to overcome the hurdle of understanding and infer maximum significance from minimum resources.
1.4.5 Making sense of microarray experimental findings
Most im portant biological activities are not the result of a single molecular activity, and generally result from choreographed activities of multiple molecules often acting as functional pathways. To fully understand how organisms function we will have to understand the relevant pathways for th at organism.
The parallelization of experimentation within a microarray experiment provides the information required to attem pt conclusion about gene interaction by relation of the levels of many genes simultaneously.
The results of a statistical analysis may typically return a list of between 200 and 1000 genes tagged as significant. Practically a molecular biologist might consider following up around twenty genes and thus a list of 500 genes with no clue to relative priority may be of little help to guide future experiments. An im portant, b ut often overlooked final stage of a microarray experiment is the annotation of the data, allowing for functional links between findings to be made. Techniques and tools for the effective annotation and exploration of experimental findings are discussed in detail in Chapter Seven.
Chapter Two
Data distributions and their effect on analysis
options
In this Chapter the issue of data distributions of microarray datasets is explored. Section 2.1 introduces the importance of data distributions and the effect these have n the choice of statistical test th at can be applied to a dataset. Section 2.2 reviews the m ethods used to investigate the normality of data from a variety of expression metrics. Section 2.3 explores the data distributions of six expression metrics using a variety of techniques and investigates the effect of data transform ations on data distribution. Section 2.4 discusses the results and observations regarding the observed data distributions and the effects these have on the use of statistical tests in an analysis.
2.1 Introduction
The importance of investigating differential gene expression is evident from the various cell types in an organism th at all contain the same genetic information, b ut are phenotypically very different from each other in function and appearance. Many of these differences are fundamentally due to differences in gene expression between different cells.
The mass-parallelisation of techniques able to detect gene transcription provides potential insight into the full pattern of gene expression in a cell rather than the study of single genes and messengers. To the clinician the characterisation of patterns within a dataset can yield classification information for disease, such as the determination of transcriptional signatures th at predict outcomes in breast cancers (Perou, et al., 1999).
2.1.1 Introduction to differential gene expression
However, to the laboratory-based researcher, the experimental goal may be centred more on determining the basic processes th at control an organism’s functioning or looking for malfunctions th at may result in disease. At this level the focus may be identifying changes in gene expression between only two or three different states in order to yield potential useful information about groups of genes implicated in the phenotypic differences observed. In their simplest and m ost common application, microarrays experiments are focused on the detection of differences between two different types of sample, such as differences between diseased and normal states or between treated and untreated groups.
Analysis of the am ount of data an experiment that ju st a simple experiment produces is not a trivial task due to both the am ount of data a researcher is required to analyse in parallel, combined with the potential complexity of tools available (Quackenbush, 2001). It is the understanding of the tools available and the aim of determining best practice in analysis th at forms the basis of the investigations undertaken and reported in this thesis.
2.1.2 Application of statistical techniques to microarray data
The aim of all experiments and subsequent analysis is to make the strongest possible conclusion from the available data. Biological variability and differences in experimental accuracy can sometimes make it difficult to separate real differences from those occurring due to random variability. The hum an brain has an exceptional ability for pattern recognition, even from random data. It is natural to conclude th at these observed differences are real effects and to exclude the possibility for random variation from our judgement. Analytical methods exist to prevent this occurring and add a degree of certainty to any conclusions reached.
In the early days of the development of microarray technologies analytic methods were often based on pair-wise comparison between chips, often using the ratio of expression signal between two samples (the “fo ld change”) as the method for determining differential expression of a gene between samples. Fold change however, is limited by it failing to account for technical and biological variability and processing each data point as an exact value contributing to the overall result and a single extreme outlying value could results in a result being returned as significant. Statistical tests present as a solution to this problem and can provide results which identify which probe sets are significant along with a value indicating the confidence of a result being true.
Many different statistical approaches have been explored to identify differential gene expression (Kerr, et al., 2000; Miller, et al., 2001; Nadon and Shoemaker, 2002). However, few guidelines exist based on the comparative performance of each test in relation to each other, regarding which is best at extracting meaningful biological knowledge from a microarray experiment. An im portant avenue of research thus presents in undertaking a uback to basics” approach to the analysis of microarray data, building analysis methodologies with sound theoretical and empirical grounding in contrast to an ad hoc analysis decision making process.
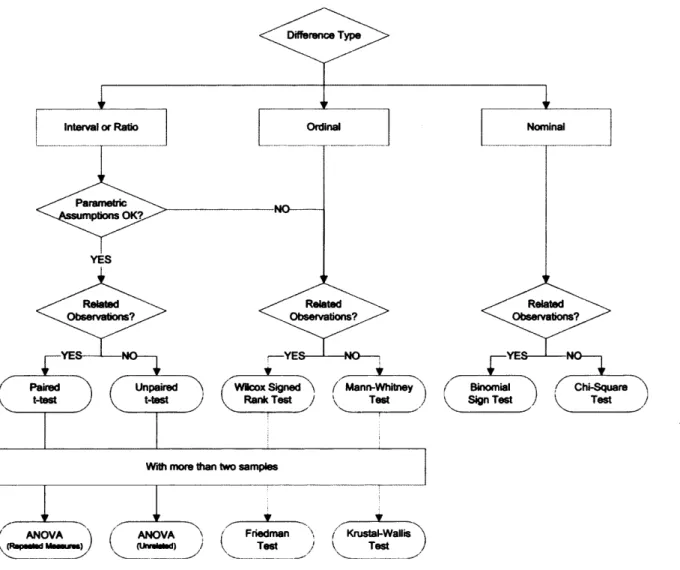
The review of any basic statistics book on the subject of determining differences between groups of data yields a series of additional questions about the data in contrast to a unified solution to the most applicable statistical test. A summary of some of the questions typically encountered and the resultant suggestion for most applicable statistical test is shown as a flow chart in Figure 2.1.
Figure 2.1
Difference Type Ordinal Interval or Ratio Parametric motions OK? Related Observations? Related Observations? ( Mann-Whitney Chi-Square Test jPaired Unpaired Wicox Signed Binomial Sign Test
--- " ^ '
With more than two samples
1' .... ...1E---. . --- *--- . , --- *---. ANOVA ANOVA (UnraMad) Friedman Test f Krustai-Wallis V Test
Figure 2.1 - Flow chart o f typical questions encountered in the quest fo r a statistical test looking fo r differences between two groups o f data. Interval and ratio data are continuous data where the differences are interpretable. Ratio data also contains a natural zero, allowing fo r interpretation o f the ratios. Ordinal data are categorical and contain a logical ordering to the categories. N om inal data is categorical data where the order o f the categories is arbitrary.
2.1.3 Reviewing key statistical assumptions and their relation to
Affymetrix Gene Chip data
Each of the questions posed leads to the researcher making statements about the nature of their data; to a statistician, these answers are term ed assumptions. There are very few large-scale validation datasets th at have been made available by the companies th at developed the technologies. As a result, researchers are often left attem pting to solve issues of assumptions using real-world datasets which are limited in size and usually contain no “know n truth” to test the outcomes of differing answers to these assumption questions.
Review of the questions posed in Figure 2.1 with the analysis of a microarray dataset in mind highlights the issue of whether the data meets param etric assumptions as a key question/assum ption without an answer. This parametric assumption is concerned with the question of whether the distribution of the data is comparable to a distribution of which the equation is known. Applied to statistical techniques in which sampling is involved, this comparison is usually made to the normal (or Gaussian) distribution.
2.1.4 Application of parametric testing to microarray data
Parametric statistical tests are popular as a method of identifying differentially regulated genes in microarray datasets partially as result of small experiment size due to the associated cost considerations or the limitations of sample availability. A variety of parametric tests have been developed for the identification of differentially regulated genes in microarray datasets, including several variants of Student’s t-test (Baldi and Long, 2001; Kooperberg, et al., 2002; Lonnstedt and Speed, 2002; Tusher, et al., 2001) and ANOVA (Kerr, et al., 2000).
These statistical tests have superseded earlier empirical methods that were often based on the magnitude of expression ratios, in combination with other heuristic filtering rules (Golub, et al., 1999; Knudsen, 2002). However, the majority of classical statistical tests have been designed for situations where the num ber of observations exceeds the num ber of factors that may influence the result.
Although increasingly sophisticated parametric techniques are being developed, many share the common assumption that the data (comprising the repeated measurement of the same gene across many chips) are drawn from a normal (Gaussian) distribution. As the researcher is unable to determine the answer to this question with the data from a typical microarray experiment, a logical approach is to consider the application of non- param etric testing.