DigitalCommons@UNMC
DigitalCommons@UNMC
Journal Articles: Genetics, Cell Biology &
Anatomy Genetics, Cell Biology & Anatomy
5-26-2009
Microarray-based cancer prediction using soft computing
Microarray-based cancer prediction using soft computing
approach.
approach.
Xiaosheng Wang
University of Nebraska Medical Center, [email protected]
Osamu Gotoh
Kyoto University
Follow this and additional works at: https://digitalcommons.unmc.edu/com_gcba_articles
Part of the Medical Anatomy Commons, Medical Cell Biology Commons, and the Medical Genetics Commons
Recommended Citation Recommended Citation
Wang, Xiaosheng and Gotoh, Osamu, "Microarray-based cancer prediction using soft computing approach." (2009). Journal Articles: Genetics, Cell Biology & Anatomy. 10.
https://digitalcommons.unmc.edu/com_gcba_articles/10
This Article is brought to you for free and open access by the Genetics, Cell Biology & Anatomy at
DigitalCommons@UNMC. It has been accepted for inclusion in Journal Articles: Genetics, Cell Biology & Anatomy by an authorized administrator of DigitalCommons@UNMC. For more information, please contact
Correspondence: Xiaosheng Wang, Department of Intelligence Science and Technology, Graduate School of Informatics, Kyoto University, Kyoto 606-8501, Japan. Email: [email protected]
Copyright in this article, its metadata, and any supplementary data is held by its author or authors. It is published under the Creative Commons Attribution By licence. For further information go to: http://creativecommons.org/licenses/by/3.0/.
Microarray-Based Cancer Prediction Using Soft
Computing Approach
Xiaosheng Wang1 and Osamu Gotoh1,2
1Department of Intelligence Science and Technology, Graduate School of Informatics, Kyoto University,
Kyoto 606–8501, Japan. 2National Institute of Advanced Industrial Science and Technology,
Computational Biology Research Center, Tokyo 135-0064, Japan.
Abstract: One of the difÞ culties in using gene expression proÞ les to predict cancer is how to effectively select a few informative genes to construct accurate prediction models from thousands or ten thousands of genes. We screen highly discriminative genes and gene pairs to create simple prediction models involved in single genes or gene pairs on the basis of soft computing approach and rough set theory. Accurate cancerous prediction is obtained when we apply the simple prediction models for four cancerous gene expression datasets: CNS tumor, colon tumor, lung cancer and DLBCL. Some genes closely correlated with the pathogenesis of speciÞ c or general cancers are identiÞ ed. In contrast with other models, our models are simple, effective and robust. Meanwhile, our models are interpretable for they are based on decision rules. Our results demonstrate that very simple models may perform well on cancerous molecular prediction and important gene markers of cancer can be detected if the gene selection approach is chosen reasonably.
Keywords: gene expression proÞ les, cancer prediction, soft computing, rough set theory, feature selection, decision rules
Introduction
Conventional tumor diagnostic methods based on the morphological appearance of tumors are not always effective as misdiagnoses often occur. On the other hand, a wide variety of studies have revealed cancer to be a disease involving dynamic changes in the genome. Therefore, using molecular markers of cancers might be an alternative approach to the diagnosis of tumors. The rapid advances in gene expression microarray technology that enable simultaneously measuring the expression levels for tens of thousands of genes in a single experiment, make the detection of cancerous molecular markers possible.1 Since the pioneering work of Golub et al in applying gene expression monitoring by DNA
microarray to cancer classiÞ cation,2 many investigations of using microarray technology to build cancer diagnosis, prognosis or prediction classiÞ ers have been conducted. In general, the major difÞ culty in this topic is how to effectively identify the genes pertaining to the pathogenesis of speciÞ c cancers from the extremely high-dimensionality gene expression data, which often contain a large amount of noise caused by irrelevant genes. On the other hand, compared with the measured quantities of gene expression levels in experiments, the numbers of samples are severely limited. That often inß uences prediction accuracy. In this extreme of very few observations on very many features, it is natural and perhaps essential to investigate feature selection and regularization methods.3 Feature selection, i.e. gene Þ ltering,
is particularly crucial for microarray-based cancer prediction since the number of irrelevant genes for prediction may be huge, and as long as feature selection is performed reasonably, accurate prediction is achieved with even the simplest of predictive models.4
Various methods of building cancer predictors have been proposed such as Clustering, SVMs (Support Vector Machines), k-NNs (k-Nearest Neighbours), ANNs (ArtiÞ cial Neural Networks), GAs (Genetic Algorithms), Naive Bayes (NB), DTs (Decision Trees), RSs (Rough Sets), EPs (Emerging Patterns), et al. In this article, we explore the use of rule-based pipelines to construct cancer predictors as the rule-based methods are more likely to be accepted by biologists and clinicians for they are easily under-stood. This kind of approaches like DTs,5 RSs,6 EPs7 etc. have been commonly utilized to produce cancer predictors by many investigators.7–14 In addition, we attempt to employ one or two genes to
Our method is based on rough set theory, originally proposed by Pawlak in the early 1980s,6 which can be applied for analysis of both precise and imprecise data.17 In,8–11 rough set theory is applied for cancer classiÞ cation and prediction. A majority of these studies conduct feature selection by the attribute reduction approach, one core idea of rough set theory. However, to our knowledge, rough sets attribute reductions are computationally expensive, and the resultant reducts maybe are not unique. Moreover, the reducts cannot ensure high prediction performance because there maybe exists redundancy between the attributes in one reduct.18 To avoid expensive cost in computing attribute reductions, we select the features (genes) with perfect attribute depended degree, a concept from rough set theory, and then create rule classiÞ ers by the chosen genes instead of running attribute reductions. As it is very difÞ cult to Þ nd the single genes or gene pairs with perfect attribute depended degree in terms of the canonical deÞ nition, we extend the concept of attribute depended degree to the more ß exible soft computing framework. Using the extended deÞ ni-tion of attribute depended degree, we can detect some single genes or gene pairs with indeed strong class discriminatory power while they will be ignored if the conventional attribute depended degree standard is employed. Consequently, although the rules derived from the detected genes or gene pairs might not be absolutely true, they are comparatively reliable and able to perform effective prediction.
We apply our algorithm to the four noted gene expression datasets: central nervous system (CNS) tumor, colon tumor, lung cancer, and diffuse large B-cell lymphoma (DLBCL). They are available from the Kent Ridge Bio-medical Data Set Repository (http://datam.i2r.a-star.edu. sg/datasets/krbd/). We validate the efÞ cacy of our method by leave-one-out cross-validation (LOOCV), and compare our results with other already published research outcomes. Furthermore, we examine and analyze the biological relevance of the selected genes.
Results
CNS tumor dataset
In the dataset, we Þ rst try to Þ nd the single genes with high class discriminative power. When α is
set to 0.9 or 0.85, there is no gene with α depended
degree equal to 1 occurring in all the 60 training sets; when α is set to 0.8, gene U28963_at occurs
in 59 out of the 60 training sets; when α is set to
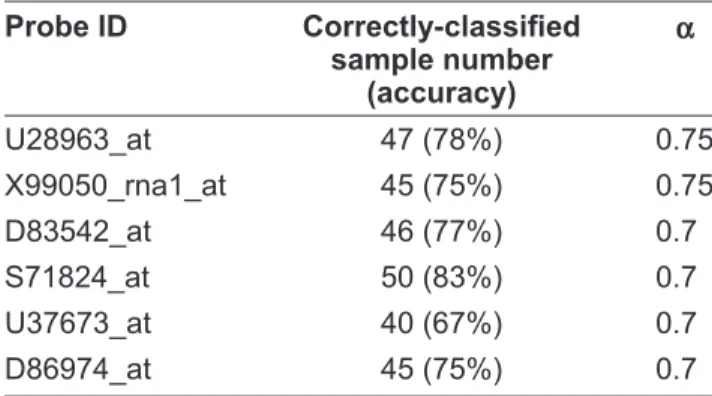
0.75 and 0.7, there are two and six genes occurring in all the 60 training sets, respectively. In every training set, each of the six genes results to two decision rules, which are used to predict the test sample. The Þ nal prediction estimate is the average of 60 test results. Table 1 shows the prediction results by the six genes. Subsequently, we attempt to seek for the gene pairs with strong class dis-criminative ability. When α is set to 0.9, no gene
pair is detected; when α is set to 0.85, only one
gene pair is detected; when α is reduced to 0.8,
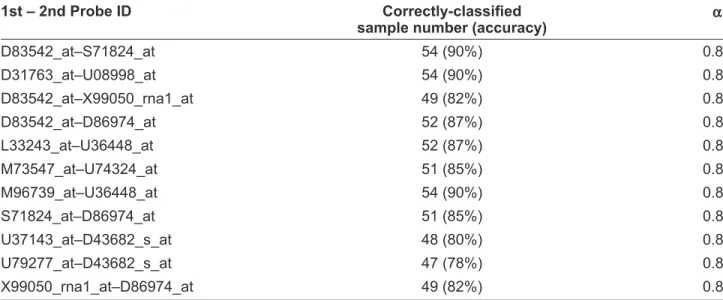
eleven gene pairs are found. In general, each gene pair produces four decision rules. Then we apply the four decision rules to classify the test sample and the average of 60 test results is the prediction estimate of the gene pair. Table 2 shows the predic-tion results by the eleven gene pairs.
Here we denote the expression level of gene G
by g(G). When the Þ rst sample is left out as the test set, and the remaining samples set is trained by the learning algorithm, the selected gene U28963_at will give rise to two decision rules:
• If g(U28963_at) #431, then Class 1;
• If g(U28963_at) .431, then Class 0.
The two rules have 81% and 84% conÞ dence, respectively. One can use the two rules to classify the test set. When another sample instead of the
Þ rst one is left out, gene U28963_at will result to two similar decision rules:
• If g(U28963_at) # x, then Class 1;
• If g(U28963_at) .x, then Class 0.
x equals to 431 or is close to it. Anyway, the rules imply that if gene U28963_at is up-regulated in Table 1. 6 genes with high prediction accuracy in the CNS tumor dataset. Probe ID Correctly-classiÞ ed sample number (accuracy) α U28963_at 47 (78%) 0.75 X99050_rna1_at 45 (75%) 0.75 D83542_at 46 (77%) 0.7 S71824_at 50 (83%) 0.7 U37673_at 40 (67%) 0.7 D86974_at 45 (75%) 0.7
one CNS tumor patient, the patient will be more inclined to succumb to the disease. The other chosen genes give rise to similar form of rules.
Likewise, when the first sample is left out for test while the remaining samples are retained for training, the selected gene pair D83542_ at—S71824_at will generate four decision rules:
• if g(D83542_at) # 280.5 and g(S71824_at) # 434, then Class 1;
• if g(D83542_at) # 280.5 and g(S71824_at) . 434, then Class 1;
• if g(D83542_at) . 280.5 and g(S71824_at) # 434, then Class 1;
• if g(D83542_at) . 280.5 and g(S71824_at) . 434, then Class 0.
The four rules possess 100%, 100%, 89% and 88% conÞ dence, respectively. They can be
simpli-Þ ed into equivalent three rules:
• if g(D83542_at) #280.5 , then Class 1;
• if g(S71824_at) #434, then Class 1;
• if g(D83542_at) . 280.5 and g(S71824_at) . 434, then Class 0.
The three rules have 100%, 92% and 88%
con-Þ dence, respectively. One can employ the four or alternative three rules to classify the test set. When another sample instead of the Þ rst one is left out, gene pair D83542_at—S71824_at will generate four similar decision rules. These rules indicate that if both D83542_at and S71824_at are highly expressed in one CNS tumor patient, then the patient will be very likely to succumb to the disease.
Similar rules can be derived by the other chosen gene pairs.
Colon tumor dataset
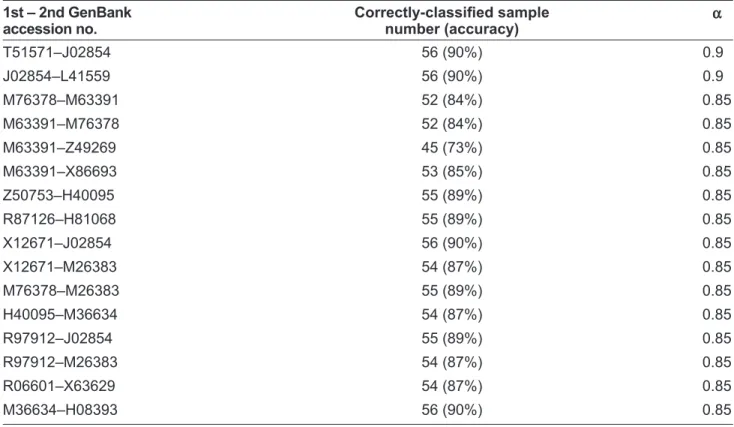
Using the same learning algorithm for the dataset, we screen the genes and gene pairs with compara-tively high prediction performance. The results are presented in Table 3 and Table 4. As before, deci-sion rules can be induced by the selected genes or gene pairs.
Lung cancer dataset
In the dataset, when α is set to 0.8, no any gene is
detected; when α equals to 0.75, eight genes are
detected; when α is reduced to 0.7, no more genes
are found. To make the decision rules induced by gene more reliable, we exclude the genes with missing values. When α is set to 0.9, 0.85 or 0.8,
no any gene pair is found; when α is reduced to
0.75, eight gene pairs are detected. The results are presented in Table 5 and Table 6.
DLBCL dataset
In the dataset, when α is set to 0.7, there are four
genes selected; when α increases to 0.75, no any
gene is found. With respect to gene pairs, when α
is set to 0.9 or 0.85, no any gene pair is found; when α decreases to 0.8, there are 22 gene pairs
chosen. The results are presented in Table 7 and Table 8. Table 8 shows only 20 out of the 22 gene pairs. The other two gene pairs are omitted because of their overly low prediction accuracy.
Table 2. 11 gene pairs with high prediction accuracy in the CNS tumor dataset.
1st – 2nd Probe ID Correctly-classiÞ ed
sample number (accuracy)
α D83542_at–S71824_at 54 (90%) 0.85 D31763_at–U08998_at 54 (90%) 0.8 D83542_at–X99050_rna1_at 49 (82%) 0.8 D83542_at–D86974_at 52 (87%) 0.8 L33243_at–U36448_at 52 (87%) 0.8 M73547_at–U74324_at 51 (85%) 0.8 M96739_at–U36448_at 54 (90%) 0.8 S71824_at–D86974_at 51 (85%) 0.8 U37143_at–D43682_s_at 48 (80%) 0.8 U79277_at–D43682_s_at 47 (78%) 0.8 X99050_rna1_at–D86974_at 49 (82%) 0.8
Comparison of Prediction
Performance
CNS tumor dataset
The dataset is dataset C mentioned in19 that is used to analyze the outcome of the treatment for central nervous system embryonal tumor patients. In this dataset, we gain the 83% and 90% best prediction accuracy using one and two genes respectively. In,19 Pomeroy et al use a k-NNs algorithm to con-struct outcome predictor based on gene expression. The reported statistically signiÞ cant gene size for k-NN models ranges from 2 to 21 genes, with the best prediction made by an 8-gene model that made 13/60 classiÞ cation errors. Several other prediction algorithms including weighted voting, SVMs, and IBM SPLASH are also tested in.19 In,20 Zhang et al propose a hybrid approach, which combines discernibility matrix, the Þ lter strategy and the wrapper method to select gene sets. Then they
adopt the classifiers C4.5 and NaiveBayes to evaluate the prediction performance of the gene sets. Their prediction accuracy by LOOCV is 75% for C4.5 using 20 genes and 86.67% for Naive-Bayes using 29 genes. In,12 Tan et al use decision trees (Single C4.5, Bagging C4.5, AdaBoost C4.5) to perform prediction tasks on cancerous microar-ray data including the CNS tumor dataset. They
Þ rst employ Fayyad and Irani’s21 discretization method to screen 74 genes for the actual learning process. Their highest prediction accuracy is 88% by tenfold cross-validation. The comparison of our methods with the others is summarized in Table 9. The table shows that our results are better than almost all the other compared results from previous studies.
Colon tumor dataset
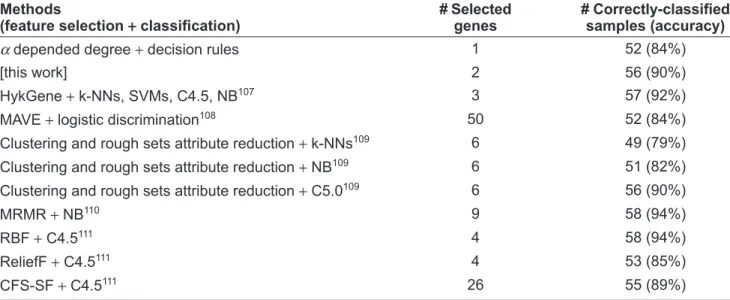
The dataset is Þ rst studied by Alon et al.22 They propose two-way clustering approach that classify genes into functional groups and classify tissues based on their gene expression similarity. Since their original work, the dataset has been frequently investigated by other investigators. In this dataset, we reach the 84% and 90% highest prediction accuracy using one and two genes respectively. Table 10 compares the prediction results of our work with some other studies. The table demonstrates that whereas we use the least genes, our prediction accuracy is superior to or matches the others.
Lung cancer dataset
In this dataset, we obtain the 85% and 82% highest prediction accuracy using one and two genes respectively. With respect to this dataset, we only
Þ nd that Zhang et al report their study results20 apart from the original paper.23 Table 11 presents the comparison between our method and that provided in.20 Although their best prediction accuracy by the HFW feature selection approach is a little higher than ours, the numbers of the genes used by them far exceed ours. As for the other feature selection approaches including FCBF, CFS-SF and ReliefF, the prediction performance caused by them is inferior to ours.
DLBCL dataset
In this dataset, we achieve the 78% and 90% best prediction accuracy using one and two genes respectively. Table 12 gives the comparison Table 3. 21 genes with high prediction accuracy in the
colon tumor dataset.
GenBank accession no. Correctly-classiÞ ed sample number (accuracy) α M63391 52 (84%) 0.8 M76378 50 (81%) 0.8 J02854 50 (81%) 0.8 M26383 52 (84%) 0.8 M76378 50 (81%) 0.75 T60155 48 (77%) 0.75 M22382 50 (81%) 0.75 X12671 49 (79%) 0.75 M76378 50 (81%) 0.75 T96873 47 (76%) 0.75 X86693 47 (76%) 0.75 J05032 50 (81%) 0.75 U25138 48 (77%) 0.75 T60778 47 (76%) 0.75 M91463 48 (77%) 0.75 R87126 51 (82%) 0.7 T51571 46 (74%) 0.7 T92451 48 (77%) 0.7 U09564 48 (77%) 0.7 R97912 45 (73%) 0.7 L41559 45 (73%) 0.7
between our method and that provided in20 and24 Obviously, our results dominate the others.
Analysis of Biological Relevance
CNS tumor dataset
In this dataset, we identify six genes with comparatively high prediction performance individually. The six genes are U28963_at, X99050_rna1_at, D83542_at, S71824_at, U37673_ at, and D86974_at. According to the decision rules
induced by the genes, we suspect that they are all over-expressed in the patients who succumb to their disease. As expected, three out of the six genes are picked as the markers of survival by Pomeroy et al.19 The three genes are referred to as GPS2 (U28963_at), beta-NAP (U37673_at) and KIAA0220 gene (D86974_at) respectively. More-over, beta-NAP and KIAA0220 gene are the members of the 8-gene model by which k-NN makes optimal prediction. In addition, three genes named Human polyposis locus (DP1 gene), NSCL1 and VLCAD which compose the gene pairs with strong prediction power are also identified as markers of survival by Pomeroy et al.19
GPS2 encodes a protein involved in G protein-mitogen-activated protein kinase (MAPK) signal-ing cascades. The function of this gene may be signal repression. Zhang et al indicate that GPS2 interacts with another protein RFX4_v3 to modulate transactivation of genes involved in brain morphogenesis.25 Therefore, the dysregulation of GPS2 may be closely correlated with the pathogenesis of CNS tumor. Beta-NAP, a cerebellar degeneration antigen, is a neuron-speciÞ c vesicle coat protein.26 NSCL1 is the gene expressed predominantly in the developing nervous system.27 Our rules indicate that if the gene is over-expressed, Table 4. 16 gene pairs with high prediction accuracy in the colon tumor-dataset.
1st – 2nd GenBank accession no. Correctly-classiÞ ed sample number (accuracy) α T51571–J02854 56 (90%) 0.9 J02854–L41559 56 (90%) 0.9 M76378–M63391 52 (84%) 0.85 M63391–M76378 52 (84%) 0.85 M63391–Z49269 45 (73%) 0.85 M63391–X86693 53 (85%) 0.85 Z50753–H40095 55 (89%) 0.85 R87126–H81068 55 (89%) 0.85 X12671–J02854 56 (90%) 0.85 X12671–M26383 54 (87%) 0.85 M76378–M26383 55 (89%) 0.85 H40095–M36634 54 (87%) 0.85 R97912–J02854 55 (89%) 0.85 R97912–M26383 54 (87%) 0.85 R06601–X63629 54 (87%) 0.85 M36634–H08393 56 (90%) 0.85
Table 5. 8 genes with high prediction accuracy in the lung cancer dataset.
Unigene ID Correctly-classiÞ ed sample number (accuracy) α 505266a 32 (82%) 0.75 Hs.95243 32 (82%) 0.75 Hs.25882 32 (82%) 0.75 Hs.275198 32 (82%) 0.75 36491a 32 (82%) 0.75 Hs.170225 33 (85%) 0.75 Hs.17258 29 (74%) 0.75 Hs.11556 31 (79%) 0.75
the patients will be more likely to succumb to the CNS tumor. It coincides with the observation reported in.27
Colon tumor dataset
In this dataset, we identify 21 genes which can result to relatively efÞ cient prediction individually. Some of these genes have been proved to tightly link with the pathogenesis of colon tumor or other tumors. Desmin is identiÞ ed as one of three known hub cancer genes in colon cancer-speciÞ c gene network.28 Our rules indicate that the gene is down-regulated in colon tumor samples. The same conclusion is provided in.29 The gene CRP encodes a member of the cysteine-rich protein (CSRP) family. This gene family includes a group of LIM domain proteins, which may be involved in regulatory processes important for development and cellular differentiation. The LIM/double
zinc-Þ nger motif found in this gene product occurs in proteins with critical functions in gene regulation, cell growth, and somatic differentiation. This gene has been reported to be associated with several cancers.30–32 MONAP belongs to angiogenesis-related genes. Its overexpression is associated with
the pathogenesis and progression of a variety of cancers.33–37 Our rules imply that gene MONAP is up-regulated in colon tumor samples. It is consistent with the established notion. Moreover, just as Desmin, MONAP is also identiÞ ed as one of three known hub cancer genes in colon cancer-speciÞ c gene network.28 hnRNP belongs to the
subfamily of ubiquitously expressed heteroge-neous nuclear ribonucleoproteins which are asso-ciated with pre-mRNAs in the nucleus and appear to influence pre-mRNA processing and other aspects of mRNA metabolism and transport. Thus its dysregulation may cause the occurrence of cancers. Hevin encodes the protein which is implicated in tumor cell growth, differentiation and metastasis, and may play the role of tumor-suppressor.38–44 Our rules show that if Hevin is
down-regulated in the colon tissue samples, then the samples are more likely from the colon tumor patients. It rightly defends the argument that Hevin is the repressor of tumors. EF1R is associated with several functions including translation elongation, actin Þ lament depolymerization, apoptosis, and ubiquitin-mediated protein degradation, etc. Its role in oncogenesis has been investigated by some researchers.45–49 Calgizzarin encodes the protein which belongs to the group of S100 proteins involved in the Ca2+ signaling network, and regulates intracellular activities such as cell growth and motility, cell cycle progression, transcription, and cell differentiation50,51 Chromosomal
rear-rangements and altered expression of this gene have been implicated in tumor metastasis. In,52
calgizzarin is characterized as a proteomic marker of colorectal cancer due to its significant up-regulation in colorectal carcinoma. The same observation is provided in.53–55 Tanaka et al detect
Table 6. 8 gene pairs with high prediction accuracy in the lung cancer dataset.
1st – 2nd Unigene ID Correctly-classiÞ ed sample
number (accuracy) α Hs.169611–Hs.285701 31 (79%) 0.75 Hs.285701–Hs.132415 29 (74%) 0.75 Hs.285701–Hs.57655 30 (77%) 0.75 Hs.57655–Hs.8595 31 (79%) 0.75 Hs.184542–Hs.58323 31 (79%) 0.75 Hs.262823–Hs.8595 31 (79%) 0.75 Hs.262480–Hs.772 32 (82%) 0.75 Hs.112193–505266a 31 (79%) 0.75
Table 7. 4 genes with high prediction accuracy in the DLBCL dataset. Probe ID Correctly-classiÞ ed sample number (accuracy) α U70663_at 44 (76%) 0.7 M17863_s_at 44 (76%) 0.7 U48865_s_at 43 (74%) 0.7 U90543_at 45 (78%) 0.7
that the expression of human calgizzarin is remarkably elevated in colorectal cancers compared with that in normal colorectal mucosa by a large scale random cDNA sequencing and Northern blot analysis.56 Our rules express the same tendency that calgizzarin is over-expressed in colon tumors. Likewise, our rules demonstrate that TPM1 is down-regulated in colon tumor that coincides with the Þ nding reported in.57 Our rules exhibit that PCBD1 is up-regulated in colon tumor, but very few literatures reports the same result. Addition-ally, there are several genes tightly associated with colon tumor among the marked gene pairs. In our rules, if MIF (macrophage migration inhibitory factor) is up-regulated, then the sample tends to come from tumor tissue. A number of investiga-tions have demonstrated that MIF promotes colon tumor and the other cancers.58–63 Thus, our rules conform to the documented evidence. CDH3 has been found to be involved in a broad spectrum of cancers including colorectal cancer.64–71 The gene is identiÞ ed as accurate prognostic indicator of several tumors due to its marked up-regulation in
these tumors.66,68,71,72 Our rules show that it is over-expressed in colon tumor as well.
In summary, the majority of important genes relevant to the pathogenesis of colon tumor are marked by our method. The other identified up-regulated genes include Hsp60, Human serine kinase mRNA, IPL1, HYPOTHETICAL PROTEIN IN TRPE 3’REGION and COL11A2 while down-regulated genes encompass MYL9, ACTIN, MaxiK, MGP, GLUT4, MYOSIN HEAVY CHAIN and HCC-1. Some of them have deÞ nite biological meaning while the others remain to be explored. Here what we want to emphasize is that the genes distinguishing tumor from normal tissues well involve not only muscle-speciÞ c ones but also non-muscle-speciÞ c portion. This is in agreement with the Þ nding reported in.22 It also reß ects the complexity of cancerous pathogenesis.
Lung cancer dataset
In this dataset, we identify eight genes with comparatively strong prediction power individually. Table 8. 20 gene pairs with high prediction accuracy in the DLBCL dataset.
1st – 2nd Probe ID Correctly-classiÞ ed sample
number (accuracy) α AFFX-BioC-3_at–M95925_at 46 (79%) 0.8 AFFX-BioC-3_at–U70663_at 48 (83%) 0.8 AFFX-M27830_5_at – X70811_at 49 (84%) 0.8 AFFX-M27830_5_at – U46744_at 49 (84%) 0.8 AC002450_at–M95925_at 47 (81%) 0.8 AC002450_at–U48213_at 47 (81%) 0.8 AC002450_at–HG4020-HT4290_s_at 48 (83%) 0.8 M95925_at–X70811_at 46 (79%) 0.8 U23028_at–U70663_at 47 (81%) 0.8 U23028_at–X70811_at 48 (83%) 0.8 U51903_at–U70663_at 48 (83%) 0.8 U51903_at–X70811_at 47 (81%) 0.8 U66702_at–U70663_at 47 (81%) 0.8 U66702_at–HG4020-HT4290_s_at 48 (83%) 0.8 U66702_at–U90543_at 52 (90%) 0.8 U70663_at–U83908_at 47 (81%) 0.8 U70663_at–X83412_at 46 (79%) 0.8 U70663_at–X77777_s_at 47 (81%) 0.8 U70663_at–X16660_cds1_s_at 46 (79%) 0.8 U70663_at–U46744_at 47 (81%) 0.8
Our rules reveal that the reduced expression of each gene is correlated with the poor prognosis of the cancer. Owing to Þ ve out of the eight genes have no annotation available in raw dataset, we only learn about the other three genes: TCEAL1, GEMIN5 and TMPO. TCEAL1, also named as p21, which belongs to the Cip/Kip family of cyclin
dependent kinases, has been identiÞ ed as a gene whose product is tightly associated with develop-ment and metastasis of several cancers.73–77 Direct and indirect evidence has proved that a decrease in the expression levels of the gene might enhance tumor formation, progression and bad prognosis. GEMIN5 encodes the protein which is part of a Table 9. Comparison of best prediction accuracy for the CNS tumor dataset.
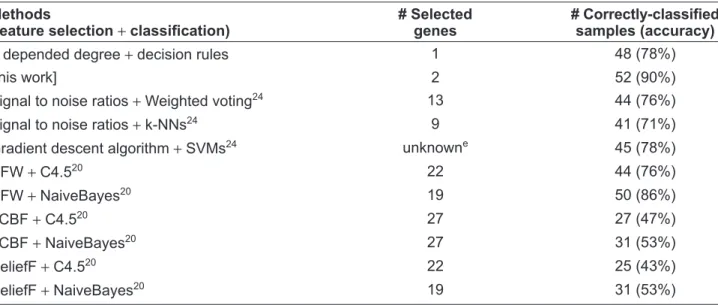
Methods
(feature selection + classiÞ cation)b
# Selected genes
# Correctly-classiÞ ed samples (accuracy) α depended degree + decision rules 1 50 (83%)
[this work] 2 54 (90%)
Signal to noise ratios + k-NNs19 8 47 (78%)
Signal to noise ratios + Weighted voting19 1–200 46 (77%)
Signal to noise ratios + SVMs19 150 45 (75%)
Signal to noise ratios + SPLASH19 1–200 45 (75%)
Signal to noise ratios + TrkC19 1 40 (67%)
Signal to noise ratios + Staging19 1–200 41 (68%)
Signal to noise ratios + staging, k-NNs and TrkC19 1–200 48 (80%)
Signal to noise ratios + SVM, k-NNs and TrkC19 1–200 48 (80%)
HFW + C4.520 20 45 (75%) HFW + NaiveBayes20 29 52 (86.67%) Discretization + Single C4.512 74c 51 (85%)d Discretization + Bagging C4.512 74c 53 (88%)d Discretization + AdaBoost C4.512 74c 53 (88%)d
bThe methods include two sections: feature selection methods and classi
Þ cation methods. The decision trees classiÞ cation methods are also involved in feature selection.
c74 is the number of the genes withheld for the actual learning process instead of the number of the genes contained in the decision trees,
which is not provided in.12
dTenfold cross-validation accuracy is provided.
Table 10. Comparison of best prediction accuracy for the colon tumor dataset.
Methods
(feature selection + classiÞ cation)
# Selected genes
# Correctly-classiÞ ed samples (accuracy) α depended degree + decision rules 1 52 (84%)
[this work] 2 56 (90%)
HykGene + k-NNs, SVMs, C4.5, NB107 3 57 (92%)
MAVE + logistic discrimination108 50 52 (84%)
Clustering and rough sets attribute reduction + k-NNs109 6 49 (79%) Clustering and rough sets attribute reduction + NB109 6 51 (82%)
Clustering and rough sets attribute reduction + C5.0109 6 56 (90%)
MRMR + NB110 9 58 (94%)
RBF + C4.5111 4 58 (94%)
ReliefF + C4.5111 4 53 (85%)
large macromolecular complex localized to both the cytoplasm and the nucleus that plays a role in the cytoplasmic assembly of small nuclear ribonucleoproteins (snRNPs). In,78 Lee et al suggest that Gemin5 overexpression inhibts tumor cell motility so as to may play a role of suppressing metastatic progression. This conforms to our rules. We have not found any evidence indicating that the expression levels of TMPO were correlated with prognosis of cancers. But there are investigations showing that the gene is deregulated in various human tumors.79,80
In addition, we marked eight gene pairs with good prediction performance. Apart from the
non-annotated genes, the involved genes encompass SMAC, PFDN2, FLJ10829, LOC51646, FLJ10326, FLJ12438, GYS10.145 and MSH5. Our rules imply that the decreased expression of these genes indicate a poor prognosis of NSCLC patients- relapse or metastasis. SMAC encodes an inhibitor of apoptosis protein (IAP)-binding protein. A wide variety of investigations have revealed the low expression levels of SMAC correlate with a worse prognosis in many tumor types including NSCLC.81–92 At the same time, some researchers propose the idea of treating cancers by enhancing SMAC expression in tumor cells.83,85–87,89 MSH5 encodes a member of the Table 11. Comparison of best prediction accuracy for the lung cancer dataset.
Methods
(feature selection + classiÞ cation)
# Selected genes
# Correctly-classiÞ ed samples (accuracy) α depended degree + decision rules 1 33 (85%)
[this work] 2 32 (82%) HFW + C4.520 12 35 (90%) HFW + NaiveBayes20 18 35 (90%) FCBF + C4.520 12 31 (79%) FCBF + NaiveBayes20 12 24 (62%) CFS-SF + C4.520 13 26 (67%) CFS-SF + NaiveBayes20 13 24 (62%) ReliefF + C4.520 12 24 (62%) ReliefF + NaiveBayes20 18 25 (64%)
Table 12. Comparison of best prediction accuracy for the DLBCL dataset.
Methods
(feature selection + classiÞ cation)
# Selected genes
# Correctly-classiÞ ed samples (accuracy) α depended degree + decision rules 1 48 (78%)
[this work] 2 52 (90%)
Signal to noise ratios + Weighted voting24 13 44 (76%)
Signal to noise ratios + k-NNs24 9 41 (71%)
Gradient descent algorithm + SVMs24 unknowne 45 (78%)
HFW + C4.520 22 44 (76%) HFW + NaiveBayes20 19 50 (86%) FCBF + C4.520 27 27 (47%) FCBF + NaiveBayes20 27 31 (53%) ReliefF + C4.520 22 25 (43%) ReliefF + NaiveBayes20 19 31 (53%)
mutS family of proteins that are involved in DNA mismatch repair or meiotic recombination (MMR) processes. It is a strong candidate for lung cancer susceptibility as deÞ ciency of MMR has been documented to have a role in lung cancer.93 Hence, it is quite possible that the downregulation of the gene results to unfavorable clinical outcome of tumors.
DLBCL dataset
In this dataset, we marked four genes with relatively excellent prediction ability individually. The four genes are EZF, IGF2, CEBPE and BTF1. Our rules indicate that elevated expression of EZF, CEBPE or BTF1 may cause a worse prognosis of DLBCL while abundant expression of IGF2 implies a better prognosis. In,93 IGF2 is also identiÞ ed as a positive indicator of DLBCL prognosis. Whereas previ-ous investigation indicates that these genes are involved in cancerous pathogenesis, further biological insights remain to be clariÞ ed.
Some genes lying in the gene pairs we selected in the dataset maybe have important biological relevance. DBP is responsible for high, tissue-speciÞ c expression of albumin in fully differenti-ated hepatocytes, which is expressed by adult not fetal liver cells, and is quickly down-regulated in proliferating hepatocytes.94 Our rules indicate that if the gene is down-regulated in one DLBCL patient, then the patient is inclined to have a favor-able prognosis. That sounds reasonfavor-able. TGM2 encodes the protein which is the enzyme that cata-lyzes the crosslinking of proteins and appears to be involved in apoptosis. Oudejans et al point out that differences in apoptosis resistance occurring between DLBCL samples link up with distinct clinical outcome.95 Since the abundant expression of TGM2 activates the induction of the apoptosis, the upregulation of the gene might mean an excellent prognosis. Our rules reß ect the tendency. In addition, in,96 Mishra et al suggest that TGM2 modiÞ cation of p53 oncoprotein could be an addi-tional mechanism whereby TGM2 could facilitate apoptosis. In,97 Mangala et al hold that TGM2-induced alterations in the extracellular matrix could effectively inhibit the process of metastasis. In,98 Xu et al argue that TGM2 acts as an inhibitor of tumor progression in combination with another gene. PDCD4 encodes a protein localized to the nucleus in proliferating cells which is thought to play a role in apoptosis but the speciÞ c role has not
yet been determined. Our rules imply that decreased expression of the gene is associated with a good prognosis. It appears to contradict with some pre-vious reports,99–103 whereas Lankat-Buttgereit et al point out that the function of Pdcd4 might be cell type speciÞ c and a role for Pdcd4 in apoptosis or as a tumor suppressor might be limited to certain cell types.104 The other identified genes like HRES-1, DTNA,VIPR1, BTF1, HAB1, PTPRN2, EIF2B, IQGAP2 etc., overall possess strong class discriminative power, while their biological mechanism indicating the clinical outcome of DLBCL or other tumors remain unclear.
Conclusion
Using gene expression patterns to conduct classiÞ cation or prediction of cancer is often faced with the dilemma: genes (features) far outnumber samples (instances), which will bring about weak prediction efÞ ciency or effect if the model is not chosen reasonably. Another concern is the inter-pretability of the prediction model when biologists and clinician care for your investigation. Here we employ feature selection to overcome the Þ rst
dif-Þ culty and decision rules to handle the second trouble. We propose one way of feature selection on the basis of the depended degree, a concept from rough set theory. As the canonical deÞ nition of the depended degree is too stringent to perform feature selection well, we extend its deÞ nition under soft computing consideration. We deÞ ne the concept of α depended degree, whereby we are capable of
screening highly discriminative features. Addition-ally, our work is in accordance with the principle of Occam’s razor: when deciding among many models which make equivalent predictions, choose the simplest one. For this purpose, we only use single genes or gene pairs to build decision rules, which are used to execute prediction of cancer. Results demonstrate that our models work well in that the picked single genes and gene pairs overall give rise to excellent prediction, and meanwhile some biologically signiÞ cant genes are identiÞ ed. In general, our method is simpler and more inter-pretable than most of previously proposed approaches, since our model is based on rules and our rules are created via very few genes. Moreover, our model is robust as we are able to tune our parameters to meet different datasets. Indeed, through comparison, we discover our method out-performs or at least match other algorithms in
simplicity and efÞ cacy. It is not strange at all that one or two-gene models are able to result in accurate cancerous prediction because the single genes or gene pairs possibly are the biological or clinical indicators of some speciÞ c cancer or gen-eral cancer. It appears that one or two gene predic-tion models are overly simple in that the routine belief is that cancerous pathogenesis is involved in complex systems composed of multi-genes. Whereas our models do not violate the habitual notion in that we have various genes or gene pairs which can cause accurate prediction individually so as to be regarded as candidate markers of cancer. In contrast, some prediction models are not appli-cable for they contain too many parameters (genes) so that overÞ tting happens easily. Similar idea is expressed in4,7,13,15,105 as well. Another advantage of our models is that signiÞ cant biomarkers can be identiÞ ed with ease thanks to the operation of few genes once while it is hard to assess which gene is more important by multi-gene models for they run on the basis of a group of genes.
We test our method on several gene expression datasets including CNS tumor, colon tumor, lung cancer and DLBCL. In each dataset, we identify several important genes with documented bio-logical relevance to the malignancy or the cell type. In the CNS tumor dataset, some signiÞ cant genes like GPS2, beta-NAP, KIAA0220 gene, NSCL1 etc., are identiÞ ed. In the colon tumor dataset, we succeed in choosing the genes highly related to colon tumor or other tumors. They include Desmin, CRP, MONAP, hnRNP, Hevin, EF1R, calgizzarin, TPM1, PCBD1, MIF etc., wherein calgizzarin has been emphasized as a proteomic marker of colorectal cancer.52 In the lung dataset, TCEAL1, GEMIN5, TMPO, SMAC, MSH5 etc. genes asso-ciated with the pathogenesis and progression of a variety of cancers are marked by us. In the DLBCL dataset, IGF2, DBP, TGM2, PDCD4 etc., are iden-tiÞ ed. Their close relationship with tumor occur-rence, progression, metastasis and relapse has been widely explored.
Generally speaking, most of the genes associated with tumors encode the proteins involved in cell growth, motility and differentiation, apoptosis, angiogenesis, metabolism, chromosomal rearrange-ment and translocation, and immune reaction. It is worth noting that whereas there may exist a few particular markers for some speciÞ c tumor, a majority of tumor markers might be shared by several tumors. In addition, it is possible that the repressor
of some tumor acts as the promoter of another tumor. And it is not impossible that the enhancer of some tumor in one stage transforms into the inhib-itor of the same tumor during the other stage.
Another issue concerned with molecular predic-tion of cancer is whether the predicpredic-tion perfor-mance of one gene or gene set is proportional to its biological interest. We identify some genes which own strong prediction power while their biological or clinical involvements remain unobvi-ous. Whether these genes are indeed correlated to the pathogenesis of cancer, or merely coincidence? This is an important problem, deserving further investigation.
In summary, our method uses very few genes to build rule classiÞ ers of cancer. These classiÞ ers can carry out comparatively accurate prediction. The efÞ cacy of our method has been manifested to be satisfactory by testing on four gene expres-sion datasets. Our follow-up study is to examine our method by more microarray data, including multi-class datasets. In addition, we plan to design more powerful and robust rule classiÞ ers in con-junction with other machine learning algorithms.
Methods and Materials
Rough sets
In reality, when we are faced with a heap of data, we often want to learn about them with already known knowledge. However, a majority of data cannot be precisely deÞ ned by known knowledge. Thus, in rough set theory, Pawlak describes ill-deÞ ned data by designing two concepts: upper approximations and lower approximations, based on the equivalence relation, which is also referred to as one knowledge on the studied object set.
DeÞ nition 1 Let U be a universe of discourse,
X ⊆ U, and R is an equivalence relation on U. U/R
represents the set of the equivalence class of U
induced by R. R * X, R* X, br(R, X), pos(R, X) and neg(R, X) represent the lower approximation, upper approximation, boundary region, positive region and
negative region of X on R in U, respectively, where
R X Y U R Y X R X Y U R Y X pos R X R X br R X R * * * { / | }, { / | }, ( , ) , ( , ) = ∈ ⊆ = ∈ ≠ ∅ = = ∪ ∪ ∩ * * * * , ( , ) . X R X neg R X U R X − = −
If R * X = R * X, then X is called deÞ nable or the
precise set on R; otherwise X is called indeÞ nable
or the rough set on R.6
The data studied by rough set theory are mainly organized in the form of decision tables. One deci-sion table can be represented as S=( ,U A=C∪D), where U is the set of samples, C the condition attribute set and D the decision attribute set. In the decision table, we deÞ ne the function Ia that maps a member (sample) of U to the value of the mem-ber on the attribute a (a ∈ A), and an equivalence
relation R(A’) induced by the attribute subset
A’ ⊆ A as: for x, y ∈ U, xR(A’) y if and only if
Ia(x) = Ia(y) for each a ∈ A’.
In,17 Pawlak deÞ nes a decision logic language (DLL) for decision table S =( ,U A=C∪D) as: each (a, v) is an atomic formula, where a∈ A and
v∈ Va (set of all the values of a); if ϕ and ψ are
formulas, then so are ¬ϕ, ϕ∧ψ, ϕ∨ψ, ϕ→ψ, and
ϕ↔ψ. The semantics of DLL are deÞ ned through the model of decision tables. The satisÞ ability of a formula ϕ by an object x in S, denoted by xşSϕ
or for short xşϕ if S is understood, is deÞ ned by the following conditions:
(1) xş (a, v) if and only if Ia(x) = v, (2) xş¬ϕ if and only if not xşϕ,
(3) xşϕ∧ψ if and only if xşϕ and xşψ, (4) xşϕ∨ψ if and only if xşϕ or xşψ, (5) xşϕ→ψ if and only if xş¬ϕ∨ψ,
(6) xşϕ↔ψ if and only if xşϕ → ψ and xşψ→ϕ. We call the set mS(ϕ) = {x ∈ U | xşSϕ} the
meaning of formula ϕ in decision table S. mS(ϕ) is simply written as m(ϕ) if S is understood. On the other hand, we call ϕ a description of object set m(ϕ). Obviously, the following properties hold: (a) m((a, v)) = {x∈ U | Ia(x) = v}, (b) m(¬ϕ) = ∼m(ϕ), (c) m(ϕ∧ψ) = m(ϕ) ∩ m(ψ), (d) m(ϕ∨ψ) = m(ϕ) ∪ m(ψ), (e) m(ϕ→ψ) = ∼m(ϕ) ∪ m(ψ), (f) m(ϕ↔ψ) = (m(ϕ) ∩ m(ψ)) ∪ (∼m(ϕ) ∩ ∼m(ψ)). In rough set theory, the depended degree of an attribute subset P by an attribute subset Q is denoted by γ p(Q) and is deÞ ned as
γP Q Q U P ( ) =|POS ( )| | | , where |POS ( )| = | ( , ) | / ( ) P Q pos P X X∈U R Q ∪ represents the
size of the union of the positive region of each equivalence class in U/R(Q) on P in U, and U
represents the size of U (set of samples).
If Q is the decision attribute D, and P a subset of condition attributes, then γ p(D) indicates the depended degree of the condition attribute subset
P by the decision attribute D. It means that, to what degree, P can discriminate the distinct classes of D. Thus, γ p(D) rightly reß ects the classiÞ cation power of the subset P of condition attributes. The greater
γ p(D) is, the stronger classification ability
P inclines to possess.
Rough set theory tries to discover the simplest
decision rules with the equivalent explaining power and classiÞ cation performance as more complicated rules. One decision rule with the form of “A⇒ B” indicates that “if A, then B”, where A
is the description of condition attributes and B the description of decision attributes. The conÞ dence
of a decision rule A ⇒ B is deÞ ned as:
confidence support support ( ) ( ) ( ) , A B A B A ⇒ = ∧
where support (A) denotes the proportion of the samples satisfying A and support (A∧B) the pro-portion of the samples satisfying A and B simulta-neously. According to the DLL, the conÞ dence of a decision rule A⇒B is rewritten as:
confidence ( ) ( ) ( )
( ) .
A B m A m B
m A
⇒ = ∩
The conÞ dence of a decision rule implies the reliable degree of the rule. If one decision rule has 100% conÞ dence, we call it the consistent decision rule.
In the previous studies of classifying cancer by gene expression proÞ les using rough set theory, the measure of depended degree is often set as the basis of ranking genes.9,10 However, as the canonical deÞ nition of depended degree is overly stringent, sometimes it is not able to rightly express the discriminatory power of features. Hence, here we extend the deÞ nition of depended degree under soft computing consideration.
DeÞ nition 2 Let U be a universe of discourse,
X ⊆ U, 0 # α # 1 and R is an equivalence relation
on U. pos(R, X, α) representing the α positive
region of X on R in U, is deÞ ned as:
Correspondingly, the α depended degree of an
attribute subset P by an attribute subset Q, denoted by γ p(Q, α), is deÞ ned as: γP Q Q U ( , ) =|POS ( , )| | | α α P where |POS ( , )| = | ( , , | / ( ) P Q pos P X X U R Q α α ∈ ∪ ) represents the
size of the union of the α positive region of each
equivalence class in U/R (Q) on P in U.
Obviously, the deÞ nition of α depended degree
is a generalization of the deÞ nition of depended degree as when α equals to 1, both deÞ nitions are
equivalent. We choose α depended degree instead
of depended degree as the basis of screening features. Once α value is determined, we only
choose the genes or gene pairs with 1 of γ p(D, α)
value to build classiÞ cation (decision) rules. Sup-pose g is one of the selected genes and U sample set. U/R(g) = {c1(g), c2(g), …, cn(g)} represents the set of the equivalence class of samples induced by R(g). Two samples s1 and s2 belong to the same equivalence class of U/R(g) if and only if they have the same value on g. In addition, we represent the set of the equivalence class of samples induced by
R(D) as U/R(D) = {d1(D), d2(D), …, dm(D)}, where
D is the class (decision) attribute. Two samples s1
and s2 belong to the same equivalence class of U/ R(D) if and only if they have the same value on D. For each ci(g) (i= 1, 2, …, n), if there exists some
dj(D) ( j ∈ {1, 2,…, m}), satisfying |ci(g) ∩ d j(D)|/
|ci(g)| $α, then we generate the classiÞ cation rule:
A(ci(g)) ⇒ B(dj(D)), where A(ci(g)) is the formula describing the sample set ci(g) by g value and
B(dj(D)) is the formula describing the sample set
dj(D) by the class value. In the case of gene pairs, we construct classiÞ cation rules through the same strategy. Here what we want to emphasize is that only the single genes or gene pairs chosen by all
the leave-one-out training sets are used for building classiÞ cation rules.
The conÞ dences of the rules generated by our approach depend on α. The following theorem
states the relationship between α and the conÞ
-dences of the induced rules.
Theorem 1 The conÞ dence of each induced decision rule by our way is no less than α.
Proof. For any condition attribute subset P of size one or two, if γ p(D, α) = 1, then P will be chosen by
our way. Suppose the decision rule A ⇒B is produced by P. Then by our way, we have m(A) ∈ U/R(P),
m(B) ∈ U/R(D) and |m(A) ∩ m(B)|/|m(A)| $α. As
confidence (A⇒B)= m A( )∩m B( ) / m A( ) , the conclusion is founded.
Therefore, by tuning α value, we can not only
control the size of the set of selected single genes or gene pairs, but also ensure the conÞ dence of derived decision rules.
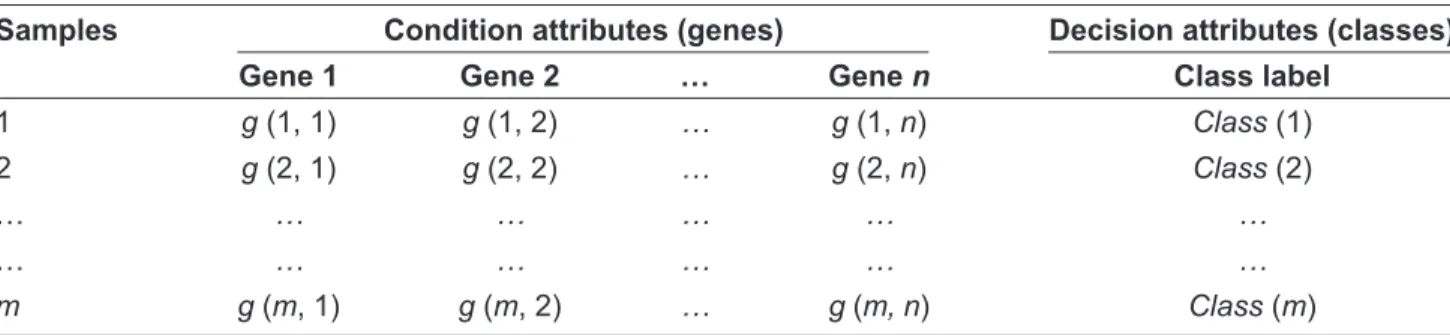
For the cancer classiÞ cation problem, every microarray data collected can be represented as a decision table with the form of Table 13. In the microarray data decision table, there are m samples and n genes. Every sample is assigned to one class label. g(x, y) represents the expression level of gene
y in sample x.
Dataset
CNS tumor dataset
The dataset is about patient outcome prediction for central nervous system embryonal tumor.19 In this dataset, there are 60 observations, each of which is described by the gene expression levels of 7129 genes and a class attribute with two distinct labels—Class 1 (survivors) versus Class 0 (failures). Survivors are patients who are alive after treatment while the failures are those who succumbed to their disease. Among 60 patient samples, 21 are labeled as “Class 1” and 39 are labeled as “Class 0”.
Table 13. Microarray data decision table.
Samples Condition attributes (genes) Decision attributes (classes)
Gene 1 Gene 2 … Gene n Class label
1 g (1, 1) g (1, 2) … g (1, n) Class (1) 2 g (2, 1) g (2, 2) … g (2, n) Class (2)
… … … … … …
… … … … … …
Colon tumor dataset
The dataset contains 62 samples collected from colon-cancer patients.22 Among them, 40 tumor biopsies are from tumors (labeled as “negative”) and 22 normal (labeled as “positive”) biop-sies are from healthy parts of the colons of the same patients. Each sample is described by 2000 genes.
Lung cancer dataset
The dataset contains 39 NSCLC (Non-Small Cell Lung Cancer) samples, 24 of which are from patients with metastasis (labeled as “relapse”) and 15 are from the patients with disease-free based on both clinical and radiological testing (labeled as “non-relapse”).23 The total number of genes is 2880.
DLBCL dataset
The dataset is about patient outcome prediction for DLBCL.24 The total of 58 DLBCL samples are from 32 cured patients (labeled as ‘cured’) and 26 refractory patients (labeled as ‘fatal’). The gene expression proÞ le contains 6817 genes.
Table 14 summarizes the four gene expression datasets.
Data preprocessing
As there exist a few missing attribute values in the lung cancer dataset, we Þ rst Þ ll each of them with the mean of all the attribute values from the same class of samples as the sample containing the miss-ing value.
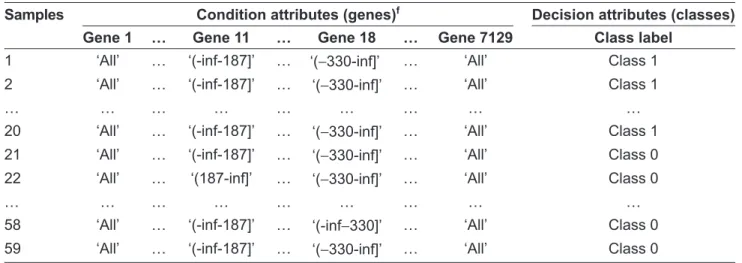
Because rough set theory is suitable for handling discrete attributes, we discretize all the training set decision tables. We utilize the entropy-based discretization method, proposed by Fayyad et al.21 This algorithm recursively applies an entropy minimization heuristic to discretize the continuous-valued attributes. The stop of the recursive step for this algorithm depends on the minimum description length (MDL) principle. We implement the discretization in the Weka package.106 Every continuous-valued attribute is discretized into a one-category, two-category or three-two-category attribute. Table 15 shows the discretized decision table for the CNS tumor with the Þ rst sample left out. We execute Table 14. Summary of the four gene expression datasets.
Dataset # Original genes Class # Samples
CNS Tumor 7129 Class 1/Class 0 60 (21/39)
Colon Tumor 2000 negative/positive 62 (40/22)
Lung Cancer 2880 relapse/non-relapse 39 (24/15)
DLBCL 6817 cured/fatal 58 (32/26)
Table 15. Discretized CNS tumor decision table with the Þ rst sample left out.
Samples Condition attributes (genes)f Decision attributes (classes)
Gene 1 … Gene 11 … Gene 18 … Gene 7129 Class label
1 ‘All’ … ‘(-inf-187]’ … ‘(−330-inf]’ … ‘All’ Class 1 2 ‘All’ … ‘(-inf-187]’ … ‘(−330-inf]’ … ‘All’ Class 1
… … … …
20 ‘All’ … ‘(-inf-187]’ … ‘(−330-inf]’ … ‘All’ Class 1 21 ‘All’ … ‘(-inf-187]’ … ‘(−330-inf]’ … ‘All’ Class 0 22 ‘All’ … ‘(187-inf]’ … ‘(−330-inf]’ … ‘All’ Class 0
… … … …
58 ‘All’ … ‘(-inf-187]’ … ‘(-inf−330]’ … ‘All’ Class 0 59 ‘All’ … ‘(-inf-187]’ … ‘(−330-inf]’ … ‘All’ Class 0 f‘All’ represents that one gene has the same value in all samples; ‘(-inf-x]’ represents ‘
our algorithm for the feature selection and decision rule induction using this kind of tables.
Validation
We employ leave-one-out cross-validation approach. For the dataset containing n samples, each sample is left out in turn, and the learning algorithm is trained on all the remaining n-1 samples. Then the training result is tested on the left-out sample. The
Þ nal estimate is the average of n test results.
Acknowledgements
This work was partly supported by KAKENHI (Grant-in-Aid for ScientiÞ c Research) on Priority Areas “comparative genomics” from the Ministry of Education, Culture, Sports, Science and Tech-nology of Japan.
Disclosure
The authors report no conß icts of interest.
References
1. Schena M, Shalon D, Davis RW, Brown PO. Quantitative monitoring of gene expression patterns with a complementary DNA microarray. Science. 1995;270(5235):467–70.
2. Golub TR, Slonim DK, Tamayo P, et al. Molecular classiÞ cation of cancer: class discovery and class prediction by gene expression moni-toring. Science 1999;286(5439):531–7.
3. Xing EP, Jordan MI, Karp RM. Feature selection for high-dimensional genomic microarray data. In: the Eighteenth International Conference on Machine Learning: 2001; Williams College, MA: Morgan Kaufmann Publishers Inc., San Francisco, U.S.A. 2001:601–8.
4. Simon R. Supervised analysis when the number of candidate feature (p) greatly exceeds the number of cases (n). ACM SIGKDD Explorations Newsletter. 2003;5(2):31–6.
5. Quinlan J: Induction of decision trees. Machine Learning. 1986;1:81–106. 6. Pawlak Z. Rough sets. International Journal of Computer and
Information Sciences. 1982;11:341–56.
7. Li J, Wong L. Identifying good diagnostic gene groups from gene expression proÞ les using the concept of emerging patterns. Bioinformatics. 2002;18(5):725–34.
8. Sun L, Miao D, Zhang H. EfÞ cient gene selection with rough sets from gene expression data. In: the 3rd International Conference on Rough Sets and Knowledge Technology: 2008:164–71.
9. Li D, Zhang W. Gene selection using rough set theory. In: the 1st International Conference on Rough Sets and Knowledge Technology: 2006:778–85.
10. Momin BF, Mitra S. Reduct generation and classiÞ cation of gene expression data. In: First International Conference on Hybrid Informa-tion Technology. 2006:699–708.
11. Banerjee M, Mitra S, Banka H. Evolutinary-rough feature selection in gene expression data. IEEE Transaction on Systems, Man, and Cyber-netics, Part C: Application and Reviews. 2007(37):622–32.
12. Tan AC, Gilbert D. Ensemble machine learning on gene expression data for cancer classiÞ cation. Appl Bioinformatics. 2003;2(3 Suppl):S75–83. 13. Li J, Liu H, Downing JR, Yeoh AE, Wong L. Simple rules underlying
gene expression proÞ les of more than six subtypes of acute lympho-blastic leukemia (ALL) patients. Bioinformatics. 2003;19(1):71–8.
14. Cong G, Tan KL, KH Tung A, Xu X. Mining top-k covering rule groups for gene expression data. In: the ACM SIGMOD International Conference on Management of Data: 2005:670–81.
15. Geman D, d’Avignon C, Naiman DQ, Winslow RL. Classifying gene expression proÞ les from pairwise mRNA comparisons. Stat Appl Genet Mol Biol. 2004;3:Article 19.
16. Gordon GJ, Jensen RV, Hsiao LL, et al. Translation of microarray data into clinically relevant cancer diagnostic tests using gene expression ratios in lung cancer and mesothelioma. Cancer Res. 2002;62(17):4963–7. 17. Pawlak Z. Rough sets-Theoretical aspects of reasoning about data,
vol. 9. Dordrecht; Boston: Kluwer Academic Publishers; 1991. 18. Yu L, Liu H. Redundancy based feature selection for microarray data.
In: the Tenth ACM SIGKDD Conference on Knowledge Discovery and Data Mining: 2004:737–42.
19. Pomeroy SL, Tamayo P, Gaasenbeek M, et al. Prediction of central nervous system embryonal tumour outcome based on gene expression. Nature. 2002;415(6870):436–42.
20. Zhang LJ, Li ZJ, Hu XH. A Hybrid Gene Selection Method for Cancer ClassiÞ cation. In: VLDB Workshop on Data Mining in Bioinformatics: 2007; Vienna, Austria; 2007.
21. Fayyad UM, Irani KB. Multi-interval discretization of continuous-valued attributes for classiÞ cation learning. In: the 13th International Joint Conference of ArtiÞ cial Intelligence: 1993:1022–7.
22. Alon U, Barkai N, Notterman DA, et al. Broad patterns of gene expression revealed by clustering analysis of tumor and normal colon tissues probed by oligonucleotide arrays. Proc Natl Acad Sci U S A. 1999;96(12):6745–50.
23. Wigle DA, Jurisica I, Radulovich N, et al. Molecular proÞ ling of non-small cell lung cancer and correlation with disease-free survival. Cancer Res. 2002;62(11):3005–8.
24. Shipp MA, Ross KN, Tamayo P, et al. Diffuse large B-cell lymphoma outcome prediction by gene-expression profiling and supervised machine learning. Nat Med. 2002;8(1):68–74.
25. Zhang D, Harry GJ, Blackshear PJ, Zeldin DC. G-protein pathway suppressor 2 (GPS2) interacts with the regulatory factor X4 variant 3 (RFX4_v3) and functions as a transcriptional co-activator. J Biol Chem. 2008;283(13):8580–90.
26. Newman LS, McKeever MO, Okano HJ, Darnell RB. Beta-NAP, a cerebellar degeneration antigen, is a neuron-speciÞ c vesicle coat protein. Cell. 1995;82(5):773–83.
27. Lipkowitz S, Gobel V, Varterasian ML, Nakahara K, Tchorz K, Kirsch IR. A comparative structural characterization of the human NSCL-1 and NSCL-2 genes. Two basic helix-loop-helix genes expressed in the developing nervous system. J Biol Chem. 1992;267(29):21065–71. 28. Jiang W, Li X, Rao S, et al. Constructing disease-speciÞ c gene networks
using pair-wise relevance metric: application to colon cancer identiÞ es interleukin 8, desmin and enolase 1 as the central elements. BMC Syst Biol. 2008;2:72.
29. Klieveri L, Fehres O, Griffini P, Van Noorden CJ, Frederiks WM. Promotion of colon cancer metastases in rat liver by Þ sh oil diet is not due to reduced stroma formation. Clin Exp Metastasis. 2000;18(5):371–77. 30. Wang Q, Williamson M, Bott S, et al. Hypomethylation of WNT5A,
CRIP1 and S100P in prostate cancer. Oncogene. 2007;26(45): 6560–65.
31. Hirasawa Y, Arai M, Imazeki F, et al. Methylation status of genes upregulated by demethylating agent 5-aza-2’-deoxycytidine in hepatocellular carcinoma. Oncology. 2006;71(1–2):77–85.
32. Sato N, Fukushima N, Matsubayashi H, Goggins M. IdentiÞ cation of maspin and S100P as novel hypomethylation targets in pancreatic cancer using global gene expression profiling. Oncogene. 2004;23(8): 1531–8.
33. Schauer IG, Ressler SJ, Rowley DR. Keratinocyte-derived chemokine induces prostate epithelial hyperplasia and reactive stroma in a novel transgenic mouse model. Prostate. 2009;69(4):373–84.
34. Bendrik C, Dabrosin C. Estradiol increases IL-8 secretion of normal human breast tissue and breast cancer in vivo. J Immunol. 2009; 182(1):371–8.