BUILDING DAMAGE HAZARD ZONATION USING FKCN
AND IDW ALGORITHM
1MUHAMMAD FAISAL, 1EDY IRWANSYAH
1
Dept. of Computer Science, Bina Nusantara University, Jalan KH. Syahdan No. 9 Palmerah Jakarta 11480 Indonesia
E-mail: [email protected], [email protected]
ABSTRACT
The objective of this study is to create building damage hazard zonation area using fuzzy kohonen clustering network (FKCN) for physical parameter data clustering and inverse distance weighting (IDW) for data interpolation in Banda Aceh city, Indonesia. IDW algorithm is used alongside FKCN because of its simplicity. The physical parameter in this study consists of lithology, topographic zone and peak ground acceleration value (PGA). The result is Banda Aceh city divided into 3 zones which are low, medium, and high building damage area, based on the combination of physical parameter on each area.
Keywords: Building Damage, Earthquake, Fuzzy Kohonen Clustering Network, Hazard Zonation, Inverse Distance Weighting
1.
INTRODUCTIONIndonesia is a country with high earthquake intensity. The 1983 Banda earthquake (8.5 Mw), 2004 Sumatera-Andaman Island earthquake (9.1 Mw), 2005 North Sumatera/Nias earthquake (8.6 Mw) and West Coast Sumatera earthquake were 4 big earthquake occurrences in Indonesia [1]. An earthquake with a certain intensity and magnitude as a response to the movements of plates can result in physical infrastructure damage as happened at Banda Aceh in 2004 with total of physical infrastructure damage reached approximately 35% [2] and caused total approximated to the hundred thousand of death in Indonesia, Sri Lanka and Thailand [3].
Escobar et al, 2008 [4] proposed a method using torsion amplification factors, P-TAF to simplify the current static seismic torsion design procedure for buildings. In the previous research, in order to evaluate the building damage due to an earthquake, Silva and Garcia, 2001 [5] combined artificial neural network and fuzzy system, Carreno et al, 2010 [6] implemented neuro-fuzzy system based on a special three-layer feed-forward artificial neural network and fuzzy rule bases and self-organizing Map (SOM) algorithm has been applied by Irwansyah and Hartati, 2012 [7] in evaluating the building damage caused by the earthquake event.
FKCN had been applied to construct the building damage hazard zonation with Kriging algorithm for
the data interpolation [8]. According to Largueche, F.Z.B, 2006 [9] Kriging algorithm is difficult to understand and implement but actually this method is generally better than IDW. The original Kriging method requires the preliminary modeling step of a variance distance relationship, meanwhile IDW does not involve such step, simple and quick [10]
Based on those previous researches, we use FKCN as the clustering data algorithm and IDW algorithm for data interpolation to construct the building damage hazard zonation area in Banda Aceh city Indonesia.
2.
RELATED WORKSFKCN is an unsupervised learning clustering analysis method which integrated Fuzzy C-Means (FCM) model [11] and Kohonen network [12]. This algorithm was introduced by Bezdek et al, 1992 [13] in order to improve convergence rate and reduce labelling errors problem on FCM.
Jabbar et al, 2009 [16] proved FKCN has the ability to segment the color image with HSV as color representation, [17] introduced Adaptive Fuzzy Kohonen Clustering Network that reduce computation process of FKCN in image segmentation and [18] determine cluster membership values in short times by doing some improvements from the original FKCN.
3.
METHODOLOGYManuscripts This study consists of (1) PGA calculation, (2) lithology and topography data extraction (3) clustering data using FKCN and (4) data interpolation using IDW algorithm.
Figure 1: Building Damage Hazard Data Clustering Architectur
3.1 PGA Calculation
PGA value of Banda Aceh city is computed with the following formula [19]:
ln(PGA) = 0.2418 + 1.414M + C1 + C2(10-M)3 + C3 ln(rrup+1.
7818e0.554M
) + 0.0060H + 0.3846Zr
(1)
Where PGA is peak ground acceleration (gals); M is earthquake magnitude (Richter scale); rrup is horizontal distance from earthquake epicentrum to centroid grid; H is depth of the epicenter (Km); Zr indicates rock sites (0 for interface and 1 for intraslab) and C1, C2, C3 are coefficient from the function (C1 = 0, C2 = 0, and C3 = -2.552).
3.2 Data Extraction
The conversion process of lithology data and topographic zoning obtained from map into data as shown in Table 1. The class value is based on each contribution on each level of building damage.
Table 1: Lithology and topography class [7]
No Lithology Topography
Class Value Class Value
1 Sand 6 Inland Plain 7
2 Clayey Sand 5 Inland Deep 6
3 Sandy Clay 4 Coastal Plain 5
4 Sand 3 Coastal Low 4
5 Swamp 2 Coastal Deep 3
6 Non 1 River/Seabed/Lake 2
7 - - No Data 1
3.3 Data Normalization
Min-max normalization [20] transform data into a new minimum and maximum value but preserves the relationships among original data values by computing:
A A
A new ) new
*(new A A
A v
v' max min min
min max
min
+ −
− −
= (2)
Where
A
min = minimum value from attribute A,
A
max = maximum value from attribute A,
A
new
max = maximum value on the new scale, and A
new
min = minimum value on the new scale.
3.4 FKCN Algorithm
The physical parameter is computed by FKCN algorithm for data clustering analysis. The algorithm of FKCN is summarized as follow:
Step 1: Fix c, sample space and threshold error ɛ > 0 some small positive constant.
Step 2: Initializev0=
(
v10,v20,...,vc0)
choose m0 >1 and iteration limit ( tmax)
Step 3: For t = 1,2…,tmax
a. Compute all learning rates:
m t m m
t = 0− *∆ ,
max
1
t
m=
∆ (3)
Where mtis the fuzzy membership for the t
iteration and∆m: fuzzy membership differences for
each iteration
1 1 2 1 , 1 , , − − − − − − =
∑
m t j k t i k t ik V X V Xu (4)
Whereuikt
, is the membership function of the k-th
data of i-th cluster for each t-iteration; Xk is the k-th data; i,t−1
V is the i-th cluster center for t-1
iteration; Vj,t−1is the j-th cluster center for t-1
iteration and mis weighting exponent on each
fuzzy membership.
Compute learning rate
(
)
μτικ,τ
ικ,τ υ
α = (5)
Where ikt
,
α is the learning rate of the k-th data of
i-th cluster for t iteration.
b. Update all weight vectors:
(
)
∑
∑
= − − − − + = n j t ij n k t i k t ik t i t i v x v v 1 , 1 1 , , 1 , , α α (6)Whereviis i-th cluster center and t i v
, is i-th cluster
center for t iteration
c. Compute the function
1 −
−
= t t
t V V
E
(7)
WhereEtis error for each t iteration; Vt is cluster
center for t iteration and Vt−1 and cluster center for
t-1 iteration.
d. If Et<ε stop. Else t = t + 1 goto step 3
3.5 IDW Algorithm
Inverse distance weighting [21] is one of the simplest spatial prediction techniques by computing the formula bellow:
∑
∑
= − = − − = N i n i N i n i i d d Z Z 1 1 0 (8)Where is estimation value of variable z in point I, is sample value in point I, di is distance of
sample point to estimated point, N is coefficient that determines weigh based on a distance and n is total number of predictions for each validation case.
4.
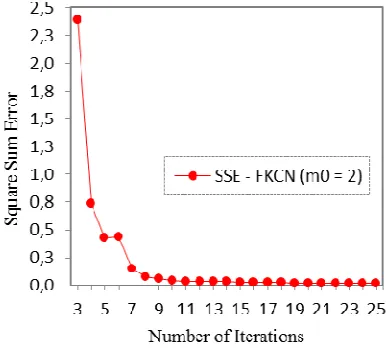
RESULTBuilding damage hazard data clustering in this study is conducted using FKCN with m = 2, ε = 0.001, tmax = 50 and c = 3 by 10
th
[image:3.595.310.503.377.551.2]iteration. Figure 2 shows FKCN had achieved small number of error by 10 or more iteration and is similar to the experiment by Bezdek et al (1992).
Figure 2: FKCN Square Sum Error Plot
Table 2: Data Characteristics on each class of clustering result
Class
Data Characteristic
PGA Range Dominant Lithology
Dominant Topography
Class
1 0,8767 – 0,8806
Sand Clay, Clay and Clayey Sand Inland Plain, Coastal Plain and Inland Deep Class
2 0,8773 – 0,8797
Sand, Clayey Sand and Swamp River, Coastal Deep and Coastal Plain Class
3 0,8775 – 0,8796 Swamp
Banda Aceh city is divided into 3 classes as described in Table 2 Class 3 (green) as seen in Figure 3 represents low building damage area, which constructed by swamp for lithology class and dominated by river/seabed/lake and coastal deep for topography zone with 0.8775-0.8796 gals PGA range value.
Figure 3: Building Damage Hazard Zonation in Banda Aceh
Class 2 (yellow) is medium building damage area and class 1 (red) is high building damage area which constructed by the same method.
[image:4.595.86.291.204.473.2]Using same data and location with different methodology, [8] conducted clustering data and zonation building damage hazard area caused by earthquake. Zoning resulting from these studies showed that the pattern is almost different where coastal area relatively consist of high building damage and medium damage hazard zone (north west) and low building damage hazard zone which is located relatively further away towards the inland (Figure 4).
5.
CONCLUSIONFKCN algorithm which is implemented in this study had performed well in data clustering analysis, based on the small number of error since the 10th iteration. According to the zonation result
Banda Aceh city, Indonesia located at the low and medium building damage hazard area. The result also indicates high damage zones only cover a small area in the northwest part of the city, near and relatively parallel with coast line. Zoning differences with previous research showing the importance of developed models that can represent nearly ideal conditions
Figure 4: Building Damage Hazard Zonation in Banda Aceh (Red: High Building Damage Hazard Area; Orange: Medium Building Damage Hazard Area; Yellow: Low Building Damage Hazard Area)
(Irwansyah and Hartati, 2014)
REFRENCES:
[1] United States Geological Survey-USGS, http://earthquake.usgs.gov/
[2] Irwansyah, E, “Building Damage Assessment Using Remote Sensing, Aerial Photograph and GIS Data; Case Study in Banda Aceh after Sumatera Earthquake 2004”, Proceeding of the on Intelligent Technology and Its Application (SITIA), Surabaya, October 10, 2010, pp. 33. [3] Halif, M.N.A. and S.N. Sabki, “The Physics of
Tsunami: Basic understanding of the Indian Ocean disaster”, American J. Applied Sci, 2005, Vol. 2, pp. 1188-1193.
[4] Escobar, J.A.S., J.A. Mendoza and M.R. Gómez, “Effect of Earthquakes on Some Kind of Buildings”. American J. Environ. Sci, Vol. 4, pp. 2008, pp. 189-197.
[5] Silva, M. S. and Garcia, L, “Earthquake Damage Assessment Based on Fuzzy Logic and Neural Networks”, Earthquake Spectra, 2001, 17(1) pp. 89-112.
[image:4.595.311.496.235.415.2]Evaluation of Damage in Buildings”, Earthquake Spectra, February, 2010, Vol. 26 (1), pp. 63-86.
[7] Irwansyah, E., and Hartati, S, “Zonation of Earthquake Building Damage Hazard Area Using Kohonen Neural Network (NN) and Kriging Algorithm, Advances in Natural and Applied Sciences 2014, Vol 8 (9), pp 120-124. [8] Irwansyah, E. and Hartati, S, “Data Clustering
and Zonation of Earthquake Building Damage Hazard Area Using FKCN and Kriging Algorithm”, Advanced Computing, Networking and Informatics, Springer, 2014, Vol. 1, pp. 171-178.
[9] Largueche, F.Z.B., “Estimating Soil Contamination with Kriging Interpolation Method”, American J. Applied Sci., 2006, Vol. 3, pp. 1894-1898.
[10] Yasrebi, J., Saffari, M., Fathi, H., Karimian, N., Moazallahi, M., and Gazni, R. 2009. Evaluation and comparison of ordinary kriging and inverse distance weighting methods for prediction of spatial variability of some chemical parameters. Res J Biol Sci, 2009, Vol. 4(1), pp. 93–102. [11] Hathaway, R., and Bezdek, J. C, “Recent
convergence results for the fuzzy c-means clustering algorithms”, Journal of Classification, Springer-Verlag, September 1, 1988, Vol. 5(2), pp. 237-247.
[12] Kohonen, T, “The Self-organization Map”, Proceedings of the IEEE, 1990, pp. 1464-1480. [13] Bezdek, J.C., Tsao, E.C-K., and Pal, N.R,
“Fuzzy Kohonen Clustering Networks”, IEEE International Conference on Fuzzy Systems, San Diego, Maret 8-12, 1992, pp. 1035-1043. [14] de Almeida, C.W.D., Souza, R.M.C.R.,
Candeias, A.L.B, “IFKCN: Applying Fuzzy Kohonen Clustering Network to Interval Data”, IEEE World Congress on Computational Intelligence, Brisbane, June 10-15, 2012, pp. 1-6.
[15] Fan, J., Jia, S., Li, X, “The Application of Fuzzy Kohonen Clustering Network for Intelligent Wheelchair Motion Control”, Proceeding of the IEEE International Conference on Robotics and Biomimetics (ROBIO), Shenzhen, December 12-14, 2013, pp. 1995-2000
[16] Jabbar, N., Ahson, S.I. and Mehrota, M, “Fuzzy Kohonen Clustering Network for Color Segmentation,” International Conference on Machine Learning and Computing (IPCSIT), 2009, Vol. 3, pp. 254-257.
[17] Lei, W. and Feihu, Q, “Adaptive Fuzzy Kohonen Clustering network for Image Segementation”, International Joint Conference on Neural Networks (IJCNN '99), Washington, July 10-16, 1999, Vol.4, pp. 2664-2667. [18] Atmaca, H., Bulut, M. and Demir, D,
“Histogram Based Fuzzy Kohonen Clustering Network For Image Segmentation”, Proceedings of International Conference on Image Processing, Lausanne, September 16-19, 1996, Vol. 2, pp. 951-954.
[19] Youngs, R. R., S.-J. Chiou, W.L. Silva, and J.R. Humphrey. 1997. Strong ground motion attenuation relationship for subduction zone earthquake. Seism. Res. Lett, 1997, pp. 67. [20] Han, J., Kamber, M., and Pei, J, “Data Mining
Concept and Techniques”, 3rd Ed. Morgan Kaufmann-Elsevier, Amsterdam, 2012, pp. 58-73.