Published Online February 2014 (http://www.scirp.org/journal/sn)
http://dx.doi.org/10.4236/sn.2014.32009
Contextualized Analysis of Social Networks:
Collaboration in Scientific Communities
Maria Teresinha Tamanini Andrade1, Patrícia Braga2, Tereza Kelly Gomes Carneiro3,
Núbia Moura Ribeiro1, Marcelo A. Moret2,4, Hernane Borges de Barros Pereira2,5
1
Instituto Federal de Educação Ciência e Tecnologia, Simões Filho, Brazil 2
Programa de Modelagem Computacional, SENAI Cimatec, Salvador, Brazil 3
Universidade Estadual de Ciências da Saúde de Alagoas, Maceió, Brazil 4
Universidade Estadual de Feira de Santana, Feira de Santana, Brazil 5
Universidade do Estado da Bahia, Salvador, Brazil
Email: [email protected], [email protected], [email protected],
[email protected], [email protected], [email protected]
Received November 18, 2013; revised December 20, 2013; accepted January 27, 2014
Copyright © 2014 Maria Teresinha Tamanini Andrade et al. This is an open access article distributed under the Creative Commons Attribution License, which permits unrestricted use, distribution, and reproduction in any medium, provided the original work is properly cited. In accordance of the Creative Commons Attribution License all Copyrights © 2014 are reserved for SCIRP and the owner of the intellectual property Maria Teresinha Tamanini Andrade et al. All Copyright © 2014 are guarded by law and by SCIRP as a guardian.
ABSTRACT
Currently, the collaboration in scientific communities has been studied in order to explain, among other things, the knowledge diffusion. The quality of Graduate Programmes is often associated with the scientific collabora-tion. This paper discusses how scientific collaboration processes can be identified and characterized through so-cial and complex networks. For this purpose, collaboration networks of bibliographic production, research projects, and committees of PhD theses and Masters’ dissertations by researchers from a graduate program in computational modeling were studied. The data were obtained from CAPES’ reports of the period from 2001 to 2009. Among the studied indices, centrality indices indicate the presence of prominent researchers who influence others and promptly interact with other researchers in the network. The indices of complex networks reveal the presence of the small-world (i.e. these networks are favorable to increase coordination between researchers) phenomenon and indicate a behavior of scale-free degree distribution (i.e. some researchers promote clustering more than others) for one of the studied networks.
KEYWORDS
Knowledge Production and Dissemination; Collaboration; Scientific Communities; Network Theory; Social Networks; Complex Networks
1. Introduction
University-based science is enhanced by the reciprocal and dialectical relationship between the production of knowledge and its communicative socialization. Though, based on this premise, collaboration in scientific com-munities is taken as the theme of our research. The main goal of the present paper is to study the collaboration between researchers involved in a graduate program (GP) based on data from 3 sources: 1) their bibliographic out-put (i.e., articles published in journals, studies in pro-ceedings, and books and/or chapters), 2) research projects
and 3) PhD thesis and MS dissertation committees. The word collaboration, which originates from the Latin word collaborare, is defined as “cooperation, help, assistance, participation in someone else’s work [...] idea that contributes to performing some task” [1]. According to Katz and Martin [2], two scientists collaborate when they share data, equipment and/or ideas in a project, which usually results in research experiments and analy-sis published in a journal. In other words, scientific col-laboration is a joint effort of researchers to achieve a common goal of producing new scientific knowledge.
collabo-ration often appears in the literature in terms of coau-thorship. In the present study, collaboration refers not only to coauthorship but also to participation in research projects and in thesis and dissertation committees.
Specifically, we sought to construct and analyze the following three types of coauthorship networks: a biblio-graphic publications network, the network of researchers participating in research projects and the network of re-searchers participating in thesis and dissertation commit-tees.
The studied GP offers masters and doctoral degrees on computational modeling. It is classified as a multidiscip-linary field program by the Brazilian official educational authority CAPES1 (Coordenação de Aperfeiçoamento de Pessoal de Nível Superior—Coordination for the Im-provement of Higher Education Personnel—
http://www.capes.gov.br/). The studied bibliographic pro- duction network contains 795 researchers, 356 research-ers participated in the research project network, and 234 researchers identified during 3 trienniums of evaluation (i.e. 2001-2009) participated in the committee network.
In the network of scientific production, 6.15% are professors (P), 9.03% are students (D), 71.92% are ex-ternal participants (EP) and 12.80% are referred to another participant (O). This nomenclature is in accor-dance with the classification of the CAPES report. In “research projects” network, the participation of profes-sors (P) is 12.33%, students (D) 29.77%, other partici-pants (O) 54.19%, and researcher (FP) 3.52%. And in the “thesis and dissertation” network, the participation of external participants (EP) is 11.82%, other participants (O) 39.32%, professors (P) 20.09%, and students (D) 30.34%.
Within this context, social networks analysis (SNA) and the theory of complex networks were used to identify, characterize and interpret the collaboration networks of university scientific communities. The complex networks properties show a small-world phenomenon and indicate a scale free degree distribution.
The present paper is organized as follows: in Section 2, the theoretical framework of social network analysis and the theory of complex networks; Section 3 presents the fundamentals and methodological procedures are briefly discussed; Section 4 presents a study of collaboration networks; and finally, in Section 5, concluding consider-ations are presented.
2. Analysis of Social and Complex Networks
The study of networks evolved from graph theory, a field of mathematics. A network is a graph formed by a set of elements called vertices or nodes. These vertices are
linked by another set of elements called edges, which establish connections between two vertices.
According to Watts [4], social reality and scientific ac-tivity must be understood based on the way in which people interact and on the way in which people behave. In this case, behaviors that are increasingly governed by multidisciplinary actions are highlighted.
In the present study, three measures of centrality, commonly applied in SNA studies, were used to discuss and characterize collaborative relationships: degree, close- ness and betweenness centralities.
Degree centrality is defined by the number of adja-cent vertices that a vertex has [5-7]. The degree measure of centrality focuses on the importance relevance of an actor in simple connections with neighboring actors, and it is quantified by the degree of the vertex. Thus, a vertex is more important than another in the network if it estab-lishes a greater number of links with neighboring vertic-es.
Closeness centrality is a function of the longer or shorter distance of a vertex from all others in a network [5-7]. The idea is that a central vertex has greater oppor-tunities to promptly interact with all others [5-8] and therefore has shorter distances. The closeness centrality of an actor is based on the proximity or distance. Whe-reas degree centrality is measured for actors adjacent to a given actor, closeness centrality reflects how close an actor is to all others in the network.
Betweenness centrality evaluates the dependence of non-adjacent vertices on others that act as a bridge to allow interaction between them [5-7]. In this case, the greater the degree of centrality, the greater is the poten-tial control of a vertex over others that depend on it to perform the interaction. An intermediate vertex is one that makes a connection between others that do not have direct relationships with each other [5-8].
Complex networks refer to a graph that exhibits a non-trivial topological structure [9]. This structure does not follow a regular pattern, and when the system is very large, network properties can emerge.Figure 1 summa-rizes three topologies of complex networks and the in-dices used to characterize these networks. The consi-dered indices are the mean shortest path L, clustering coefficient C anddegree distribution denoted by P(k).
3. Methodological Procedures
This paper presents an empirical research that uses a quantitative approach. The goal was turning an explora-tory research into descriptive research. The study is con-sidered exploratory because it evaluates collaboration within scientific communities, because it does not em-ploy any existent research method. The descriptive as-pect is related to elucidating the characteristics of a given
1CAPES is an agency of the Ministry of Education which plays a key
73
Figure 1. Summary of three topologies of complex networks and indices used to characterize the networks [10]. On the left is the random network, where C = low, L = low and P(k) = poisson; on the center is the small-world network, where C = high, L = low and P(k) = not significant; and on the right is the scale-free network, where C = not significant, L = not significant and P(k) = power law.
population (e.g., researchers and professors) and estab-lishing the relationships between scientific collaboration and knowledge dissemination networks. Social and com-plex network theory is used for the sake of quantitative data description and analysis.
To perform the proposed research, the CAPES’ reports of scientific production (i.e., journal articles, proceedings, books and book chapters), research projects and PhD thesis and MS dissertation committees were organized based on annual data from GPs that are published by CAPES.
The research locus is the selected GP, and the research subjects are researchers who participated as coauthors in bibliographic production, in research projects and in committees (i.e., professors, students and external par-ticipants) related to this program; the study covered the period of triennial evaluations and the reports available from the Capes Collection. It should be noted that the period selected for the analysis was defined from the beginning of the activities of the Interdisciplinary Com-mittee at CAPES, namely, 2001 to 2009. The GP was chosen considering the following criteria: the GP is an interdisciplinary area, and deals with research related to computational modeling.
The CAPES’ reports were obtained in PDF format. Then, the text mining software PPG.Net [11] was used to convert each notebook into a TXT file. Next, text mining was conducted to extract distinct lists according to the authors, their bibliographic production, projects, thesis and dissertation committees and the production classifi-cation by Qualis2. Networks were generated in Pajek format based on these lists. Finally, after the building of networks, we use some software (e.g. Ucinet and Pajek) to calculate indices of networks and to carry out appro-priate inferences within the context of collaboration in scientific communities.
4. Collaboration Network Study
Bibliographic output comprising 484 journal articles, 561 studies in proceedings and 47 books were analyzed for the period from 2001 to 2009, totaling 1092 publications, according to the coauthorship criterion. In addition, 395 research projects, 46 PhD theses and 51 MS dissertations were analyzed.
The coauthorship network studied is disconnected and consists of a larger component and minor components. Thus, they follow a pattern previously observed in sever-al studies [12-14] on coauthorship networks.
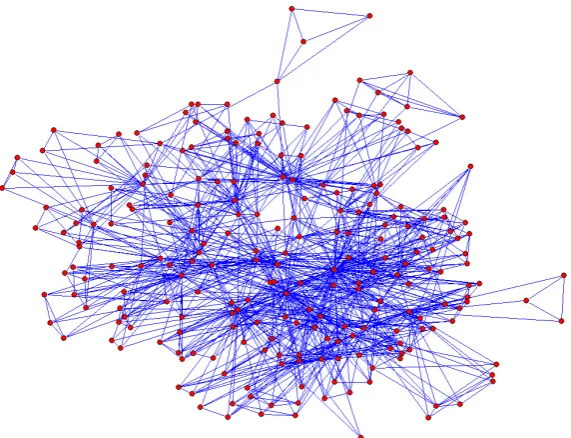
Figures 2, 3 and 4 show the networks of bibliographic production, research projects, and PhD thesis and MS dissertation committees, respectively.
4.1. Identifying the Structural Aspects
In this section, the structural aspects of complex and so-cial networks are discussed with the aid of proper indices. Considering complex networks, these indices are the mean shortest path, mean clustering coefficient and de-gree distribution. These indices are important in deter-mining the type of network [15]. In relation to social networks, the indices are grouped into cohesion indices (e.g., density, distance and transitivity) and centrality indices (i.e., degree, closeness and betweenness centrali-ties). The parameters density and diameter, as indices of network cohesion, are considered in complex and social networks. For a graph, the shortest path is termed a geo-desic, and more than one geodesic may exist between two vertices. The distance between two vertices is given by the geodesic length. The distance between vertices in social networks indicates how close two actors are in the network and is essential in the definition of centrality.
The indices of the theory of complex networks that are used to characterize the coauthorship networks studied are as follows: mean shortest path (L), clustering coeffi-cient (Cws) and degree distribution, P(k). Using these
2Qualis is the set of procedures used by Capes for stratification of the
Figure 2. Bibliographic production network.
Figure 3. The network representing participation in research projects.
75
indices, it is possible to characterize a network as “ran-dom”, “scale-free” or “small-world” (these are the most widespread models). The mean clustering coefficient used is that defined by Watts and Strogatz [15], which describes the extent to which the neighbors of a vertex in a network are neighbors to each other.
A network is classified as small-world if its mean clustering coefficient is much greater than the clustering coefficient of a random network (Cws >> Cr) and if its
mean shortest path is comparable to the mean shortest path of the corresponding random network (L ~ Lr).
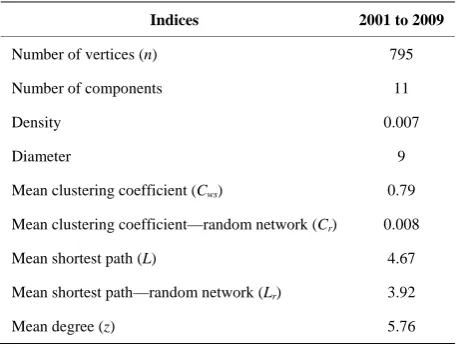
Tables 1,2and 3 show the results of the calculations for the indices of the analysis of complex networks of bibliographic production, research projects and PhD the-sis and MS dissertation committees of the present study.
[image:5.595.308.537.112.287.2]The results indicate that the studied networks are cha-racterized as small-world networks. As the density is an index of network cohesion, we can observe that the den-sity of “research projects” and “thesis and dissertation”
Table 1. Complex network analysis indices for the biblio-graphic production network.
Indices 2001 to 2009
Number of vertices (n) 795
Number of components 11
Density 0.007
Diameter 9
Mean clustering coefficient (Cws) 0.79
Mean clustering coefficient—random network (Cr) 0.008
Mean shortest path (L) 4.67
Mean shortest path—random network (Lr) 3.92
Mean degree (z) 5.76
Table 2. Complex network analysis indices for the research projects network.
Indices 2001 to 2009
Number of vertices (n) 356
Number of components 1
Density 0.13
Diameter 5
Mean clustering coefficient (Cws) 0.90
Mean clustering coefficient—random network (Cr) 0.13
Mean shortest path (L) 2.25
Mean shortest path—random network (Lr) 1.83
Mean degree (z) 48.42
Table 3. Complex network analysis indices for the thesis and dissertation network.
Indices 2003 to 2009
Number of vertices (n) 234
Number of components 1
Density 0.04
Diameter 5
Mean clustering coefficient (Cws) 0.83
Mean clustering coefficient—random network (Cr) 0.041
Mean shortest path (L) 2.70
Mean shortest path—random network (Lr) 2.63
Mean degree (z) 9.37
networks are larger than the scientific production net-work, because those networks are connected and have only one component. This means that the GP integrates into their research projects its researchers. We do not compare the networks mentioned above, because they are different in nature.
4.2. Degree Distribution
Degree distribution is an important characteristic of complex networks that reveals the network topology. A network whose degree distribution is close to a power law is known as a scale-free network.
An important characteristic of networks with scale- free distribution is that they are more robust in relation to the random removal of vertices and less robust in relation to the removal of a specific, high-degree vertex [16]. This property can indicate that the coordinated removal of a high-degree vertex can disconnect the network, in-terrupting knowledge-dissemination processes. For ex-ample, if a researcher who is a hub unexpectedly quits the program (e.g. retirement, dismissal, death, etc.) this situation can lead to the disconnection of the network, and collaboration becomes momentarily impaired.
[image:5.595.58.287.352.526.2]In network dynamics, when the degree distribution behaves according to a power law, this behavior shows that new vertices inserted in the network tend to connect to high-degree vertices. In coauthorship networks, there is a high probability for high-degree researchers to re-ceive new connections, that is, to publish more papers with new researchers.
[image:5.595.59.287.562.735.2]degree) connected to many researchers, and many re-searchers (of low degree) connected to few rere-searchers. Thus, it is assumed that high-degree researchers have a great number of collaborators, work in groups and en-gage in knowledge dissemination easily (at least within the scientific community studied). On the other hand, low-degree researchers are connected to few researchers, can work alone or in small groups, and may disrupt or slow down knowledge dissemination processes. In other words, there is a high probability of diffusion of a re-search topic when the topic is investigated and published by high-degree researchers; consequently the scientific production network becomes larger.
Figure 5 shows evidence that the studied network presents a power law in accordance with the probability
P(k) ∼k−γ; γ ≈ 1.49 with error = 0.086.
In the degree distribution of research projects and PhD thesis and MS dissertation committee networks, we were not able to determine whether these networks presented characteristics of scale-free networks because there is no specific distribution (e.g., binomial or scale-free).
Centrality indices (degree, closeness and betweenness centralities) were studied for social networks.
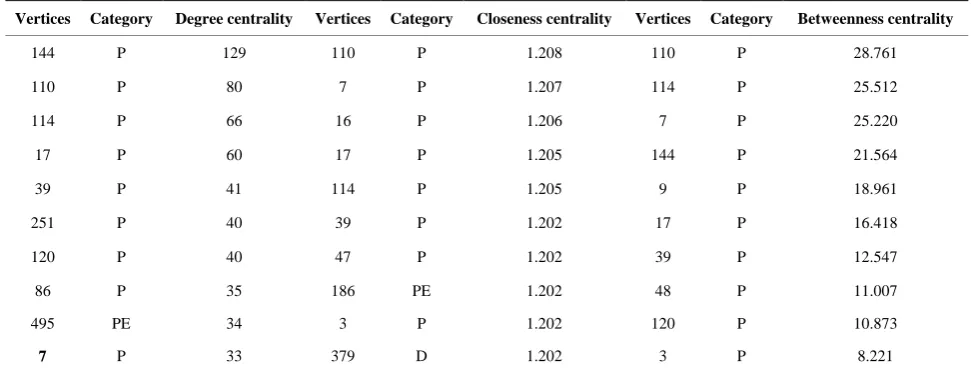
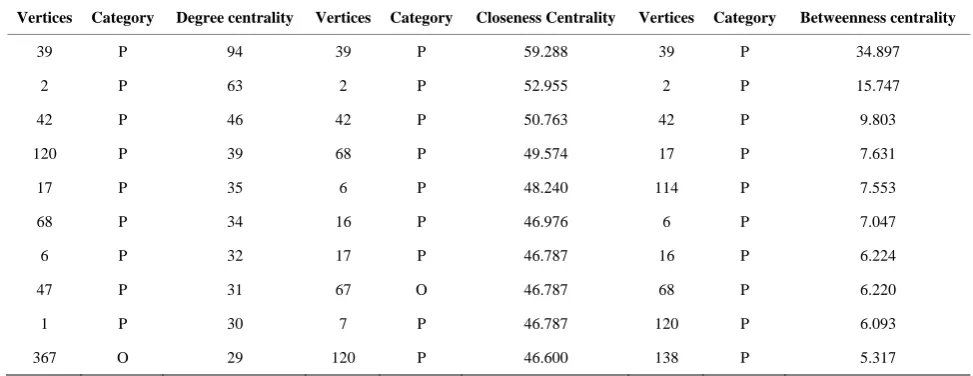
According to Rossoni and Guarido Filho [17], the best positions in the network can also represent greater capac-ity to develop scientific knowledge in the field. Thus, it appeared pertinent to relate the ten (10) researchers in the top positions of centrality for bibliographic production, the research projects, and the PhD thesis and MS disser-tation committees (Tables 4, 5and 6). Indices were cal-culated for the entire network, regardless of whether they were disconnected, and the centrality measures were performed at a local level (i.e., at the actor level).
4.3. Discussion
The results obtained from the indices based on the theory
of complex networks show that the studied networks are topologically characterized as small-world networks; in the case of the publication network, the results also present evidence of scale-free networks (these types of networks are not mutually exclusive).
[image:6.595.54.540.550.736.2]In these networks, it is assumed there is strong coor-dination and strong dialogue between researchers. It is inferred that the members of the research group are effi-cient in accessing and contacting each other.
Table 4 shows that among the researchers with the highest degree, closeness and betweenness centralities, 90%, 80% and 100% are professors, respectively. InTable 5, all researchers with the highest centralities are profes-sors. InTable 6, among the researchers with the highest degree and closeness centralities, 90% are professors, and among the researchers with the highest betweenness centrality, 100% are professors
Some vertices stand out in relation to collaboration over the period analyzed; vertex 144 stands out in bibli-ographic production (1st and 4th positions in degree and
Figure 5. The degree distribution of bibliographic produc-tion γ ≈ 1.49 with error = 0.086.
Table 4. Bibliographic production: degree, closeness and betweenness centrality indices.
Vertices Category Degree centrality Vertices Category Closeness centrality Vertices Category Betweenness centrality
144 P 129 110 P 1.208 110 P 28.761
110 P 80 7 P 1.207 114 P 25.512
114 P 66 16 P 1.206 7 P 25.220
17 P 60 17 P 1.205 144 P 21.564
39 P 41 114 P 1.205 9 P 18.961
251 P 40 39 P 1.202 17 P 16.418
120 P 40 47 P 1.202 39 P 12.547
86 P 35 186 PE 1.202 48 P 11.007
495 PE 34 3 P 1.202 120 P 10.873
77
Table 5. Research projects: degree, closeness and betweenness centrality indices.
Vertices Category Degree centrality Vertices Category Closeness centrality Vertices Category Betweenness centrality
7 P 163 7 P 64.312 144 P 34.897
39 P 159 39 P 63.849 51 P 15.747
864 P 157 864 P 63.620 114 P 9.803
114 P 150 114 P 62.943 39 P 7.631
144 P 149 42 P 62.610 864 P 7.553
884 P 148 884 P 62.610 47 P 7.047
42 P 148 144 P 62.610 7 P 6.224
37 P 148 37 P 62.610 48 P 6.220
3 P 146 3 P 62.390 17 P 6.093
84 P 144 84 P 62.172 110 P 5.317
Table 6. Theses and dissertations: degree, closeness and betweenness centrality indices.
Vertices Category Degree centrality Vertices Category Closeness Centrality Vertices Category Betweenness centrality
39 P 94 39 P 59.288 39 P 34.897
2 P 63 2 P 52.955 2 P 15.747
42 P 46 42 P 50.763 42 P 9.803
120 P 39 68 P 49.574 17 P 7.631
17 P 35 6 P 48.240 114 P 7.553
68 P 34 16 P 46.976 6 P 7.047
6 P 32 17 P 46.787 16 P 6.224
47 P 31 67 O 46.787 68 P 6.220
1 P 30 7 P 46.787 120 P 6.093
367 O 29 120 P 46.600 138 P 5.317
betweenness centralities, respectively) and research projects (5th, 7th and 1st positions in degree, closeness and betweenness centralities, respectively). The same is true of vertex 110, which stands out in bibliographic produc-tion (2nd position in degree and 1st position in closeness and betweenness centralities) and research projects (10th position in betweenness centrality).
Among the vertices that stand out in relation to colla-boration, some appear in all three networks; vertex 114 stands out in bibliographic production (3rd, 5th and 2nd positions in degree, closeness and betweenness centrali-ties, respectively), in research projects (4th and 3rd posi-tions in degree and closeness centralities and between-ness centrality, respectively) and in theses and disserta-tions (5th position in betweenness centrality). The same is true of vertex 7, which stands out in bibliographic pro-duction (10th, 2nd and 3rd positions in degree, closeness and betweenness centralities, respectively), in research
projects (1st position in degree and closeness centralities and 7th in betweenness centrality) and also in theses and dissertations (9th position in closeness centrality).
Vertex 17 also stands out in bibliographic production (4th position in degree and closeness centralities and 6th in betweenness centrality), in research projects (9th position in betweenness centrality) and in theses and dissertations (5th, 7th and 4th positions in degree, closeness and bet-weenness centralities, respectively).
Vertex 39 also stands out in bibliographic production (5th, 6th and 7th positions in degree, closeness and bet-weenness centralities, respectively), in research projects (2nd position in degree and closeness centralities and 4th in betweenness centrality) and in theses and dissertations (1st position in degree, closeness and betweenness cen-tralities).
[image:7.595.53.540.318.506.2]govern-mental agencies and companies; these researchers can form a team of researchers and graduate students, who are to collaborate. Consequently, the number of publica-tions will also be large and contact networks as well. Thus, the scientific exchange and collaboration in re-search can flow faster, bringing new possibilities, new research themes and new networks.
It is assumed that these researchers are important ver-tices in the network due to their collaboration networks and can promptly interact with the others, thereby exert-ing some control in the network. In Tables 4, 5and 6, the top positions are held by the researchers considered most relevant in terms of collaboration; the higher the degree centrality, the more connected the researcher is.
5. Final Considerations
For the GP networks built and analyzed based on data from CAPES’ reports of scientific production (i.e. jour-nal articles, studies in proceedings and books/chapters), research projects, and PhD thesis and MS dissertation committees, the network indices show a small-world phenomenon accordingly Watts-Strogatz model [15]. Furthermore, the bibliographic production network exhi-bits a scale-free degree distribution. From the viewpoint of complex networks, the fact that the network is scale-free makes it robust regarding the random removal of vertices.
In network dynamics, when degree distribution exhi-bits power law behavior, this effect demonstrates that new vertices inserted in the network tend to link to high-degree vertices. In coauthorship networks, there is a high probability for a high-degree researcher to receive new connections, that is, to publish more papers with new researchers.
Centrality indices indicate the presence of prominent researchers in the network who exert control over the others and promptly interact with other researchers. These indices indicate that some researchers have more power in the sense that they can somehow exert some type of control (e.g. if the researcher is a hub in the net-work it can promote the diffusion of specific topics of interest in his research group to the detriment of other subjects) over the information and ideas disseminated among the researchers who are connected through him or her. The best positions in the network can help evaluate the capacity that the researcher has to articulate her/ himself politically and scientifically.
It can also be concluded that more relevant researchers exist who have more interactions. It is assumed that these researchers work with research groups and have a large number of collaborators, thereby maintaining a high level of scientific production over the period analyzed.
Finally, it is important to comment that this work is a ongoing research and initially it was published in the
proceedings of the 1st Brazilian Workshop on Social Network Analysis and Mining [18].
Acknowledgements
This work received financial support from CNPq (the Brazilian federal grant agency).
REFERENCES
[1] A. Beloqui Houaiss, “Dicionário Houaiss da Língua Por- tuguesa,” Houaiss Portuguese Dictionary, 2001.
[2] J. S. Katz and B. R. Martin, “What Is Research Collabo-ration?” Research Policy, Vol. 26, No. 1, 1997, pp. 1-18.
http://dx.doi.org/10.1016/S0048-7333(96)00917-1
[3] S. A. S. Vanz and I. R. C. Stump, “Colaboração Científi- ca: Revisão Teórico Conceitual [Scientific Collaboration: Theoretical and Conceptual],” Perspectives in Informa- tion Science, Vol. 15, No. 2, 2010, pp. 42-55.
[4] D. J. Watts, “Six Degrees: The Science of a Connected Age,” W. W. Norton e Company, New York, 2003. [5] L. C. Freeman, “Centrality in Social Networks: I.
Con-ceptual Clarification,” Social Networks, Vol. 1, No. 3, 1979, pp. 215-239.
http://dx.doi.org/10.1016/0378-8733(78)90021-7
[6] S. Wasserman and K. Faust, “Social Network Analysis: Methods and Applications,” Cambridge University Press, Cambridge, 1997.
[7] J. Scott, “Social Network Analysis,” Sage, Thousand Oaks, 2002.
[8] R. A. Hanneman and M. Riddle, “Introduction to Social Network Methods,” 2005.
http://faculty.ucr.edu/~hanneman/nettext/
[9] A. L. Barabási, “Linked: How Everything Is Connected to Everything Else and What It Means for Business, Science and Everyday Life,” Plume, 2003.
[10] I. S. Fadigas, “Difusão do Conhecimento em Educação Matemática sob a Perspectiva das Redes Sociais e Com-plexas [Knowledge Diffusion in Mathematics Education from the Perspective of Social and Complex Networks],” PhD Thesis on Knowledge Dissemination, UFBA/LNCC/ UNEB/UEFS/IFBA/SENAI-Cimatec, Salvador, 2011. [11] P. F. Braga, H. B. B. Pereira and M. A. Moret, “A Com-
putational Model to Textual Extraction and Construction of Social and Complex Networks,” Proceedings of the CASoN, Salamanca, 19-21 October 2011, pp. 72-75. [12] C. Hayashi, C. Hayashi and M. Lima, “Análise de Redes
de Coautoria na Produção Científica em Educação Espe-cial [Analysis of Coauthorship Networks in Scientific Production in Special Education],” Liinc in Journal, Vol. 4, No. 1, 2008, pp. 84-103.
79
Methods of Social Network Analysis: Assessing the Gra- duate Program in Information Science PPGCI UFMG],”
Encontros Bibli: Revista Eletrônica de Biblioteconomia e Ciência da Informação, Vol. 10, 2006.
[14] M. E. J. Newman, “The Structure of Scientific Collabora- tion Networks,” Proceedings of the National Academy of Sciences of the United States of America, Vol. 98, No. 2, 2001, pp. 404-409.
http://dx.doi.org/10.1073/pnas.98.2.404
[15] D. J. Watts and S. H. Strogatz, “Collective Dynamics of Small-World Networks,” Nature, Vol. 393, No. 6684, 1998, pp. 440-442. http://dx.doi.org/10.1038/30918
[16] M. E. J. Newman, A. L. Barabási and D. J. Watts, “The Structure and Dynamics of Networks,” Princeton Univer-
sity Press, Princeton, 2006.
[17] L. Rossoni and E. R. Guarido Filho, “Cooperação Inter- institucional no Campo da Pesquisa em Estratégia [In- terinstitutional Cooperation in the Field of Strategy Re- search],” RAE, Vol. 47, No. 4, 2007, pp. 74-88.
[18] M. T. T.Andrade, P. F. Braga, T. K. G. Carneiro, N. M. Ribeiro, M. A. Moret and H. B. B. Pereira, “Análise Con- textualizada de Redes Sociais: A Colaboração em Com- unidades Científicas [Contextualized Analysis of Social Networks: Collaboration in Scientific Communities],”
![Figure 1. Summary of three topologies of complex networks and indices used to characterize the networks [10]](https://thumb-us.123doks.com/thumbv2/123dok_us/8001129.761645/3.595.103.500.84.211/figure-summary-topologies-complex-networks-indices-characterize-networks.webp)