Comparison of Bit Error Rate Performance of different
Modulation Techniques over Turbulent FSO Link
Harjeevan Singh
Assistant Professor, Department of ECE, Chandigarh University
Gharuan, Punjab (India)
Mohit Arora
Assistant Professor, Department of ECE, Chandigarh University
Gharuan, Punjab (India)
ABSTRACT
Free space optical (FSO) communication link is a line of sight (LOS) wireless link between the nodes separated by an unguided medium such that visible and infrared bands of the spectrum are used as data carrier. Recent past has witnessed huge revival of research interest in this field so as to make FSO commercially viable and looking into this prospective, data modulation techniques are one of the primary ways to enhance link sustainability. In this paper, comparison of modulation techniques like M-ary QAM, BPSK and DPSK has been studied by creating turbulent atmospheric conditions using gamma-gamma turbulence model. During this link analysis, BPSK performed far better in comparison to DPSK and M-ary QAM in terms of BER for similar SNR values and interestingly, higher the order of M-QAM and higher the link range, greater was the degradation of link performance observed.
General Terms
Free Space Optics, Modulation Techniques, Bit Error Rate.
Keywords
FSO, BER, M-QAM, BPSK, DPSK, Gamma Gamma model,Link Range.
1.
INTRODUCTION
A Free Space Optical Communication refers to line of sight communication link between the communicating nodes separated by atmosphere as unguided medium between them. A main requirement for FSO link is line-of-sight condition between the two networking locations. The data to be transmitted can be modulated using intensity, phase or frequency characteristics of the optical carrier beam which lies in the infrared (IR) and visible part of spectrum which corresponds to the wavelengths between 850nm and 1550 nm[1].
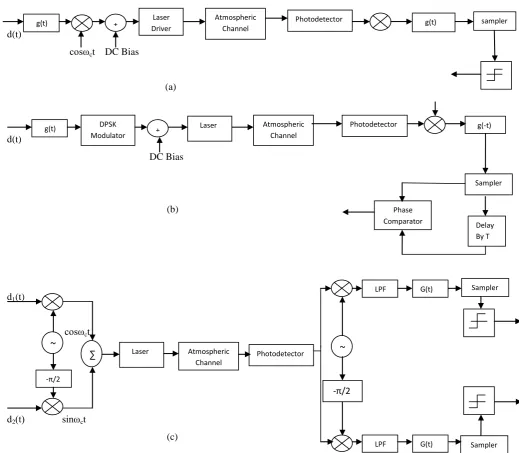
Fig. 1 Schematic of FSO
Traditionally, wireless technology has always been associated with radio frequency. But transmission by other carrier than RF waves can be more advantageous in some applications. The main advantage of FSO technology is the availability of huge bandwidth which could help in providing broadband wireless extensions to end-users. RF based wireless networks
can offer data rates from tens of Mbps (point-to-multipoint) up to several hundred Mbps (point-to-point) whereas FSO Technology can provide date rates varying form hundred Mbps to several Gigabits[2] . Spectrum congestion in RF systems face an exponentional increase in bandwidth requirements around the globe and it is one of the biggest challenges in expansion of networks. The most efficient solution to this problem is the use of FSO system which guarantees abundant bandwidth because with an optical carrier, bandwidth of upto 2000THz can be delivered, which is as high as 105 of current RF networks. Miscellaneous features like data security, licence free spectrum, quick and easy set up of link, no digging of trenches etc. have made FSO need of the hour. Moreover the cost of FSO system is also lower than RF systems[3].
The greatest challenge that FSO faces result from the atmospheric channel, resulting in signal scattering, absorption and fluctuation[4]. The travelling beam through atmosphere comes across huge attenuation due to which a huge amount of data loss takes place. The atmospheric channel attenuates the field traversing it as a result of absorption and scattering processes. The major challenge facing the deployment of FSO systems is their performance in different weather conditions, particularly in the presence of fog. The principal disadvantage of using such communication systems is the harmful effect of the atmosphere on light transmission and thus on the link availability and reliability. The severity and duration of these effects will affect the allowable distance and the availability of the links. The main factor responsible for FSO performance degradation is the atmospheric scintillation caused by atmospheric temperature inhomogeneity[5]. Scintillation results in signal fading which degrades the system performance. Scintillation is caused by the variation in temperature due to which zones of differing density act as lenses and light gets scattered from its intended path. Thus, the interest in this technology has led to the need to understand the effects of various weather conditions on laser radiation propagation in the atmosphere. There are various atmospheric models which have been suggested for understanding turbulent nature of atmosphere but gamma-gamma model is very effective in terms of predicting the atmospheric turbulence [6].
d(t)
cosωct DC Bias
(a)
d(t)
DC Bias
(b)
d1(t)
cosωct
d2(t) sinωct
(c)
[image:2.595.47.567.60.513.2]
Fig. 2 FSO Link employing (a) BPSK Modualtion (b) DPSK Modulation (c) QAM Modulation
2. THE GAMMA GAMMA
TURBULENCE MODEL
The gamma-gamma turbulence model proposed by Andrews et al.[7] has been used to study the turbulent behaviour of atmosphere. This model is suitable for both weak and strong turbulence regimes. Large scale and small scale fading effects have been studied to predict the fluctuation of light radiation travelling turbulent atmosphere where it is assumed that large scale eddies modulate small scale eddies. The normalized received irradiance is given as the product of two random processes as follows:
I=IxIy (1)
Where Ix and Iy arise from large scale and small scale eddies
respectively and both of them are supposed to obey gamma gamma distribution.
The gamma gamma model for the probability density function of received irradiance is given by:
P(I)=2(𝛼𝛽 )
(𝛼 +𝛽 ) 2
𝛤 𝛼 𝛤(𝛽) 𝐼
𝛼 +𝛽
2 −1𝐾𝛼−𝛽(2 𝛼𝛽𝐼),I>0 (2)
Where I is the received signal intensity, α and β are parameters of the probability density function, Γ is the gamma function and 𝐾𝛼−𝛽is the modified bessel function of the second kind of order. Here, α and β are the effective number of small-scale and large scale eddies of turbulent environment. These parameters are given as:
α={exp[0.49σ2/(1+1.11σ12/5
)7/6]-1}-1 (3) β={exp[0.51σ2/(1+1.11σ12/5
)5/6]-1}-1 (4) whereσ2= 1.23Cn2k7/6L11/6 is the rytov variance which
represents the variance of log-intensity fluctuation in which 𝐶𝑛2 is the refractive-index structure parameter, k is the wave number, and L is the distance between transmitter and receiver.
3
.
MODULATION TECHNIQUES
3.1 BPSK Modulation
BPSK is the simplest form of phase shift keying (PSK) which uses two different phases for data modulation such that phases DPSK
Modulator +
g(-t)
g(t) Laser
Driver
Atmospheric Channel
Photodetector
Sampler
Delay By T Phase
Comparator
~
-π/2
∑
LaserDriver
Atmospheric Channel
Photodetector rr
-π/2
~
LPF
LPF
G(t) Sampler
G(t) Sampler
g(t) + Photodetector
g(t)
sampler Laser
Driver
are 180degrees apartand hence it can also be termed as 2-PSK. The general form for BPSK is as follows:
s(t)= 2𝐸𝑏
𝑇𝑏cos(2πfct+π(1-n)), n=0,1 (5)
For subcarrier BPSK modulation, the output electrical signal is given by[8]:
r(t)=I(t) + mI(t) [si(t)cos(2πfct)-sq(t)sin(2πfc (t)] +ni(t)×
cos(2πfct)-nq(t)sin(2πfct) (6)
where si(t) and sq(t) are in phase and quadrature
signals,respectively amd m is the modulation index, fc is the intermediate carrier frequency, ni(t) and nq(t) are the guassian
processes with the variance 𝜎𝑛2. By taking into account the above factors, the conditional PDF p(r|x) of received signal can be written as :
𝑝 𝑟 𝑥 = 2𝜋𝜎 2
𝑛Г 𝛼 Г 𝛽 𝛼𝛽
𝑚 𝛼 +𝛽
2
𝑡∞ 𝛼+𝛽2 −1
0 𝐾𝛼−𝛽 2 𝛼𝛽𝑡𝑚 ×
exp (𝑟−𝑡)2𝜎 2
𝑛2 dt, x = +1 (7)
𝑝 𝑟 𝑥 = 2𝜋𝜎𝑛Г2 𝛼 Г 𝛽 𝛼𝛽𝑚
𝛼 +𝛽 2
𝑡∞ 𝛼+𝛽2 −1
0 𝐾𝛼−𝛽 2
𝛼𝛽 𝑡
𝑚 ×
exp (𝑟+𝑡)2𝜎 2
𝑛
2 dt, x = −1 (8)
The BER for BPSK modulated FSO link in turbulent atmosphere can be given by:
Pe=
(𝛼𝛽 )(𝛼 +𝛽 )2
𝛤 𝛼 𝛤(𝛽) 𝑥 ∞ 0
𝛼 +𝛽
2 −1𝐾
𝛼−𝛽(2 𝛼𝛽𝐼)erfc 𝑚𝑥
2𝜎𝑛 dx (9)
Considering AWGN system the expression for BER for BPSK system can be simplified to:
Pbpsk=
1 2erfc
𝑚2
2𝜎𝑛2 (10)
3.2
DPSK Modulation
In Differential Phase shift keying (DPSK), the demodulator determines the changes in the phase of the received signal rather than the phase itself. Since this technique depends on the difference between successive phases, it is termed as DPSK. It is more simpler as compared to ordinary PSK since there is no need for the demodulator to have a copy of the reference signal to determine the exact phase of the received signal. So this technique is very useful especially in case of degraded FSO links where when the phase estimation for the carrier demodulation is not possible. In FSO systems, the modulated carrier RF signal is used to modulate the irradiance of an optical carrier. After traversing the atmospheric channel, the photdetector receives the irradiance and generates photocurrent accordingly which is given by [9]:
I(t)=RI(1+βm t +n(t) (11) Where I=Ipeak/2,Ipeak is the peak received irradiance, R is the
photodetector responsivity, β is modulation index, m(t)=A(t)cos(ωct + 𝛳), n(t) is the additive noise. Since the
subcarrier has been pre-modulated using DPSK and it has non-varying amplitude and β has been normalized to unity. So peak amplitude becomes A(t)=A≤ 1. The electrical SNR per bit is given by[10]:
SNRe=𝐴2𝑅2𝐼2/2σ2 (12)
The conditional BER for the DPSK technique is given by:
Pec=0.5exp(-0.5SNRe) (13)
In the presence of atmospheric turbulence,the unconditional BER is given by:
Pe= (𝛼𝛽 )(𝛼+𝛽 )2 𝛤 𝛼 𝛤(𝛽) 𝑥
∞ 0
𝛼+𝛽
2 −1𝐾
𝛼−𝛽(2 𝛼𝛽𝐼) ×(0.5exp(-0.5SNRe)) dx
(14)
3.3 QAM Modulation
QAM modulation is a method of combining two amplitude-modulated signals into a single channel, thereby doubling the effective bandwidth. In QAM, there are two carriers,each having the same frequency but differing in phase by 90 degrees(one quarter of cycle). Mathematically, one of the signals can be represented by a sine wave, and the other by a cosine wave. The two modulated carriers are combined at the source of transmission and then the resulting modualted carrier is used to modualte the irradiance of an optical. At the destination, the carriers are separated, the data is extracted from each, and then the data is combined into the original modulating signal. In QAM, we use two double sideband (DSB) signals using carriers of same frequency but in phase quadrature. The two baseband signals used are m1(t) and m2(t)
and the corresponding QAM signal is given by:
ФQAM(t)=m1(t)cosωc(t)+m2(t)sinωc(t) (15)
Both the modulated signals occupy same band but the two signals can be separated at the receiver by synchronous detection using two local carriers in phase quadrature.Now we consider data symbols which comprise log2M data symbols
which have been mapped to one of the M phases on each carrier signal m(t). So the conditional BER expression for QAM is given by[11]:
Pec=
2(1−1/ 𝑀) 𝑙𝑜𝑔2𝑀 Q
3𝑙𝑜𝑔2𝑀(𝑆𝑁𝑅 )
2(𝑀−1) (16)
The unconditional BER for FSO link is obtained by averaging the conditional bit error rate over the atmospheric turbulence stastics which is given by:
Pe=(𝛼𝛽 )
(𝛼+𝛽 ) 2 𝛤 𝛼 𝛤(𝛽) 𝑥
∞ 0
𝛼+𝛽
2 −1(2 𝛼𝛽𝐼) 2(1− 1 𝑀) 𝑙𝑜𝑔2 𝑀 Q
3𝑙𝑜𝑔2𝑀(𝑆𝑁𝑅𝑒)
2(𝑀−1)
dx (17)
4.
SIMULATION
RESULTS
AND
DISCUSSIONS
The system described above has been simulated using matlab.The simulation parameters used are given below as : Table 1. Simulaton Parameters
Parameters Value
Bit Rate(Rb) 155 Mbps
Link Range 1 Km
Responsivity 1
Temperature 300 K
Optical Filter Bandwidth 1e-3 µm
Receiver Field of view 0.6 radian
Refractive Index Structure Parameter, 𝐶𝑛2
0.75e-14 m-2/3
Load Resistance 50 Ω
Boltzman’s Constant 1.38e-23 J/K
Electronic Charge 1.602e-19 C
[image:4.595.49.294.70.398.2]Fig. 3 Gamma-Gamma PDF for weak, moderate and strong turbulent regimes
Fig. 3 shows the probability density curve for gamma-gamma model with different values of turbulent strength. The values of alpha and beta indicate whether the atmospheric turblence region is weak, moderate or strong. In particular, the gamma-gamma model has a much higher denstiy in the high amplitude region leading to a more severe impact on the system performance.
Fig. 4 shows that BER performance of M-QAM for a FSO link. The BER has been plotted as a function of SNR for different values of M. It has been found that BER performance gets degraded as the value of M is increased. The BER performance of 64-QAM is highly degraded as compared to 8-QAM.
Fig. 4 BER versus SNR for M-QAM Modulation Technique
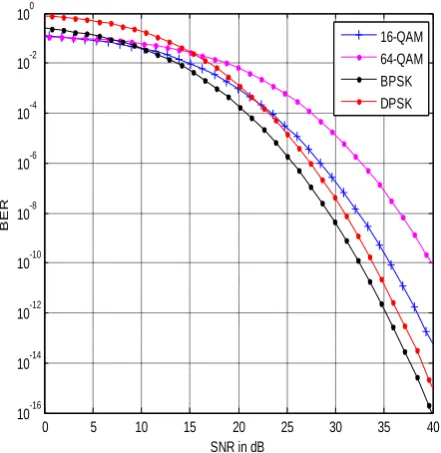
Fig. 5 shows the BER performance of BPSK, DPSK, 16-QAM and 64-16-QAM and it is clear that BPSK performs better than the other techniques for a turbulent FSO link. DPSK performs better than 16-QAM and 64-QAM. So BPSK modulation technique is giving the best performance among the other modulation techniques.
Fig. 5 BER versus SNR for different Modulation Technique
Fig. 6 shows BER performance of BPSK, DPSK, 8-QAM,16-QAM and 64-8-QAM,16-QAM. BPSK is giving the best performance among the all techniques used for a FSO link but the BER performance of 8-QAM and DPSK becomes almost similar after SNR of 35 dB.
Fig. 6 BER versus SNR for different modulation techniques
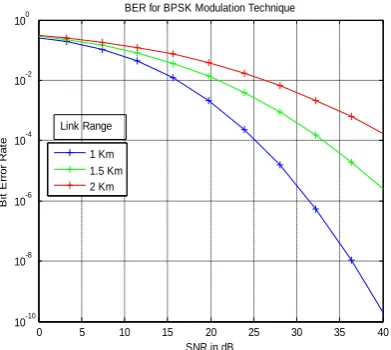
Fig. 7 shows the BER perfromance of BPSK modulation technique for different link ranges. It has been observed that as the link range is getting increased, the BER performance is getting degraded.
0 0.5 1 1.5 2 2.5 3 3.5 4 4.5 5
0 0.2 0.4 0.6 0.8 1 1.2 1.4
Irradiance,I
G
a
m
m
a
G
a
m
m
a
P
D
F:
P
(I
)
Weak:Alpha=11,Beta=9 Moderate:Alpha=4.5,Beta=2.2 Strong:Alpha=4,Beta=1.6
0 5 10 15 20 25 30 35 40
10-15
10-10
10-5
100
SNR in dB
BER
8-QAM 16-QAM 64-QAM
0 5 10 15 20 25 30 35 40
10-16 10-14 10-12 10-10 10-8 10-6 10-4 10-2 100
SNR in dB
BER
16-QAM 64-QAM BPSK DPSK
0 5 10 15 20 25 30 35 40
10-16 10-14 10-12 10-10 10-8 10-6 10-4 10-2 100
SNR in dB
BER
[image:4.595.326.547.152.379.2] [image:4.595.327.544.487.671.2] [image:4.595.65.285.583.714.2]Fig. 7 BER versus SNR for BPSK using different link ranges
5.
CONCLUSIONS
From the BER performance of BPSK, DPSK and M-QAM modulation techniques for a turbulent FSO link, we found that for higher order M-QAM, the BER performance of M-QAM degrades i.e. 16-QAM gives better BER performance than 64-QAM. DPSK and 8-QAM behave more or less the similar but for higher values of M (16-QAM and 64-QAM) the performance of DPSK is far better. For lower values of SNR i.e. up to 15dB, the performance of all the modulation techniques is more or less the similar but for higher SNR values, BPSK modulation technique delivers better BER performance than the other discussed techniques. Moreover, the BER performance also gets degraded as the link range is increased.
6.
ACKNOWLEDGEMENT
I would like to thank Mr. Ajaypaul Singh Channa , Mr. Sumit Sharma, Mr. Harpushap Singh, Mr. Prabhjot Singh and Mr. Umesh Gupta for their sincere help for the completion of this research work.
7. REFERENCES
[1] H. Willebrand and B.S Ghuman,Free Space Optocs: Enabling Optical Connectivity in today’s network.Indianapolis:SAMS publishing,2002.
[2] Isaac I. Kim,Bruce McArthur, and E.Korevaar, “Comparison of laser beam propagation at 785 nm and 1550 nm in fog and haze for optical wireless communication,”SPIE Proceeding:Optical Wireless Communications III,vol. 4214,pp. 26-37,2001.
[3] D. Kedar and S. Arnon, “Optical wireless communication through fog in the presence of pointing errors,”Applied Optics,vol. 42,pp. 4946-4954,Aug. 2003. [4] S. Karp,R.M. Gagliardi,S.E Moran,and L.B Stotts,Optical Channels:fibers,clouds,water and the atmosphere.New York:Plenum Press,1988.
[5] I.I. Kim,M. Mitchell,and E.J Korevaar, “Measurement of scintillation for free-space laser communication at 785 nm and 1550 nm,”Optical Wireless Communications II,Proceedings of SPIE,vol. 3850,pp. 49-52,1999 [6] D. Killinger, “Free space optics for laser communication
through the air,”Opt. Photon. News,vol. 13,no. 3,pp. 36-42,Oct. 2002.
[7] L.C. Andrews,R.L. Phillips,and C.Y. Hopen,Laser beam scintillation with applications,Bellingham:SPIE,2001. [8] W.O Popoola,Z.Ghassemlooy,and E. Leitgeb,
“Free-space optical communication using subcarrier modulation in gamma-gamma atmospheric turbulence,” in 9th International Conference on Transparent Optical Networks(ICTON ’07) Rome Italy,Vol. 3,pp. 156-16-,2007.
[9] R.M Gagliardi and S. Karp,Optical Communications,2nd Edition ed. New York:John Wiley,1995.
[10]W.O. Popoola,Z. Ghassemblooy and E. Leitgeb, “BER Performance of DPSK Subcarrier Modulated Free Space Optics in fully Developed Speckle”,IEEE-CSNDSP,Graz,Austria,pp. 273-277,23-25 July 2008. [11]J.G Proakis,Digital Communications,New
York:McGraw-Hill,2004.
0 5 10 15 20 25 30 35 40
10-10 10-8 10-6 10-4 10-2 100
SNR in dB
B
it
E
rr
o
r
R
a
te
BER for BPSK Modulation Technique