Application of Weakest Link Probabilistic Framework for
Fatigue Notch Factor to Turbine Engine Materials
Oluwamayowa A. Okeyoyin*, Gbadebo M. Owolabi Department of Mechanical Engineering, Howard University, Washington DC, USA
Email: *[email protected]
Received May 21,2013; revised June 24, 2013; accepted July 23, 2013
Copyright © 2013 Oluwamayowa A. Okeyoyin, Gbadebo M. Owolabi. This is an open access article distributed under the Creative Commons Attribution License, which permits unrestricted use, distribution, and reproduction in any medium, provided the original work is properly cited.
ABSTRACT
This paper is concerned with the extension of a recently developed probabilistic framework based on Weibull’s weakest link and extreme-value statistics to aero-engine materials like titanium alloy and nickel-base super alloys using simula- tion strategies that capture both the essence of notch root stress gradient and the complexity of realistic microstructures. In this paper, notch size effects and notch root inelastic behavior are combined with probability distributions of micro- scale stress-strain gradient and small crack initiation to inform minimum life design methods. A new approach which can be applied using crystal plasticity finite element or closed-form solution is also proposed as a more robust approach for determining fatigue notch factor than the existing classical methods. The fatigue notch factors predicted using the new framework are in good agreements with experimental results obtained from literature for notched titanium alloy specimens subjected to uniaxial cyclic loads with various stress ratio.
Keywords: Microstructure; Fatigue; Crack Initiation; Crystal Plasticity
1. Introduction
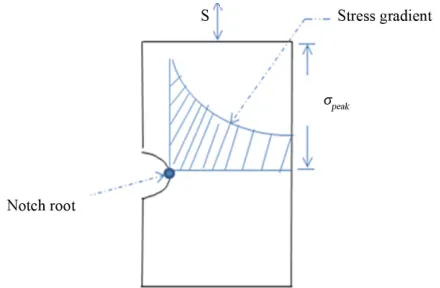
Titanium alloy is widely used in aero engine components. The fatigue resistance of aero-engine components made from this material can be drastically reduced by the presence of small notches on the components formed from the ingestion of foreign objects causing foreign object damage (FOD) [1-2]. To account for the effects of FOD on the fatigue strength of these materials, the dam- age are usually modeled as notches with a certain depth and notch root radius [1-2]. The severity of these notches in materials is characterized by the elastic stress concen- tration factor, kt which is the ratio of peak (maximum)
local stress at the notch root to the remotely applied stress, S as shown inFigure 1.
peak t k
S
(1)
kt is dimensionless and a compilation of its values for
different notch geometries and loading modes can be found in Peterson’s book [3]. However, kt under-esti-
mates fatigue life and several arguments have been at- tributed to this observation. The fatigue life of notched
component is not only dependent on the peak stress as predicted by kt, but also on the average stress that acts
over a finite damage process zone. Consequently, fatigue life prediction methods based on kt typically do not con-
[image:1.595.313.533.571.715.2]sider stress gradients which have been shown to influ-ence the fatigue life of complex notched components [4-5]. Thus, the actual reduction factor on long fatigue lives is typically represented by the concept of fatigue notch factor, otherwise known as the fatigue strength reduction factor, kf.
The fatigue notch factor, kf, is determined at a given
number of completely reversed cycles (typically 106 or 107) to crack initiation and is given as:
unnotched notched
f f
f
k
(2) where is the fatigue strength of the unnotched specimen and is the fatigue strength of the notched specimen. The difference between kt and kf for a
given microstructure is typically represented by the notch sensitivity factor, q given as:
unnotched
f
notched
f
1 1
f t
k q
k
(3) At q = 0, there is no notch sensitivity and at q = 1 we have full notch sensitivity, i.e., full theoretical elastic concentration effect. Several empirical relations have been developed to estimate the fatigue notch factor of a material and its associated notch sensitivity index. These techniques include: the classical methods (Neubers [6-7], Peterson [3,8] and Heywood [9]), stress field intensity method [10], and probabilistic method based on linear elastic fracture mechanics [11]. Detail review of these methods can be found in [12], each attempt to simplify the complex behavior of fatigue in notched components to a few geometric and characteristic material constants. However, these approaches suffer from some fundamen- tal drawbacks. Among these drawbacks is that the fatigue notch factors are obtained through time consuming and costly experiments. Moreover, the relationship of micro- structure to Kf, using these constants has proven difficult to
establish. Recently, Owolabi et al. [14] have established a probabilistic framework based on weakest link theory and extreme-value statistics which incorporates informa- tion regarding the peak stress and stress gradient relative to microstructure length scales within a well defined fatigue damage process zone around the notch root. This paper combines the developed probabilistic framework with other existing probabilistic formulations that con- sider the size distribution and different competing dam-age mechanisms for aero-engine materials.
2. Material Systems
The alloy used for this study is a dual-phase titanium alloy, Ti-6Al-4V. Ti-Al alloys offer a range of properties such as high strength and fracture toughness at low tem- peratures to high strength and creep resistance at elevated temperatures. These wide ranges of properties have led to extensive use of Ti-Al alloys in engineering applications from airframe components to compressor blades applica- tions. The experimental data used in this work were ob- tained from Haritos et al. [1], Lanning et al. [13] and Naik et al. [15] on Ti-6Al-4V for various notch root ge-
ometries and stress ratios. The Ti-6Al-4V specimens used in these papers were obtained from forged bar, which were initially heat treated to 705˚C for 2 h, and then followed by static argon cooling to below 149˚C. The material was subsequently annealed in vacuum at 549˚C for 2 h. This is then followed by static argon cool- ing to below 149˚C. The microstructure of the resulting bar is as shown Figure 2.
3. Crystal Plasticity Model of Ti-6Al-4V
Crystal plasticity models are more suited for studying heterogeneity and interaction across grains in the notch root field as they relate grain scale stress to crystallo- graphic slip response [16-18]. The use of crystal plastic- ity is thus relevant for the accurate prediction of the stress-strain field response at the notch root. The crystal plasticity model used in this work is based on 3D crystal plasticity models developed by Mayeur and McDowell (2007) [19]. Thus, only the summary of the crystal plas- ticity constitutive models is presented in this section.The deformation in the material is based on a standard two term multiplicative decomposition of the deforma- tion gradient into elastic and plastic parts, i.e.,
e p
FF F
(4)
Here, F is the total deformation gradient, Fp cap-
tures the dislocation glide through the lattice while Fe
captures the rigid body rotation and elastic stretching of the lattice. The plastic velocity gradient Lˆp defined as the sum of the crystalline shear displacement rates over all slip systems k is given in the isoclinic, lattice invariant intermediate configuration as [20]:
1
0 0
1
sys N
ˆp p p k k k
k
F F S n
L
Here, ߛk is the slip system shearing rate, and
0 and 0 are fixed unit vectors in the slip direction and slip
plane normal direction, respectively. The slip vectors and remain unchanged through deformation Fp
(5) k S k
n
0
k
S 0
k n
[image:2.595.345.497.576.715.2]50 μm
from the reference to the intermediate configuration and maintain orthogonality through Fe. The relationship be-
tween the slip system shearing rate and the resolved shear stress of the kth slip system is described by the
power law flow rule given by McGinty [21] as:
0 sgn
M
k k k
k k
k D
k
(6)
Here, γ0 is the reference shearing rate, M is the inverse strain-rate sensitivity exponent which controls the rate sensitivity of flow, τk is the resolved shear stress, χk is the
back stress, кk is the length scale-dependent threshold
stress and Dk is the drag stress. As developed by Zhang et
al. [22], the drag stress is taken as a non-evolving con- stant, while the back stress evolves according to an Arm- strong-Frederick direct hardening/dynamic recovery type of equation, i.e.,
k k k
D
h h k
(7)
With χk (0) = 0. The threshold stress is expressed as
y
k k
s k d
(8)
Simulation of Notched Components
The crystal plasticity constitutive model was coded into ABAQUS 2006 UMAT, based on previous work by Zhang et al. [22]; Mayeur and McDowell, 2007 [19]. For textured Ti-6Al-4V alloy, some of the material parame- ters in the crystal plasticity are obtained from Bridier et al. [23]. Finite element simulation was performed on three different geometries, meshed using 3D stress four- node linear tetrahedron element type (C3D4) and con- sisting of approximately 218940 elements to estimate the stress distribution and possible plastic straining that oc- cur in the notched specimens. The dimensions of the specimens used and the different test cases are as given in Table 1. A diagram of the gage section of the speci-
[image:3.595.363.488.86.215.2]men is provided in Figure 3.
Table 1. The 7 different test cases. Test
Case Kt
Notch radius, (mm)
Notch depth, h (mm) R-ratio
Average alternating HCF strength at 106
cycles (MPa)
1 2.78 0.330 0.729 −1 173.6
2 2.78 0.330 0.729 0.1 158.9
3 2.78 0.330 0.729 0.5 104.6
4 2.78 0.203 0.254 0.10 167.2
5 2.78 0.203 0.254 0.50 105.2
6 2.78 0.127 0.127 0.10 144.7
7 2.78 0.127 0.127 0.50 111.0
h
d
D
60˚ ρ
Figure 3. Gage section of the cylindrical specimen with a circumferential V-notch [1].
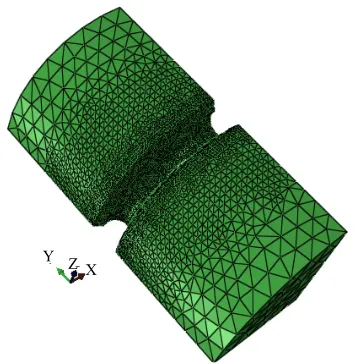
To reduce computational time, the notched specimen geometries are decomposed into three different regions: an outermost region, far from the notch root, where iso- tropic linear elasticity is used; an intermediate transition region where macroscopic J2 cyclic plasticity theory is used; and finally the notch root region where crystal plasticity theory is used. The element size at the crystal plasticity region was chosen to coincide with the average grain size of Ti-6Al-4V which is 45 μm. The domain decomposition is as shown in Figure 4. Also, one quar-
ter of the cylindrical notched specimen was modeled because of the symmetry in loading and geometry of the specimen as shown in Figure 5.
The bottom of the notched specimen is encastre while symmetry boundary conditions are applied to the two planes of symmetry. The notched specimens were tested at four different load ratios; R = 0.1, R = 0.5 and R = −1. Average alternating HCF strength at 106 cycles, as de- termined by Naik et al. [15] and as contained in Table 1
for different load ratios, are applied to the top of the specimen.
[image:3.595.58.286.597.736.2]Figure 1. Domain decomposition of the cylindrical notched specimen geometry.
[image:4.595.83.263.280.462.2]X Y Z
Figure 2. Finite element mesh for 0.33 mm notch root ra- dius and Kt = 2.78 consisting of four-node linear tetrahe- dron element type (C3D4).
For a smooth specimen with defects having a fatigue damage process zone of volume V, the whole volume is divided into small volume elements, dV with probability of failure of a sufficiently small volume element given as:
dPdV
(9) where here, is the critical defect density defined as the expected number of defects per unit volume of the smooth specimen. Using weakest link theory, the prob- ability of survival of the entire volume is obtained from the probability of survival of all “m” number of sub- volumes i.e.
1 1
1 d 1 d
m m
s i
i i
P P
V
V
(10)
This equations assumes that the defects are randomly distributed within the volume and thus do not interact, which is only reasonable when considering the formation
of a fatigue crack(s) in high cycle (HCF) and very high cycle fatigue (VHCF) regimes. Following the framework presented in [14], as the volume of each small element tends to zero, Equation (10) can be transformed into
exp d
d
s
V P
(11)
Using the generalized extreme value distribution func- tion, the distribution of defects, a, that are above the threshold, ath, is modeled by a power law of the form
1
0 0
1
1 a ath
V a
(12) where a0 and are the scale and shape parameters re- spectively. Substituting (12) into (11) yields
1
0 0
1
exp 1 d
d
th s
V
a a
P V
V a
(13)
If *
0
th
a a , re-arranging Equation (13) yields, 1
*
0 0
1
exp d
s
a
P V
V a
(14)
where is regarded here as the mean defect size. Equation (14) is valid only if
* 0
a
0
. The critical defect size is related to the microscopic stress (taking here as a random variable) through a power law relationship of the form
z A
a
(15)
where A and z are materials constants. Similarly, the stress amplitude, σ0 corresponding to the mean defect size can be taken as the fatigue limit of the reference volume Vo for 50% failure probability. The two parame- ters can also be related by a power law of the form:
* 0
a
0 *
0
z
A a
(16)
Combining Equations (15) and (16) we have
0 * 0
z
a a a
(17)
Substituting Equation (17) into Equation (14) yields
0 0
1
exp d
b s
P V
V
(18)
0 0
1
1 exp d
b f P V
V
(19)
To facilitate development of the expression for fatigue notch factor from Equation (18), the concept of stress homogeneity factor that have been used is introduced here. Thus Equation (18) can be re-written as,
max 0 1 exp b f o kV P V
(20)
where max 1 d b k V
V(21)
is regarded as the stress homogeneity factor. Conven- tionally, the fatigue notch factor is the ratio of unnotched to notched fatigue strength at the same probability of failure (usually 50%). Using Equation (20), the probabil- ity of failure of unnotched specimen and a notched specimen will be the same when
max, max,
0 0
exp exp
b s
s s n n
o o
k V k V
V V b n
(22)
where the subscripts n and s represent the respective value of the variable for notched and smooth (unnotched) specimens. The ratio of the smooth to notch fatigue driv- ing force parameters (i.e., the stress amplitude) is used to define a new fatigue notch factor given as
1 1
max, max,
b b
s n n
f
n s s
k V k k V
(23)
For smooth specimen that is loaded at a very low stress or strain amplitude in the HCF regime, the number of critically stressed grains (or elements) is very small. Thus for the life limiting case in which only one grain or element is critically stressed above the threshold, Vs = Ve
(i.e., volume of element or grain) and Ks= 1; thus Equa-
tion (23) becomes
1 1 max, max, 1 1 max, 1 d b b s n f n n e b b b n n e V k k V V V V V
(24)
However, if the materials contain some pores or inclu- sions, Equation (23) must be used. It is important to state that Equations (23) and (24) can be used only if subsur- face crack initiation is the failure process, if crack origin- nates from the surface, then the volume parameter in this equation should be replace with the surface area.
4. Closed Form Solution for Fatigue Notch
Factor
To resolve inelastic deformation at the scale of micro- structure to facilitate next generation microstructure- sensitive notch root analyses inherently requires mesh refinement to the scale of microstructure, which is often several orders of magnitude finer than the scale of the component. Moreover, the kind of constitutive equations that must be used are often of advanced form and requir- ing rather sophisticated and time-consuming computa- tional strategies to perform concurrent analyses at the component and notch root microstructure scales. Ac- cordingly, direct application of multiscale finite element analysis is simply too computationally time consuming for practical microstructure-sensitive fatigue damage assessment of notched components under multiaxial loads. Thus, for practical engineering application, a more simplified and approximate model for fatigue notch fac- tor is presented here based on closed form solution for stress distribution at the notch developed by Glinka using the Creager-Paris solutions of the stress field ahead of a crack. For a notched component with notch root radius and stress concentration factor, kt, the axial stress distri-
bution along the notch root centre line is given as:
3 2
1 2 3 2
1 2
max,
1 1
2 2 2 2
1 1
2 2 2 2
t n k S x x x x
(25)
Finding the ratio of the stress amplitude to the maxi- mum stress and substituting into Equation (24) at x = ac (i.e., the critical distance) will allow the determination of an expression for the fatigue notch factor of the form
3 2 1
1 2
c c
1
1 1 1 d
2 2 2 2
b b f b n e k V
V a a
V V
(26) Assuming that the critical distance is constant for the notched component with a notch root radius ρ, Equation (26) reduces to3 2
1 2 1
c c
1 1
2 2 2 2
b n f e V k a a
V
(27)
The above equation for kfwas derived using the fa-
probabilistic framework based on the weakest link, and the Glinka’s closed form solution based on the notch root stress distribution. The expression in Equation (25) has been shown to give a good prediction of the stress field for relatively blunt U-notches and be used over a distance of 3ρ from the notch root with an accuracy of approxi- mately 7% [15].
proach, the value of kf was calculated using the closed
form solution for fatigue notch factor in Equation (27) and the result is compared to experimental results deter- mined by R.A. Naik et al. [15] as shown in Table 2.
Both results are in agreement with the experimental re- sults with minimal difference. The kf determined using
the Weibull’s weakest link approach, when the loading ratio R = −1, is more accurate than for every other load- ing ratios tested.
5. Results and Discussion
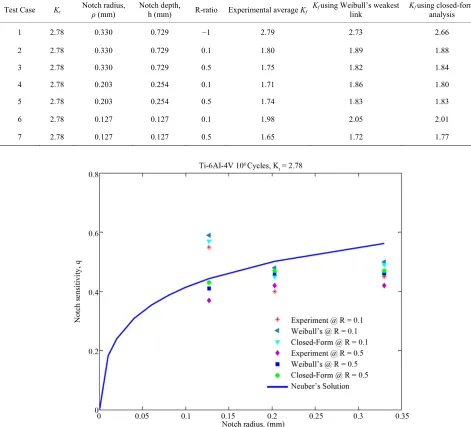
Also, the radius of curvature at the notch root plays a vital role on the stress gradient at the notch. This effect is captured by the fatigue notch sensitivity factor q given in Equation (3). Figure 6 gives a plot of the notch sensitive-
ity factor as a function of the notch root radius for the The stress distribution obtained from the finite element
analysis was used in determining the average kffor the
[image:6.595.57.528.289.716.2]geometry using the proposed probabilistic framework based on Weibull’s weakest link and extreme-value sta- tistics. Also as a further validation of the proposed ap-
Table 2. Comparison of measured and predicted Kf using FEM and closed form analysis.
Test Case Kt Notch radius, ρ(mm) Notch depth, h (mm) R-ratio Experimental average Kf Kfusing Weibull’s weakest link Kfusing closed-form analysis
1 2.78 0.330 0.729 −1 2.79 2.73 2.66
2 2.78 0.330 0.729 0.1 1.80 1.89 1.88
3 2.78 0.330 0.729 0.5 1.75 1.82 1.84
4 2.78 0.203 0.254 0.1 1.71 1.86 1.80
5 2.78 0.203 0.254 0.5 1.74 1.83 1.83
6 2.78 0.127 0.127 0.1 1.98 2.05 2.01
7 2.78 0.127 0.127 0.5 1.65 1.72 1.77
different load ratio. The line plot represents the notch sensitivity factor calculated using the Neuber’s formula- tion [7] given in Equation (28) where a0 is a material con- stant taken to be 0.2 for Ti-6Al-4V [1]. The plot shows that the new approach and the closed-form solutions give more accurate result compared to the existing Neuber’s formulation.
0
1
1
q
a
6. Conclusion
mework based on Weibull’s weakest
ledgements
ress their profound gratitude
REFERENCES
[1] G. K. Haritos . Lanning, “Notch
(28)
A probabilistic fra
link extreme-value statistic that accounts for stress gra- dient at the notch root and the realistic microstructure of the material is presented. The fatigue notch factors, kf,
estimated by this approach are compared with experi- mental kf. The comparison shows that the proposed
method accurately predicts the fatigue notch factor of Ti-6Al-4V for the different Load ratios applied to the specimen geometry analyzed. Also, kf determined from a
closed form solution of the proposed probabilistic ap- proach validates the effectiveness of the proposed meth- od. A plot of the notch sensitivity index against the notch root radius analyzed for the different load ratios as shown in Figure 6 shows that the proposed approach gives more
accurate result compared to the existing Neuber’s for- mulation.
7. Acknow
The authors of this paper exp
to the Department of Defense for the financial support provided through research and educational program for HBCU/MSI (contract #W911NF-11-1-014, L. Russel and D. Stargel, Program Managers.)
, T. Nicholas and D. B
Size Effects in HCF Behavior of Ti-6Al-4V,” Interna-tional Journal of Fatigue, Vol. 21, No. 7, 1999, pp. 643- 652. doi:10.1016/S0142-1123(99)00023-7
[2] Y. Yamashita, Y. Ueda, H. Kuroki and M. Shinozaki, “Fatigue Life Prediction of Small Notched Ti-6Al-4V Specimens Using Critical Distance,” Engineering Frac-ture Mechanics, Vol. 77, No. 9, 2010, pp. 1439-1453. doi:10.1016/j.engfracmech.2010.04.001
[3] R. E. Peterson, “Stress Concentration Factors,” W
. B. Heywood, “The Size Effect iley, New York, 1974.
[4] C. E. Philip and R in
Fa-tigue of Plain and Notched Steel Specimens under Re-versed Direct Stress,” Proceedings of the Institution of Mechanical Engineers, Vol. 165, 1951, pp. 113-124. doi:10.1243/PIME_PROC_1951_165_014_02
and T. Pircher, “The Fatigue Behaviour of Three-Dim sional Stress Concentrations,” International Journal Fatigue, Vol. 27, No. 3, 2005, pp. 207-221.
[5] D. Bellett, D. Taylor, S. Marco, E. Mazzeo, J. Guillois en-
of
doi:10.1016/j.ijfatigue.2004.07.006
[6] H. Neuber, “Theory of Stress Concentration in Shear Strained Prismatic Bodies with Arbitrary Non-Linear Stress Law,” Journal of Applied Mathema
chanics, Vol. 28, No. 4, 1961, pp. 544-550. tics and Me-doi:10.1115/1.3641780
[7] H. Neuber, “Theory of Notch Stresses: Principle for Exact Stress Calculations,” Edwards, Ann Arbor, 1946. [8] R. E. Peterson, “Notch sensitivity,” In: G. Sines and J. L.
Waisman, Eds., Metal Fatigue, McGraw-Hill, New York, 1959, pp. 293-306.
[9] R. B. Heywood, “Stress Concentration Factors, Relating Theoretical and Practical Factors in Fatigue Loading,”
Engineering, Vol. 179, 1955, pp. 146-148.
[10] Y. Weixing, “Stress Field Intensity Approach for Pre-dicting Fatigue Life,” International Journal of Fatigue, Vol. 15, No. 3, 1993, pp. 243-246.
doi:10.1016/0142-1123(93)90182-P
[11] T. Anderson, “Fracture Mechanics: Fundametals and Applications,” 3rd Edition, Taylor & Francis, Boca Raton, 2005.
[12] W. D. Musinski, “Novel Methods for Microstructure- Sensitive Probabilistic Fatigue Factor,” Ph.D. Thesis, Georgia Institute of Technology, Atlanta, 2010.
[13] D. B. Lanning, T. Nicholas and G. K. Haritos, “On the Use of Critical Distance Theories for the Prediction of the High Cycle Fatigue Limit Stress in Notched Ti-6Al-4V,”
International Journal of Fatigue, Vol. 27, No. 1, 2005, pp. 45-57. doi:10.1016/j.ijfatigue.2004.06.002
[14] G. M. Owolabi, R. Prasannavenkatesan and D. L. McDowell, “Probabilistic Framework for a Microstruc-ture-Sensitive Fatigue Notch Factor,” International Jour-nal of Fatigue, Vol. 32, No. 8, 2010, pp. 1378-1388. doi:10.1016/j.ijfatigue.2010.02.003
[15] R. A. Naik, D. B. Lanning, T. Nicholas and A. R. Kall- meyer, “A Critical Plane Gradient Approach for the Pre- diction of Notched HCF Life,” International Journal Fatigue, Vol. 27, No. 5, 2005, pp. 48
of
1-492. doi:10.1016/j.ijfatigue.2004.10.003
[16] R. Morrissey, C. H. Goh and D. L. McDowell, “Micro-structure-Scale Modeling of HCF Deformation,” Me-chanics of Materials, Vol. 35, No. 3-6, 2005, pp. 295-311. doi:10.1016/S0167-6636(02)00282-X
[17] M. M. Shenoy, “Constitutive Modeling and Life Predic-tion in Ni-Base Superalloys,” Ph.D. Thesis, Georgia In-stitute of Technology, 2006.
[18] R. S. Kumar, A. J. Wang and D. L. McDowell, “Effects of Microstructure Variability on Intrinsic Fatigue Resis-tance of Nickel-Base Superalloys—A Computational Mi-cromechanics Approach,” International Journal of Frac-ture, Vol. 137, No. 1-4, 2006, pp. 173-210.
doi:10.1007/s10704-005-3149-y
International Journal of Plasticity, Vol. 23, pp. 1457-1485.
No. 9, 2007, s.2006.11.006
doi:10.1016/j.ijpla
[20] R. J. Asaro, “Micromechanics of Crystals and Polycrys- tals,” Advances in Applied Mechanics, Vol. 23, 1983, pp. 1-115. doi:10.1016/S0065-2156(08)70242-4
[21] R. D. McGinty, “Multiscale Representation of
Polycrys-
crostructure-deling of Cyclic Deformation of Ti
talline Inelasticity,” Ph.D. Thesis, Georgia Institute of Technology, Atlanta, 2001.
[22] M. Zhang, J. Zhang and D. L. McDowell, “Mi
Based Crystal Plasticity Mo
-6Al-4V,” International Journal of Plasticity, Vol. 23, No. 8, 2007, pp. 1328-1348.
doi:10.1016/j.ijplas.2006.11.009 [23] F. Bridier, D. L. McDowell, P. V
“Crystal Plasticity Modeling of Slip Activ
![Figure 2. Ti-6Al-4V forged plate microstructure [1].](https://thumb-us.123doks.com/thumbv2/123dok_us/7828558.732456/2.595.345.497.576.715/figure-ti-al-v-forged-plate-microstructure.webp)
![Figure 3. Gage section of the cylindrical specimen with a circumferential V-notch [1]](https://thumb-us.123doks.com/thumbv2/123dok_us/7828558.732456/3.595.363.488.86.215/figure-gage-section-cylindrical-specimen-circumferential-v-notch.webp)