http://www.scirp.org/journal/jtts ISSN Online: 2160-0481
ISSN Print: 2160-0473
A Web Based Decision Support System for
Intermodal Port and Dry Port Facilities
Chrysostomos D. Stylios
1, George Georgoulas
1, Petros Karvelis
1, Branislav Opacic
2,
Fabrizio Simeoni
2, Srecko Maksimovic
2, Walter Gerreto
21Labratory of Knowledge and Intelligent Computing, Department of Computer Engineering, Technological Educational Institute of Epirus, Arta, Greece
2Teorema Engineering Srl., Area Science Park Basovizza, Trieste, Italy
Abstract
This paper presents a Web-based Decision Support System (Web-DSS) that was designed and developed to support and provide suggestions on the pro-cedures taking place between a port and a dry port, which have to collaborate, work concurrently and optimize their joint operation. The system operates at the highest hierarchical level supervising a number of different components dealing with three different time scale horizons so as to provide assistance at operational, tactical and strategic level. The Web-based DSS coordinates and integrates the subsystems operating at lower levels and it interfaces with all the involved actors: customers, suppliers, relevant authorities so as to receive all the necessary information to come up with “optimal” suggestions and de-cisions. In this paper, the overall architecture is presented and the individual modules are described.
Keywords
Decision Support System, Modeling, Simulation, Optimization, Intermodal Systems, Operational Research
1. Introduction
Decision making process is a combination of skills, personal intuition, creativity and judgment acquired through ones’ experience and interaction with the sur-rounding environment rather than a strictly disciplined process. For a long time, a person with such skills, the decision maker, would suffice for making decisions for a small company or organization. Nowadays with the increasing complexity of modern business environment, the huge amount of gathered data and the overwhelm of incoming information the human needs to be “supported” by
How to cite this paper: Stylios, C.D., Geor- goulas, G., Karvelis, P., Opacic, B., Simeoni, F., Maksimovic, S. and Gerreto, W. (2017) A Web Based Decision Support System for Intermodal Port and Dry Port Facilities. Jour- nal of Transportation Technologies, 7, 36- 49.
http://dx.doi.org/10.4236/jtts.2017.71003
Received: July 23, 2016 Accepted: December 27, 2016 Published: December 30, 2016
Copyright © 2017 by authors and Scientific Research Publishing Inc. This work is licensed under the Creative Commons Attribution International License (CC BY 4.0).
computerized systems in order to meet the new challenges posed and keep up with competition [1].
An intermodal terminal is such a paradigm of a complex business environ-ment, involving many stakeholders and characterized by a large number of deci-sions to be made based on data and information aggregated from various and heterogeneous sources. This is a typical logistic system where decisions can be categorized as strategic, tactical or operational ones [2]:
• Strategic decisions affect the system’s performance in the long run.
There-fore, these decisions can afford to be taken within a long-time horizon that it is not too restrictive but on the other hand they need to be taken after serious consideration. In this category belong decisions regarding the design of the system itself (selection of a location for the facility, its size, the specific layout of the facilities, adopted Information and Communication Technology (ICT) infrastructure and technologies etc.) the acquisition of resources (i.e. cranes for the case of an intermodal terminal, ICT components, hiring personnel etc.). Computerized support systems for this level try to capture this long lasting effects using aggregated data, simulation models [3] [4] or a combina-tion of modelling and expert knowledge as in the case of the Analytic Hie-rarchy Process (AHP) approach [5].
• Tactical decisions affect the system on a smaller time scale (e.g. monthly or
quarterly) and therefore they do not require time restricted reactions, but usually need to be taken in a shorter time compared to the decisions taken at a strategic level. This kind of decisions include production, and distribution planning (storage allocation, order picking strategies, transportation mode selection etc.), as well as resource allocation. One of the most popular means for supporting tactical decisions involves the use of simulation models [4].
• For the last category of decisions, the time component becomes critical and it
is part of the problem of delivering high quality on time decisions since op-erational decisions are made on a daily basis or even in real-time. This type of decisions, such as the assignment of trucks to containers [6], the loading and unloading plans of a ship, the stacking of a containers, are customarily based on very detailed data and models which have to be executed in near real time.
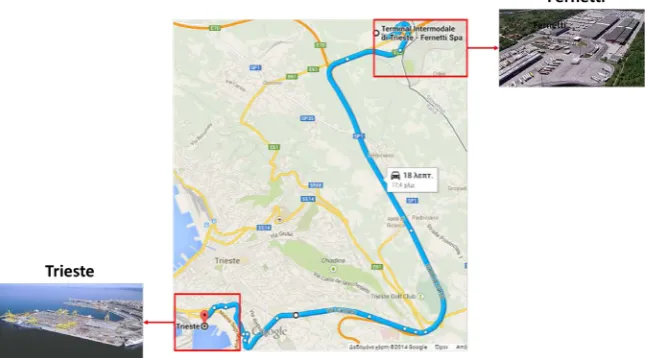
A Web based Decision Support System (DSS) was developed within the SAIL project’s goal [7] (ICT System Addressed to Integrated Logistic Management and Decision Support for Intermodal Port and Dry Port Facilities). An ICT platform was developed to support the logistic chain of goods flow, and all busi-ness operations provided in a port and a dry-port cooperative system (Trieste- Fernetti complex Figure 1) taking into consideration the fact that some typical services of the seaport are moved to the dry-port, in order to provide more space and to reduce the required service time at the port area [8].
Figure 1. The Trieste-Fernetti geographic configuration.
other hand the limited capability of this particular port, which led to the estab-lishment and growth of the dry-port of Fernetti. The port of Trieste is a gateway port towards East Europe and the Balkans, being the conjunction of the trans-European Corridor V and the Adriatic Corridor. The logistic system in this area is significant and it required the exploitation of new ICT based systems to provide automatic suggestions and decisions primarily on the intermodal traffic, but also for assisting semi-long term (tactical) and long term (strategic) decisions to keep up with competition.
The examined system has a decentralized nature consisted of two interacting entities, so the test-bed itself made the web-based [9] platform an attractive solu-tion for developing this prototype. On the other hand the high complexity of the specific test-bed led to the adoption of a modular solution able to address the different needs of the involved stakeholders.
The underlying technologies engaged for building the system have already been analyzed and described in [10]. In this work, we present the overall devel-oped web-based system that coordinates and integrates all the subsystems along with a short description of the algorithmic base for each one of the decision modules that concern their most sophisticated part.
2. The Integrate System
All modern DSSs have to handle and take into consideration a vast amount of input data collected from the field. This is the case of the Web-based DSS under investigation. The main input data coming into the system is provided by com-ponents integrated with the basic decision modules:
• availability of resources,
• arrangements for the provision of services, • progress of the transfers planned,
• a module, where customers and suppliers come together to meet their needs
and availability, and where they will agree on the time and cost of service de-livery,
• a module that shows the progress of the plan (tracking): all trucks involved
will be equipped with an onboard computer that provides information of the transfer status, related to the position and integrity of containers,
• a manager of emergencies that analyzes the data and reports on the progress
of the possible abnormal situations e.g. a truck following an unusual path, stops for long time somewhere, hazard warnings by the driver etc.
• a control console: the system presents the user with all the information they
need to perform their jobs.
Such an overall framework provides all the functionalities for the distribution of data among its stakeholders, in particular this information is provided to the Web-DSS modules to feed them with correct and up to date data.
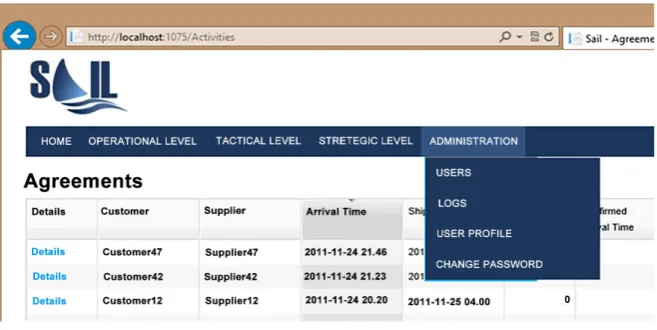
Web-DSS consists of the following main alternatives at the User Interface (UI): Home, Operational Level, Tactical Level, Strategic Level, and Administra-tion. The web application is based on a standard layout with the top dropdown menu and main work area shown at Figure 2.
2.1. Operational Level Module
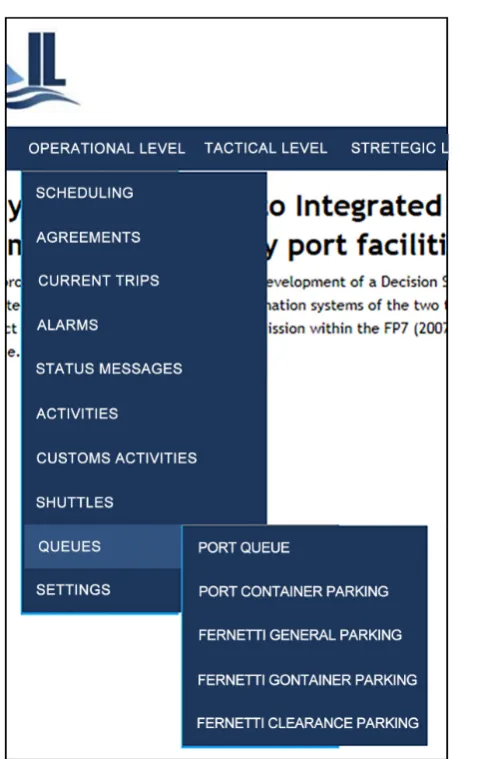
The decision support structure for the operational level refers to many different options that are depicted at Figure 3. The corresponding menu option (leaf menu elements) presents points to the page with the appropriate table/details. The menu elements, and the underlying pages are accessible only by users that satisfy Operational Accessibility authentication rule.
Once connected, the user can access the following options displayed in Figure 3. The options are described in detail in Table 1.
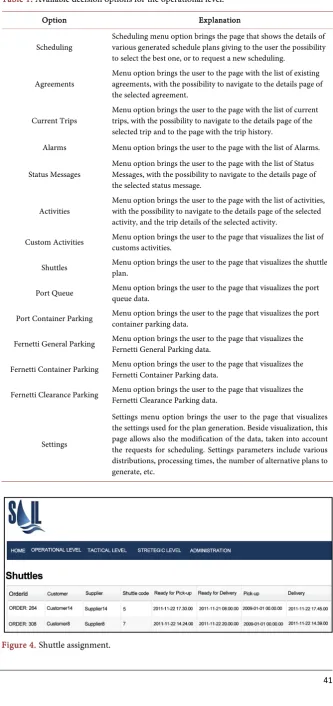
[image:4.595.209.538.554.719.2]The Operational module performs a number of operations, some of them of-fering real time monitoring of the overall system’s status, with one of the most important being the assignment of shuttles to move containers and trailers from and to the port of Trieste. The underlying module operates by feeding informa-
Figure 3. The UI options for the operational level of the web platform.
tion of the location of the available shuttles as well as the “demands” of the con-tainers-trailers entered in the system. The decision support component gathers that information and invokes a metaheuristic optimizer to perform the assign-ment [6].
The operational decisions involve the assignment of trucks provided by the Port authority to containers/trailers that need to be moved from the Port of Tri-este to the dry-port or the other way around. These decisions come from the output of an optimization process which takes into consideration the location (through RFID technology) and the availability of the trucks and the require-ments posed by the customers on the specific time windows for the pick-up and delivery of the containers/trailers. The optimization process is solved using a metaheuristic algorithm in almost real time [6]. Each time the module is invoked it loads the new RFID based positions as well as any new requests and returns an ordered list of the containers/trailers each available truck has to serve. Based on that list the truck driver picks up and delivers the assigned containers/trailers.
Table 1. Available decision options for the operational level.
Option Explanation
Scheduling Scheduling menu option brings the page that shows the details of various generated schedule plans giving to the user the possibility to select the best one, or to request a new scheduling.
Agreements Menu option brings the user to the page with the list of existing agreements, with the possibility to navigate to the details page of the selected agreement.
Current Trips Menu option brings the user to the page with the list of current trips, with the possibility to navigate to the details page of the selected trip and to the page with the trip history.
Alarms Menu option brings the user to the page with the list of Alarms.
Status Messages Menu option brings the user to the page with the list of Status Messages, with the possibility to navigate to the details page of the selected status message.
Activities Menu option brings the user to the page with the list of activities, with the possibility to navigate to the details page of the selected activity, and the trip details of the selected activity.
Custom Activities Menu option brings the user to the page that visualizes the list of customs activities.
Shuttles Menu option brings the user to the page that visualizes the shuttle plan.
Port Queue Menu option brings the user to the page that visualizes the port queue data.
Port Container Parking Menu option brings the user to the page that visualizes the port container parking data.
Fernetti General Parking Menu option brings the user to the page that visualizes the Fernetti General Parking data.
Fernetti Container Parking Menu option brings the user to the page that visualizes the Fernetti Container Parking data.
Fernetti Clearance Parking Menu option brings the user to the page that visualizes the Fernetti Clearance Parking data.
Settings
Settings menu option brings the user to the page that visualizes the settings used for the plan generation. Beside visualization, this page allows also the modification of the data, taken into account the requests for scheduling. Settings parameters include various distributions, processing times, the number of alternative plans to generate, etc.
2.2. Tactical Level Module
The application UI related with tactical level is accessible via Tactical Level menu items. Each menu option points to the page with the appropriate table/details. The Tactical Simulations menu option brings the corresponding window (ac-cessible only by the users that satisfy Tactical Accessibility access rule) that shows the list of current user’s simulations, with the possibility to add new ones, or execute/update/delete the existing ones as shown in Figure 5.
The tactical level module operates on the basis of a simulation-optimization approach. A detailed model of the system was developed in Arena [11]. Due to the stochastic nature of the simulation (simulation noise) each simulation for a specific configuration of the input parameters has to be performed more than once. At the same time, different input configurations should be executed to reach an improved, if not an optimal configuration. Due to the time consuming nature of the simulation the developed model was interfaced with a metaheuris-tic optimizer which was in turn combined with an Optimal Computing Budget Allocation (OCBA) scheme to allow for an efficient search in the parameter space [12] [13] [14].
The developed UI of the tactical level allows the user to:
• define one or more sets of input data,
• execute the tactical simulation on selected set of input data, • visualize the results of the simulation.
The execution time for tactical simulations may be some hours, but the im-plementation resolves the problems related with resource locking; it does not block the UI while the simulation is running, and at the same time limits the number of concurrent executions to only one simulation.
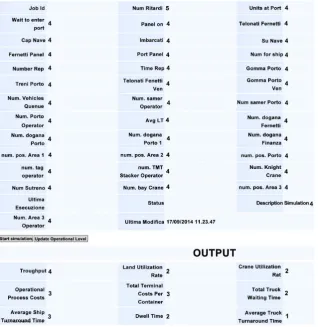
[image:7.595.229.520.509.717.2]The simulation details page shows the simulation’s input and output parame-ters (Figure 6). At this page, the user can modify the input parameters (the search range for each parameter) and the usercan re-execute the simulation.
Figure 6. The simulation parameters and outputs.
2.3. Strategic Level Module
The application UI for strategic decisions is accessible via Strategic Level menu items, which are accessible only by users that satisfy the Strategic Accessibility authentication rules. The procedure to make decisions on strategic level is either based on simulation models and/or on exploiting the knowledge and experience of experts. In our case, there was chosen an approach that is the combination of experts’ opinion with a supervision model that provides wider possibilities for the analysis i.e. it is possible to include other types of transport not currently treated in the Trieste case (e.g. collaboration with railways load), or future changes in terms of new resources (new roads, expansion or creation of new parking places etc.).
In order to gather information from experts, understand their opinions and infer their knowledge, a questionnaire based approach was adopted. The advan-tage of this approach is that the answers provided by experts can be easily treated using multicriteria analysis (MCA) [15] approaches.
The strategic level module provides to the user the following services:
• create and manage the questionnaires, • publish the questionnaires online,
the respective model built through the use of MCA techniques.
The developed approach within the SAIL project is based on a mix of two MCA techniques: the Promethee technique [16] and the Analytic Hierarchy Pro- cess (AHP) technique [17]. The Strategic module uses the standard AHP infe-rence system but adopting the Promethee comparison method in order to pro-vide a fixed criterion/alternative as reference and avoid the need to have the full set of pairwise comparisons required by the AHP.
In general, any decision-making problem involves a number of criteria and sub-criteria used to rank a number of alternatives of the decision to be made and consists of the following:
• Studying the problem. • Organizing multiple criteria. • Assessing multiple criteria.
• Evaluating alternatives on the basis of the assessed criteria. • Rank the alternatives.
• Incorporate the judgement of multiple experts.
Thus the problem can be formulated as how to derive weights for a set of ac-tivities according to their impact of the objectives of the decisions to be made. The AHP [5] has been extensively used for structuring and analyzing a complex decision and is decomposed into a number of steps:
1) Definition of a hierarchy: In order to define the hierarchy of the decision structure, the decision is decomposed into successive levels where at the top level lies the goal of the decision and as you move down you add criteria/sub criteria to each level until the last level, which is the level of the alternatives.
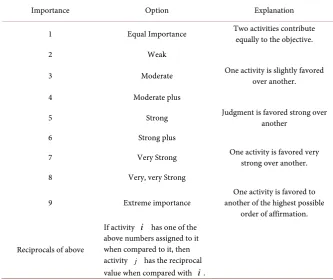
2) Decision makers provide the pairwise comparison matrices between each criterion at each level. The comparison of each level is accomplished using a scale such the one described by Table 2. Experts or decision makers rate the comparison as equal, marginally strong, weak, moderate, moderate plus, strong, strong plus, very strong, very-very strong and extremely strong, filling respective matrices/tables. These matrices are square with the diagonal elements of the ma-trices equal to 1. For example if the i-th criterion is stronger than the value of
the j-th criterion that means that the element
( )
i j, of the matrix of the com-parisons of the criterions will have a value bigger than 1; vice versa, the element
( )
i j, of the matrix will be the reciprocal of the previous value if the j-thcrite-rion is more important than the i-th criterion.
3) The principal eigenvalue and the corresponding eigenvector of the parison matrix give the relative importance of the previous criteria being com-pared.
4) The consistency of the matrix is evaluated base on a Consistency Index (CI). If this CI fails to reach a required (tolerance) level then the provided
elements (aij) for the comparisons has to be re-examined. The CI value is
calculated as: max 1 n CI n λ − =
Table 2. The scale of the analytic hierarchic process.
Importance Option Explanation
1 Equal Importance Two activities contribute equally to the objective.
2 Weak
3 Moderate One activity is slightly favored over another.
4 Moderate plus
5 Strong Judgment is favored strong over another
6 Strong plus
7 Very Strong One activity is favored very strong over another.
8 Very, very Strong
9 Extreme importance another of the highest possible One activity is favored to order of affirmation.
Reciprocals of above
If activity i has one of the above numbers assigned to it when compared to it, then activity j has the reciprocal value when compared with i.
where n is the order of the matrix of the comparisons and λmax is the
maxi-mum eigenvalue of the matrix of the comparisons. The value of the CI index is
then compared with that of a random matrix index (RI) [5]. The consistency
ratio (CR) is then defined as:
CI CR
RI
= (2)
The acceptable values of the CR index are less than 0.1, and the values of the index RI are shown below in Table 3.
5) The rating of each alternative is multiplied by the weights of the sub-crite- ria and aggregated to get local ratings with respect to each criterion. The local ratings are then multiplied by the weights of the criteria and aggregated to get global ratings.
It must be mentioned that the compilation of questionnaire is done by experts and consists ofthe specification of relative importance between different criteria and the reference criterion (chosen by questionnaire creator), and specification of relative importance between different alternatives and the reference alterna-tive (again chosen by the questionnaire creator) for each criterion/alternaalterna-tive.
The main screens involved include the definition of alternatives, the definition of criteria and the results for each user. Alternatives menu option (Figure 7) brings the page that shows the list of alternatives, with the possibility to add new ones, or update/delete the existing ones.
Table 3. The RI index for different order of the criteria matrix.
The order n of the criteria matrix RI
1 0.00
2 0.00
3 0.58
4 0.90
5 1.12
6 1.24
7 1.32
8 1.41
9 1.46
[image:11.595.207.531.91.631.2]10 1.49
Figure 7. The different alternatives.
[image:11.595.263.490.459.717.2]Figure 9. The different alternatives.
Figure 10. Defining the importance between each criterion and each alternative.
Figure 11. The alternatives sorted by the importance value.
[image:12.595.207.539.493.643.2]one reference alternative.
The sliders (Figure 10) are used as the preferable way of input, being more intuitive than the standard numeric data input.
The user after the compilation of the questionnaire can have a look at the im-portance of each Alternative and select the Alternative with the maximum prior-ity (Figure 11).
3. Conclusion
In this paper, we presented the Web-based DSS developed within the SAIL project to assist managers and operators in their demanding task of operating the port-dry port complex at Trieste. The system offers dedicated interfaces for the three different levels of required decisions (operation, tactical and strategic) with the authorized users able to log in and use the underlying modules. This is a prototype system which has been deployed for further evaluation from the in-volved stake-holders.
Acknowledgements
This work was supported by the E.U. FP7-PEOPLE-IAPP-2009, Grant Agree-ment No. 251589, Acronym: SAIL.
References
[1] Turban, Ε., Sharda, R. and Delen, D. (2010) Decision Support and Business Intelli-gence Systems. Prentice Hall.
[2] Giani, G., Laporte, G. and Musmanno, R. (2004) Introduction to Logistics Systems. Planning and Control, Willey.
[3] Parola, F. and Sciomachen, A. (2005) Intermodal Container Flows in a Port System Network: Analysis of Possible Growths via Simulation Models. International Jour-nal of Production Economics. Elsevier, 97, 75-88.
https://doi.org/10.1016/j.ijpe.2004.06.051
[4] Boschian, V., Dotoli, M., Fanti, M., Iacobellis, G. and Ukovich, W. (2010) Metamo-delling Approach to the Management of Intermodal Transportation Networks.
Transactions on Automation Science and Engineering (T-ASE) Journal, 160, 1-13. [5] Saaty, T. (1980) The Analytic Hierarchy Process: Planning, Priority Setting,
Re-source Allocation. McGraw-Hill.
[6] Georgoulas, G., Iacobellis, G., Boschian, V., Simeoni, F., Maksimovic, S., Geretto, W. and Stylios, C. (2013) Metaheuristic Approaches for Scheduling the Trieste- Fernetti Pickup and Delivery Service. Large Scale Complex Systems Theory and Applications, 13, 514-519.
[7] ICT System Addressed to Integrated Logistic Management and Decision Support for intermodal Port and Dry Port Facilities. http://www.sailproject.eu/
[8] Roso, V., Woxenius, J. and Lumsden, K. (2009) The Dry Port Concept: Connecting Container Sea Ports with the Hinterland. Journal of Transport Geography, 17, 338- 345. https://doi.org/10.1016/j.jtrangeo.2008.10.008
[9] Power, D.J. (2000) Web-Based and Model-Driven Decision Support Systems: Con-cepts and Issues. AMCIS 2000 Proceedings, 387.
Software Architecture for Integrated Logistic Management System. Proceedings of EMSS, 670-675.
[11] Kelton, D., Sadowski, P. and Swets, R. (2009) Simulation with Arena. 5th Edition, McGraw-Hill, Boston.
[12] Fanti, M., Iacobellis, G., Ukovich, W., Boschian, V., Georgoulas, G. and Stylios, C. (2015) A Simulation Based Decision Support System for Logistics Management.
Journal of Computational Science, 10, 86-96.
https://doi.org/10.1016/j.jocs.2014.10.003
[13] Boschian, V., Fanti, M., Iacobellis, G., Georgoulas, G., Stylios, C. and Ukovich, W. (2013) A Model Based Decision Support System for Logistics Management. Pro-ceedings of EMSS, 364-369.
[14] Fanti, M., Iacobellis, G., Georgoulas, G., Stylios, C. and Ukovich, W. (2012) A Deci-sion Support System for Intermodal Transportation Networks Management. Pro-ceedings of EMSS, 150-155.
[15] Triantaphyllou, E. (2000) Multi-Criteria Decision Making: A Comparative Study. Kluwer Academic Publishers, Dordrecht.
https://doi.org/10.1007/978-1-4757-3157-6
[16] Macharis, C., Springael, J., De Brucker, K. and Verbeke, A. (2004) PROMETHEE and AHP: The Design of Operational Synergies in Multicriteria Analysis: Streng-thening PROMETHEE with Ideas of AHP. European Journal of Operational Re-search, 153, 307-317. https://doi.org/10.1016/S0377-2217(03)00153-X
[17] Saaty, T. (2008) Decision Making with the Analytic Hierarchy Process. Internation-al JournInternation-al of Services Sciences, 1, 83-98. https://doi.org/10.1504/IJSSCI.2008.017590
Submit or recommend next manuscript to SCIRP and we will provide best service for you:
Accepting pre-submission inquiries through Email, Facebook, LinkedIn, Twitter, etc. A wide selection of journals (inclusive of 9 subjects, more than 200 journals)
Providing 24-hour high-quality service User-friendly online submission system Fair and swift peer-review system
Efficient typesetting and proofreading procedure
Display of the result of downloads and visits, as well as the number of cited articles Maximum dissemination of your research work
Submit your manuscript at: http://papersubmission.scirp.org/