Munich Personal RePEc Archive
How can LDCs benefit from the CDM?:
A panel data analysis of determinants of
CDM project hosting
Kasai, Katsuya
MSc in Carbon Finance, University of Edinburgh Business School,
The University of Edinburgh
August 2012
pg. 1
How can LDCs benefit from the CDM?: A panel data analysis of
determinants of CDM project hosting
Katsuya KASAI*
Abstract
The CDM plays an important role in the international GHG reduction activities. However, the distribution of CDM projects has been quite biased. Hence, considering the current distributional imbalance, this study was conducted aiming to identify the determinants of CDM project hosting in order to suggest potential measures for LDCs based on empirical evidence. By running random effects panel Tobit models, this paper sheds light on the fact that the four significant factors, GHG reduction potentials, governance levels, science and technology levels, and economic ties between host and Annex I countries in the private sector, have positive impacts on hosting CDM projects. This paper, therefore, denotes that the effective way to promote CDM activities in LDCs is to approach both sides: one is that LDCs accomplish the improvement of the significant factors by themselves; and the other is to facilitate the programmatic CDM activities by enlisting cooperation from international organisations or firms capable of investing in CDM activities in LDCs and/or providing capacity building programs. It is hoped that both Annex I and Non-Annex I countries tackle the climate change issue with stimulating the effective use of this innovative mechanism, CDM, not only in advanced developing countries but also in LDCs.
Keywords: CDM, Kyoto Protocol, LDCs, ODA, Tobit model O - Economic Development, Technological Change, and Growth
pg. 2
1. Introduction
The negotiations about climate change have been based on the scientific evidence in the IPCC Assessment Reports. The Framework Convention on Climate Change (FCCC) was adopted in 1992 with the ultimate objective that aims to stabilise GHG concentrations below a level that would prevent dangerous anthropogenic interference with the global climate system (UNFCCC, 1992). After the issuance of IPCC AR2, the Kyoto Protocol was adopted in the third session of the conference of the parties (COP3) in Kyoto, Japan. The Kyoto Protocol has imposed legally binding targets only on industrialised countries (Annex I
Parties)1 and introduced three market mechanisms, called the Kyoto Mechanism, namely
CDM (Clean Development Mechanism), JI (Joint Implementation), and IET (International Emission Trading), in order to enable economic reductions of GHG emissions (UNFCCC, 1998). The Marrakesh Accord, containing the ground rules of the Kyoto Protocol, was adopted in COP7, followed by the Bonn Agreement adopted in COP6 Part 2. Russia’s ratification of the protocol in 2005 finally made the Kyoto Protocol effective.
Following the issuance of IPCC AR4 in 2007, the necessity of reducing 50% of global GHG emissions by 2050 to meet the 2°C threshold was highlighted at COP13 held in Bali, Indonesia (Boston, 2008). Likewise, in 2009, the Copenhagen Accord, adopted in COP15, declared it was necessary to largely cut global emissions in order to limit the increase of average global temperature within 2°C. As of 12 November 2010, 140 countries have associated themselves with the Copenhagen Accord and, of these, 85 have committed to reduce their GHG emissions or constrain their economic growth up to 2020 (UNEP, 2010b). This consensus has remained consistent throughout all international conferences after COP13. While the detailed rules of the second commitment period of the Kyoto Protocol have not been determined yet, the international community, excluding Canada, Japan, and Russia, reached an agreement that secures the existence of the second commitment period in COP17 in 2011.
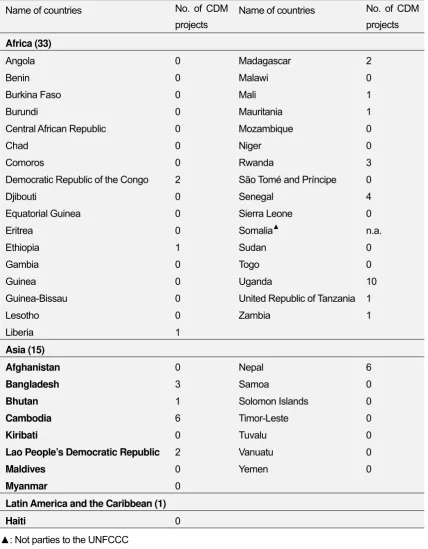
The CDM has dual objectives: to reduce GHG emissions; and to contribute to sustainable development in host countries (UNFCCC, 1998). It enables Annex I Parties to fulfil their national targets set out under the Kyoto Protocol by carrying out GHG reducing activities in eligible host countries (Non-Annex I Parties)2 instead of their own countries. Host countries can earn tradable Certified Emission Reductions (CERs) issued by the CDM executive board. The amounts of CERs are determined based on the amounts of GHG emissions reduced by CDM projects. While it is likely that the CDM has been achieving the first objective, reducing GHG emissions in a cost effective manner (e.g., Huang and Barker, 2008; Paulsson, 2009; Sutter and Parreño, 2007), several controversial issues have appeared such as an unequal distribution of CDM projects and ignorance of least developed countries (LDCs) (e.g., IGES, 2010; UNEP Riso Center, 2008) (Table 1).
1
Annex I Parties are mainly industrialised countries comprised of the members of the OECD, the European Union, and 14 countries with 'economies in transition' which are committed to greenhouse gas reduction targets. 2
pg. 3
In reality, there is an obvious and wide agreement that the distribution of the CDM projects has been quite uneven among the developing nations (e.g. Muller, 2007; Boyd et al.,
2009; Flamos, 2010). To date, 128 Non Annex countries are able to host CDM projects3
(UNFCCC, 2012b). Of the 128 countries, 53 countries have no CDM projects at all and 51 countries possess less than ten projects (UNFCCC, 2012c), whereas the numbers of registered CDM projects and projects submitted for registrations have been steadily increasing even now (Fig. 1).
Currently, there are 4,322 CDM projects across developing countries (UNFCCC, 2012b). Yet the top two emerging economies, namely China and India, possess 2,121 and 855 CDM projects, respectively as of 7 July 2012 (UNFCCC, 2012b). In other words, only two countries account for approximately 70% of total CDM projects (Fig. 2). It is certain that they benefit from receiving the tremendous amount of fund flows from the sales of CERs (Fig. 3).
In response to this imbalance in CDM project distribution, many developing nations lodged complaints against the imbalance of CDM benefits distribution on the basis of Decision 17/CP.7 of the Marrakesh Accords stipulating the necessity of the promotion of equitable distribution of CDM activities at regional and sub-regional levels (UNFCCC, 2001). This situation seems to be becoming critical as there are two conditions for the Kyoto Protocol to take effect: one is to secure the ratifications of no less than 55 countries; and the other is to secure 55% of the total GHG emissions of all developed nations at the 1990 level, regardless of the number of ratified nations (UNFCCC, 1998). If the issue were mishandled it could potentially result in the secession of many developing countries; remaining countries would be likely to criticize the effectiveness of the protocol. Therefore, this needs to be resolved to ensure equality among developing countries and to maintain stable operations of the Kyoto Protocol itself.
As the most probable cause of the unequal distribution of CDM projects, lower GHG reduction capabilities are frequently mentioned in the corresponding literature (e.g., Haites, 2004). Meanwhile, some empirical studies on the distribution of CDM projects have uncovered several decisive factors for a CDM project hosting. For instance, Flues (2010) reported that the number of CDM projects is explicitly influenced by factors categorised into three groups: CDM potentials, feasibilities, and profitability. However, findings identified by previous empirical studies are based on static analysis using cross-country data.
The twofold objectives of this paper, therefore, are to: first, specify more precise and appropriate factors affecting CDM project hosting; and second, show a more appropriate route of benefits to less endowed countries from the CDM. Hence, contrary to existing literatures, this study carries out a dynamic data analysis utilising a panel data for the period between 2005 and 2010.
3
In order to host CDM projects, it is necessary for developing nations to ratify the Kyoto Protocol and set up a
pg. 4
The remainder of this paper is structured as follows: Section 2 provides a conceptual framework to be utilised for establishing empirical models to indentify the determinants of CDM project hosting and some hypotheses generated based on findings from literature review. Section 3 presents analytical methodologies and data used. Estimated results and relevant discussions are presented in Section 4. Finally, Section 5 summarises highlights and addresses environmental and development policy implications advantageous for LDCs.
2. Literature review
This section reviews the earlier literature on decisive factors of CDM project hosting. All in all, whilst many the theoretical studies have presumed and argued the determinants of CDM project hosting, the number of empirical studies based on quantitative analysis has been very limited. The major findings of existing theoretical and empirical studies are summarised in Sections 2.1 and 2.2, respectively. Based on the findings of the literature, the conceptual framework for a panel data analysis is illustrated in Section 2.3.
2.1 Theoretical studies
A growing theoretical literature has shown that the low potentials for GHG emission reductions hinder the implementation of CDM project activities in LDCs (e.g., Haites, 2004; Jung, 2006). For instance, Jung (2006) states that countries well-endowed with CDM projects had emitted a large amount of GHGs before the CDM came into effect in 2005 and, what is more, those countries seem eager to boost the number of CDM activities further on their own without investments from advanced nations. In contrast, there have been few industries emitting the vast amount of GHGs in the LDCs. The potential for launching CDM projects in LDCs is, therefore, likely to be fundamentally very low (Haites, 2004). This is because projects that produce small amounts of CERs may be judged as commercially unattractive by investors following the principle of the market mechanism (Kasai, 2012).
With respect to disputes about socioeconomic factors, Jahn et al. (2004) and Michaelowa (2007) theoretically argue that certain levels of human capital, institutional and infrastructural capacities, and financial capital availability are required to host CDM project activities. Accordingly, if host countries have higher risk premiums for CDM investors, it ought to be more appropriate and feasible for those countries to implement CDM activities unilaterally (Jahn et al., 2004). Flues (2010) alleges that, while some eligible industrialised host countries are able to adopt relatively advanced GHG reduction technologies with comparative ease, LDCs must confront considerable technical barriers for the use of those technologies due to their insufficient technological levels. Moreover, governance levels can be regarded as one of determinants in theoretical literature as effective goverance is needed to facilitate CDM activities due to its complex procedures. For instance, Olawuyi (2009) implies that the gaps in economic, social and administrative conditions among developing countries directly and powerfully affect the attractiveness of CDM host countries.
pg. 5
conditions, and social conditions are thought to play important roles in promoting CDM project activities. Those factors are likely to be found as decisive factors of CDM project hosting in this paper.
2.2 Empirical studies
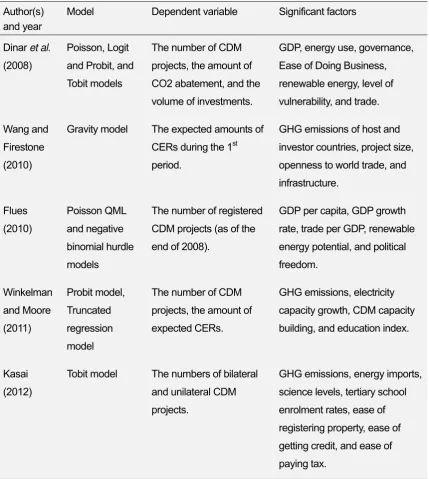
Previous empirical research papers applied various analytical methods and their results have been mired in controversy on occasion. Compared to theoretical studies, the number of empirical studies on the distributional issue is limited and are chronologically explained in the following paragraphs and summarised in Table 2. This data helps to describe the appropriateness and effectiveness of a conceptual framework and the selection of methodologies that appear later in this paper.
First of all, Dinar et al. (2008) carried out an empirical study that focused on identifying significant factors influencing the levels of cooperation between host and investor countries. They hypothesised that theories of international relations (i.e., FDI inflows and trade) play roles in the promotion of CDM activities and thus applied theories of international economic activities as mentioned above. As a result, their analyses using four models (Poisson, Logit, Probit, and Tobit models) identifies several significant factors for the levels of cooperation in CDM project activities: economic development; institutional development; the energy structure; levels of vulnerability to climate change impacts; and relationships between the host and investor countries. Finally, they emphasised the importance of simplifying regulations and registration processes regarding the CDM towards a CDM reform, improving the governance levels of host countries, and strengthening economic activities between host and investor countries.
Similarly, Wang and Firestone (2010) analysed the determinants of the amount of CERs using a gravity model based on an international trade theory. Consequently, the study demonstrates that the domestic GHG emission levels of both host and investor countries are the primary determinant of CDM project hosting, which is consistent with their hypotheses. The regression result also indicates that the degree of openness to international trade, infrastructure, and project sizes are significant determinants. Based on their findings, Wang and Firestone (2010) speculated the importance of technical support and official development assistance (ODA) from advanced nations in the context of improving infrastructure in host countries.
pg. 6
differences in the size of coefficients between the determinants of bilateral and unilateral
CDM projects.4 Ultimately, Flues (2010) concluded that the CDM is not a promising
mechanism for LDCs, noting the need of financial assistance from GEF (Global Environmental Facility)5 to LDCs.
Subsequently, Winkelman and Moore (2011) investigated the determinants of CDM projects and CERs distributions using Probit and truncated regression models, respectively. The study differs from the past studies in terms of the selection of independent variables and the scope of a dependent variable. The Probit model covered 115 eligible host countries, excluding developing countries that have not established DNAs yet as it is technically impossible to host CDM projects without establishing a DNA. As a result, the study confirms that GHG emissions, electricity capacity growth rates, CDM capacity building, and educational levels have positive and significant effect on both the number of CDM project hosting and the amount of CERs. Meanwhile, institutional index and FDI inflows are statistically insignificant different from their expectations. Lastly, Winkelman and Moore (2011) pointed out that their findings proved the inevitability of poor opportunities of developing CDM projects in LDCs.
In the most recent empirical research paper on the CDM imbalance issue, Kasai (2012) also attempted to identify the determinants of CDM project hosting using Tobit model. Following the study conducted by Flues (2010), the study adopted dependent variables of registered unilateral and bilateral, including multilateral, CDM projects. Independent variables used were categorised into four categories: GHG reduction potentials, human capital, business environment, and links to advanced nations. The study particularly focused on two factors, namely the qualities of business environment and scientific levels in host countries. Consequently, the study finds that three factors relevant to business environment and scientific levels in eligible host countries using proxies of sub-indices of Ease of Doing Business Index and the number of scientific and technical journal articles. Kasai (2012)
mentioned that LDCs would be better off considering using programmatic CDM6 with
emphasis on the need of capacity building programs by international organisations.
2.3 Conceptual framework
This section describes a conceptual framework which is structured based on the findings of existing papers and further hypothetical theories. This framework guides the selection of
4
Bilateral CDM projects are the standard form of CDM projects involving Annex I Party and a host country. Projects involved more than one Annex I Parties are called multilateral CDM projects, though, in this article, bilateral projects include multilateral projects for convenience. Unilateral CDM projects are projects embarked by a host country independently without the participation of Annex I Parties at the time of registration. 5
The GEF is the world’s largest international fund which grants funds and technical support to help developing countries tackle global environmental issues. It also performs as a financing mechanism for the Framework Convention on Climate Change, etc.
6
pg. 7
dependent and independent variables used in analytical models of this study. As can be seen from Fig. 4, independent variables used in this study are categorised into four groups and chosen based mainly on the aforementioned findings of existing theoretical and empirical studies.
To begin with, this study decided to utilise a dependent variable of the number of registered CDM project activities. When considering the amount of cash flows stemming from CER sales to host countries, the amount of (expected) CERs generated by CDM project activities should be used as a dependent variable. This study, however, chose the number of CDM projects because the objective of this paper is to make realistic suggestions that enable LDCs to embark upon CDM project activities even with small scale projects. Further, it is not really feasible to adopt CERs in this case since the amount of CERs is heavily distorted by the stage of industrial development of a host country, meaning that there are few chances for LDCs owing to lower industrial levels. In fact, as can be seen from Table 3, only advanced developing countries have possessed CDM projects thereby generating a larger amount of CERs by reducing GHGs with higher global warming potentials (GWPs) (see
Appendix I) such as HFCs, PFCs, and SF6. The CERs generated from such productive
projects have been widening the gap between advanced host countries and other potential host countries including LDCs, which was a controversial issue at early stage of the CDM (e.g., Hourcade and Toman, 1999).
With regard to independent variables, this study adopts four categories of independent variables against the dependent variable, the number of registered CDM projects, based on the consideration of findings in past literature. AsFig. 4 shows, four categories are: GHG reduction potentials; socioeconomic factors; human capital; and links to advanced countries, each of which contains one to three independent variable(s) in order to explain the number of CDM projects. For the sake of carrying out more valuable analysis, independent variables are thoroughly selected taking into account the importance, proprieties, and data availabilities of those variables to build better panel data sets in long format. The independent variables adopted in each category and their expected effects are shown in Table 4.
The reasons of the selection of independent variables and hypotheses derived from controversial and/or inadequate points in the earlier researches are illustrated in the following paragraphs.
GHG reduction potentials
pg. 8
the most significant contribution to global warming, as a proxy for GHG reduction potentials in accordance with the findings of previous studies.
Socioeconomic factors
A mainstream perspective in the theoretical literature has argues that socioeconomic factors are important for hosting CDM projects. It has been maintained that conditions of economic, political, governance, and infrastructure have influence to attract CDM investors. This study adopts three independent variables regarding socioeconomic factors: GDP per capita; governance effectiveness; and the control of corruption.
Independent variables explaining economic conditions in host countries are confirmed as significant determinants of CDM project hosting in two empirical studies conducted by Dinar et al. (2008) and Flues (2010) which utilised the variables of GDP and GDP per capita, respectively. These findings are consistent with the theoretical literature and are reasonable considering the fact that GHG emission levels and GDP levels are highly correlated (e.g., a correlation coefficient between GHG emissions and GDP in 2009 = .961). This study judges that GDP per capita is a better variable than GDP because GDP per capita can decrease the population gap among eligible host countries and capture their real economic conditions more appropriately. GDP per capita, thus, is selected as a proxy of an economic status in this study.
As one of many factors explaining socioeconomic conditions, a growing theoretical literature has explained that governance levels in host countries matter to attract CDM investors (e.g., Jahn et al., 2004; Michaelowa, 2007). This argument is supported by one empirical literature (Dinar et al., 2008) which analysed factors affecting the cooperation levels between developing and developed countries in terms of the CDM. Alternatively, the other empirical study carried out by Winkelman and Moore (2010) reports the insignificance of institutional index come from World Governance Indicators (WGI)7. The significance of governance levels, thereafter, needs to be further assessed to figure out its real influence on CDM activities. This study, thus, employs an independent variable of governance effectiveness sourced from WGI. The first hypothesis is formulated here as shown below: H1: When eligible host countries have better governance capacity, they possess more CDM projects.
Another factor that may or may not influence in promotion of CDM activities is corruption. As it is often assumed in the literature on developing economics (e.g., Gupta et al., 2002; Mauro, 1995), the corruption is likely to be a major factor responsible for income inequality and poverty in developing nations, lowering the probability of the implementation of CDM projects. The mechanism that causes inequality of CDM project distribution seems to be similar to that of income inequality. Therefore, this paper attempts to test the impacts of
7
pg. 9
corruption on CDM project hosting using one of indicators of WGI, control of corruption.
Human capital
Theoretically speaking, human capital must be one of significant factors promoting CDM project activities (e.g., Michaelowa, 2007). The diversity of views, in fact, can be found in the empirical literature. On the one hand, Winkelman and Moore (2011) show that educational index, which is one of components of the Human Development Index (HDI) created by UNDP, is positively and statistically significant. On the other hand, Wang and Firestone (2010) were not able to observe the significance of general educational level using an independent variable of tertiary education percentages obtained from the Global Competitive Report. These contradicting findings are to be assessed in this study. As is often argued in the literature, when considering hosting CDM project activities, it must be important for host countries to secure qualified personnel in general. This is because developing and managing CDM projects are complex tasks which require persons in charge of CDM activities to correctly grasp complicated regulations, procedures, methodologies, tools, and so forth.
Taking into account the implementation of CDM project activities in reality, what host countries particularly require is personnel familiar with scientific knowledge as CDM projects reduce GHGs normally using scientific and technical methodologies. Such abilities may not be necessarily important if project participants (PPs) from Annex I countries were fully in charge of writing project design documents (PDDs), validations and verifications carried out by designated operational entities (DOEs)8, and actual implementation of CDM projects. Having said that, PPs in host countries must need to manage CDM projects after starting operations of CDM projects, including not only stable operations but also monitoring the amount of GHGs reduced by CDM projects. Thus, science and technology levels of host countries still seem to matter. Based on the above discussions, this study formulates the second hypothesis (H2) as follows:
H2: Scientific and technical levels foster the implementation of CDM project activities. To summarize, this study uses two independent variables related to human capital: tertiary school enrolment rate; and the number of scientific and technical journal articles. This follows the study carried out by Kasai (2012) which reveals the significance of those two factors.
Links to advanced countries
In addition to host countries’ endogenous factors, given that CDM is a mechanism basically to be implemented by PPs in both host and investor countries, holding strong links to advanced countries should increase the probability of investment in CDM projects (Flues,
8
pg. 10
2010).
An empirical literature (Dinar et al., 2008) demonstrates the importance of tighter links to advanced nations using an independent variable of total trade (the sum of the volume of bilateral imports and exports) between the host and investor countries. On the contrary, whilst Flues (2010) attempted to confirm the significance of links to advanced nations using a dummy variable of colonial status, which indicates 1 if countries were the former British, Spanish, Dutch, German, and French colonial counties; 0 otherwise, the result fails to demonstrate it. Also, another empirical literature (Wang and Firestone, 2010) shows insignificant results on common colony dummies. Considering this result, this study adopts a revised colonial dummy, which is 1 if countries were in the British colony in the past; 0 otherwise. This revision is based on the fact that the U.K. is the largest CDM investor in the world. As can be seen from Fig. 5, Spain, the Netherlands, Germany, and France have had limited influence in CDM markets. This study thereby hypothesizes that:
H3: Former British colonies have retained a strong connection to the U.K. (a leading CDM investor) and, due to the connection, have received a certain amount of investment in CDM.
In addition to the revised colonial dummy, this study utilises two more independent variables as proxies of links to advanced countries, namely foreign direct investment (FDI) inflows and ODA received. This is because both factors can be thought to be good indicators for relationship between host and developed countries as explained in the following paragraphs.
Looking at FDI inflows, there is a contradiction amongst the existing literature. On the one hand, a theoretical literature (Jung, 2006) states that host countries having abundant FDI inflows tend to host larger number of CDM activities. Moreover, Dinar et al. (2008) insist that the CDM can be regarded as a sort of FDI. On the other hand, when looking at the result of an empirical study (Winkleman and Moore, 2011), it shows insignificance of FDI inflows though it adopted as a proxy of business environment. Further, Niederberger and Saner (2005) keenly refute the effects of FDI inflows on CDM investment based on the fact that some countries having failed to induce FDI have actually succeeded in hosting CDM projects. This study attempts to verify whether or not FDI inflows has significant impacts in promoting CDM activities since, as discussed above, the results regarding FDI are not identical in previous literature. The fourth hypothesis, thus, is formulated here as follows: H4: The larger the FDI inflows eligible host countries receive, the more CDM projects they are able to host.
pg. 11
3 Methodology and data
3.1 Methodology
This study attempts to identify decisive factors of CDM project hosting by using, not only cross-section analysis, but also a panel data analysis which never before undertaken. There are two major obstacles to the estimate panel data: first, is its complexity of data analysis; and, second, the limited data availabilities. A panel data analysis requires a lot of data collected from both time series and cross-section dimensions. In contrast, according to Kitamura (2006), this feature can bring four major advantages: firstly, precisions of regression results improves due to its increased observations; secondly, differences in individual countries, for this study, can be captured as fixed effects; thirdly, behaviours of countries can be depicted as they are affected by economic situations or policies; and fourthly, the influence of outliers or errors can be weakened. Hence, although some restrictions occur in selecting variables, this paper utilises panel data analysis in addition to multi-year cross-section data analysis.
More specifically, this paper adopts Tobit models as primary estimators, which was developed by Tobin (1958). Data of independent variables are available for all eligible host countries including countries not hosting CDM projects. The data set, thereafter, can be regarded as censored data in which any negative values of dependent variables are set to a lower bound of zero. Hence, Type I Tobit model (censored regression model), defined by Amemiya (1984) described below is used for cross-section analysis.
∗ x β , ~ Normal 0, σ y∗ ∗ 0
0 ∗ 0
where y∗ is a latent response variable of individual i, x is an independent variables of individual i, and is a residual of individual i. The latent variable y∗ satisfies the classical linear model assumptions that have a normal and homoscedastic distribution with a linear
conditional mean. An observed variable is equal to ∗ when ∗ 0, but y equals 0
when ∗ 0. Since ∗ is normally distributed, has a continuous distribution over
strictly positive values.
With regard to panel data analysis, as mentioned above, panel Tobit (random effects) estimators are employed. Moreover, panel OLS models (fixed and random effects) are utilised for robustness checks using an uncensored data which is created by excluding observations with no CDM projects. The panel Tobit estimator is described as follows:
∗ β , , ~ Normal 0,
y∗ ∗ 0 0 ∗ 0
where ∗ represents a latent variable of individual i at time t. is a vector of
independent variable of individual i at time t. is an error term of individual i at time t,
pg. 12
unobserved time invariant individual effects which measures unobserved individual
heterogeneity. Lastly, is an unobserved time variant errors which is assumed to be
normal distribution as described in the equation above. However, if is influenced by
unobserved independent heterogeneity, the assumption which is iid normal distribution
cannot be maintained, meaning that the unobserved characteristics of individual countries have significant impacts on the number of CDM project hosting. For instance, the level of motivation towards CDM activities might be unobserved characteristics significantly affecting the number of CDM projects. Theoretically speaking, it is reasonable to simulate that such factor and unobserved heterogeneity exit. This problem can be resolved by making use of the proxy of an unobserved factor, although the variable of such factor is not available in reality. This is the reason why the panel Tobit model contains additional equation,
. In other words, is the proxy of an unobserved characteristic of host countries. The unobserved effects, , is assumed to be either fixed or random effects. Fixed effects
imply that is correlated with the observed variables. On the contrary, a random effect
means that is not correlated with any of the observed variabels in the model. When considering applying this model to this study, since the Tobit model is a non-linear model, it is technically impossible to utilise the fixed effects estimator (Wooldridge, 2002).
In order to observe the variation of the regression results and to capture the effect of each factor separately, this study forms six specifications. The main model (Spec 6) contains eight independent variables following the conceptual framework as shown below:
2
where
lncdmit: the log of the number of registered CDM projects of country i at time t;
lnco2it-2: the log of CO2 emissions of country i at time t with a two-year lag;
govefit-2: governance effectiveness of country i at time t with a two-year lag;
corrupit-2: control of corruption of country i at time t with a two-year lag;
lntertiaryit-2: the log of tertiary school enrolment rate of country i at time t with a two-year
lag;
lnarticleit-2: the log of the numbers of scientific and technical journal articles of country i
at time t with a two-year lag;
lnfdiit-2: the log of FDI inflows of country i at time t with a two-year lag;
lnodait-2: the log of ODA received of country i at time t with a two-year lag;
colony: the former British colony dummy.
pg. 13 3.2 Empirical strategy
This study utilises cross-sectional Tobit models, pooled and random effects panel Tobit models applying robust standard errors owing to heterogeneity of error terms.
Additionally, this study runs pooled and panel OLS (both fixed and random effects) models applying robust standard errors to check the robustness of the results of the panel Tobit models. For that purpose, a new data set is created by excluding all samples with no CDM projects. Whilst there must be a selection bias in the OLS estimators, the result of those estimators ought to show similar signs and coefficients to those obtained from the panel models with random effects.
In summary, a procedure of the methodology which expresses a strategy of this paper is illustrated in Fig. 7 as follows:
3.3 Data descriptions
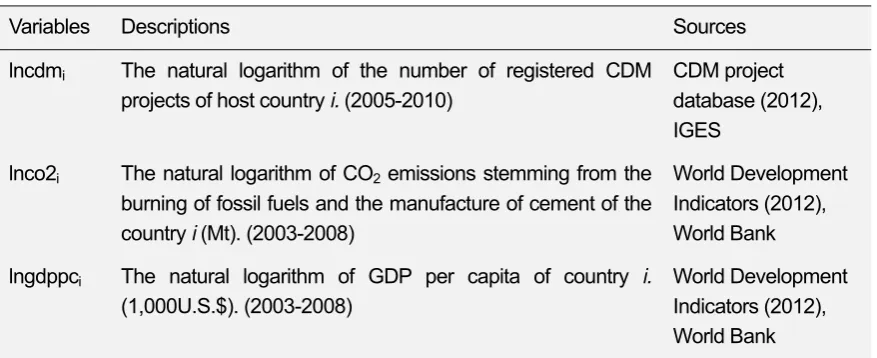
This section explains definitions, units, data sources and their validities to be used in the econometric models of all data used in this study. Both dependent and independent variables are thoroughly selected based on the conceptual framework and derived from various data sources. Some data are processed and transformed in logarithmic form for the purpose of empirical analysis. Definitions, units and data sources of both dependent and independent variables are listed in Table 5.
Dependent variables used in this study are the log of the numbers of CDM projects registered in 2005 to 2010 which are sourced from the CDM project database created by the Institute for Global Environmental Strategies (IGES, 2012). The selection of a dependent variable is in accordance with that of Flues (2010) and Kasai (2012) which is likely to be more feasible than others, such as all Non-Annex I countries, since it is technically impossible for developing countries to host CDM project activities without the DNAs. To identify more appropriate estimation results, those countries that have not established the DNAs should not be included in the analysis. The econometric models cover 128 eligible host countries which have ratified the Kyoto Protocol and established the Designated National Authority (DNA)9.
Independent variables are obtained from various data sources as shown in Table 5. As discussed in the previous section, two-year lags are set for all independent variables except for colony dummy. As a result, those two-year lagged independent variables consist of data between 2003 and 2008. There are some missing values in the independent variables because of the data availabilities. In the case that a missing value can be reasonably estimated by taking the average between adjacent years’ data, the average value is inputted in the data set as an instant solution. Essentially , it can be predicted that those deficits are unlikely to have crucial impacts on the regression results since the number of them are limited and, moreover,
9
pg. 14
most missing values stems from eligible host counties which do not host any, or just a few, CDM projects.
In line with the conceptual framework of this study, independent variables are carefully and comprehensively selected. All of them are categorised into four categories as shown below:
lncdmi = f ( Gi, Si, Hi, Li )
where the dependent variable, lncdmi is the log of the number of registered CDM projects of
host country i. Si, Hi, and Li stand for the sets of characteristics of the host country i relevant
to GHG reduction potentials, socioeconomic factors, human capital and links to advanced countries, respectively.
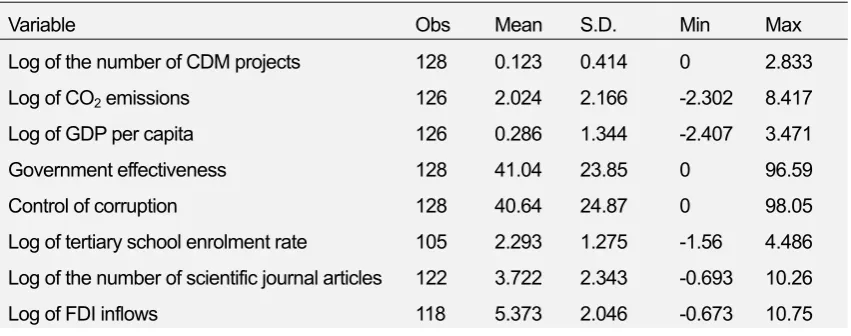
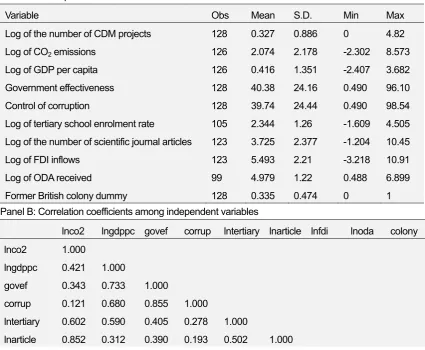
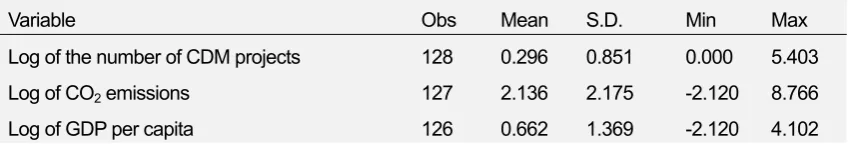
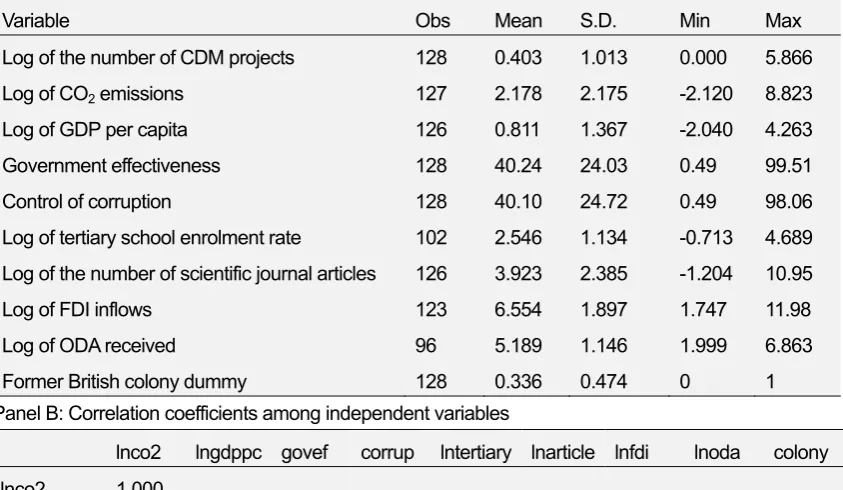
Descriptive statistics of both dependent and independent variables and correlation coefficients among independent variables with cross-section data sets are shown in Tables 6 to 11 (2005 to 2010). Those of a panel data set are shown in Table 12 (2005-2010). Those of an uncensored panel data set, excluding all observation of countries that host no CDM projects, are shown in Table 13 (2005-2010). Furthermore, scatter diagrams indicating the relationships between dependent variables and independent variables of the panel data set are shown in Fig. 8. The following paragraphs provide the explanations of those sets of independent variables by category.
GHG reduction potentials
This study adopts the log of CO2 emissions as a proxy of GHG reduction potentials, although
it is desirable to use GHG emission data consisting of six GHGs as other studies have (e.g., Wang and Firestone, 2010; Winkelman and Moore, 2010). The reason for this is because this study treats a panel data set differing from other literatures. Historical emission data of CH4,
N2O, HFCs and PFCs have not been regularly collected. Only CO2 emission data is available
from 2003 to 2008 consecutively. This paper considers that GHG reduction potentials can be measured using CO2 emissions as it accounts for around 80% of total GHG effects utilising
data originating from World Development Indicators.
Looking at CO2 emission data, there is a clear upward trend across the all eligible host
countries. The average increase rate is approximately 27% during the five-year period. Furthermore, there is an obvious trend that major CDM host countries have larger amounts of CO2 emissions in the five-year period.
Socioeconomic factors
This study adopts three independent variables in this category: the log of GDP per capita, government effectiveness and control of corruption.
pg. 15
differently if per capita base GDP is used because the larger economies in terms of GDP levels very often have larger populations. This trend can be observed in the data of GDP per capita (2003-2008) which are sourced from World Development Indicators. Aside from that, the eligible host countries’ entire increase rate of GDP per capita during the five-year period is approximately 45%.
Secondly, following a finding of Dinar et al. (2008), government effectiveness and control of corruption are adopted in this study as proxies of important social factors in eligible host countries. The data of government effectiveness and control of corruption cover the period from 2003 to 2008 and originate from Worldwide Governance Indicators. In general, good governance is likely to help in promoting CDM activities. Roughly speaking, there is a wide gap in the average percentile ranks between LDCs and other eligible host countries. For instance, the average percentile rank within LDCs in 2010 is about 24, and on the one hand, that within non-LDCs is around 48, on the other. Likewise, control of corruption measured in a percentile rank has an obvious gap. While the average percentile rank among LDCs is approximately 29, non-LDC countries’ average percentile rank is around 49. From this difference, it is possible to regard corruption as one of deterrents for the development of CDM project activities.
Human capital
In this category, there are two independent variables: the log of tertiary school enrolment rate and the log of the number of scientific and technical journal articles. The data of both variables from 2003 to 2008 are derived from World Development Indicators.
The log of tertiary school enrolment rate is adopted to investigate whether the entire educational levels have significant effects on CDM activities in accordance with two empirical literatures written by Kasai (2012) and Winkelman and Moore (2011). In addition to that, this study focuses on science and technology levels of host countries. The number of scientific and technical journal articles being published from host countries is a good predictor for the levels. The second variable, the proxy of science levels of eligible host countries, is important as to have qualified personnel familiar with scientific and technical knowledge can facilitate the development of CDM projects. Seemingly, the data set indicates a strong tendency for countries who have published many science and technology articles to host more CDM projects.
Links to advanced countries
Three independent variables are designated in this category. Links to advanced countries must be one of the key factors in order to improve economic situations because advanced nations have sufficient abilities to invest in developing countries in terms of both funds and human capital.
pg. 16
conceptual framework, two studies used this independent variable and they present opposite results. This study anticipates that the estimation result for FDI inflows shows positive sign and significant influence in promoting CDM activities. Secondly, this study utilises the log of ODA received as a proxy of cooperation levels in the governmental sector. Certainly, both variables mentioned above can be regarded as variables associated with economic conditions, as the GDP per capita levels are affected by the two variables; this study uses them to measure the levels of links to advanced nations. Based on the trends shown in scatter diagrams in Fig. 8, it is evident that FDI inflows are highly correlated with the number of CDM projects (e.g., ρ=.953 in 2008). In contrast, there is no strong relationship between the CDM activities and ODA.
Thirdly, this study uses a dummy variable which indicates 1 if countries were the British colonies in the past; 0 otherwise. As discussed in the conceptual framework, the U.K. is the leading CDM investor and thus this paper expects that the U.K. invest in the former British colonies due to strong connections amongst them. Of 128 eligible host countries, 43 are the former British colonies.
4 Results and discussions
In this section, estimation results are reported and discussed. Firstly, Section 4.1 presents the results of cross-section data analyses. Secondly, the main results derived from the random effects panel Tobit models are examined and five hypotheses formulated in the conceptual framework are verified in Section 4.2. Finally, the results of robustness checks for the main model (the panel Tobit with Spec 6) are confirmed in Section 4.3.
4.1 Cross-country data analyses
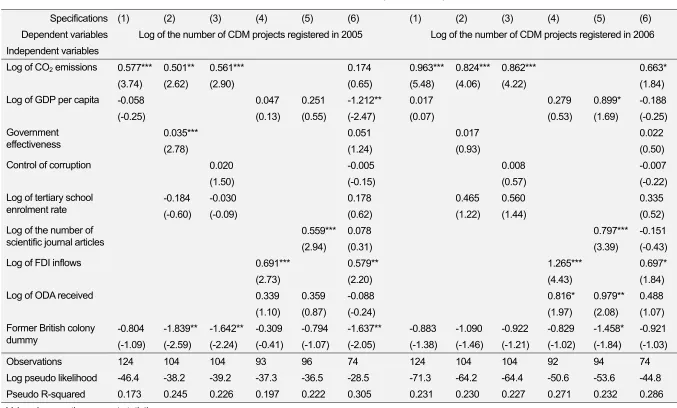
This study analysed cross-country data using Tobit models as a first step. The regression results for the years from 2005 to 2010 are shown in Tables 14 to 16.
Looking at log pseudo likelihood values, the main specification (Spec 6) fits the data sets of every year much better than other specifications, ranging from -44.8 in 2006 to -14.7 in 2010. Spec 6 has the highest pseudo R-squared value among six specifications throughout the period, representing the best fit for the Tobit models as well, ranging from .286 in 2006 to .741 in 2010.
The majority of the estimation results indicate the same signs and significance levels throughout the period. Specifically, the log of CO2 emissions is positive and statistically
pg. 17
British colony dummies clearly denote significant negative impacts on CDM project hosting. Of 36 models, 11 are statistically significant and negative, contrary to the expectation of this study. As for control of corruption, it indicates significant positive effects at the maximum limit, the 10% significance level, in Spec 3 in 2007. This is the only model showing significance and all other models result in insignificant.
As can be seen from Tables 14 to 16, the remaining independent variables, namely the log of GDP per capita, the log of tertiary school enrolment rates, and the log of scientific and technical journal articles, have both statistically significant positive and negative effects on hosting CDM activities. Their effects, therefore, are less clear and, as a result, their real effects cannot explicitly be judged by looking merely at the estimation results of cross-section data analyses. One possible reason for this is the smaller size of observations (e.g., the numbers of observations in Spec 6 range from 69 to 72) which make regression results less reliability. In addition, the multicollinearity is causally-related to the unstable estimation results. These problems are discussed in the next section which explains the results of panel Tobit models, the main analysis in this study.
Sensible time series variances cannot be observed from the estimation results with the exception of a trend that coefficients of the log of CO2 emissions have been soaring year by
year from .663 in 2006 to 1.964 in 2010. This is likely to imply that more and more CDM investors tend to focus on GHG reduction potentials rather than other factors in the light of projects’ profitability.
4.2 Panel data analyses
This section discusses the regression results of pooled and panel Tobit models with random effects. The estimation results are shown in Table 17. As stated in the methodology section, the panel data analysis enables the identification of more reliable decisive factors owing to its larger size of observations. In fact, the number of observations for the main panel Tobit model (Spec 6) is 433, which is six times larger than that of cross-country data. Hence, it can be expected to obtain more accurate estimation results.
When looking at the results of Wald tests,those in all specifications are significant, Prob > chi2 is 0.000, rejecting the null hypothesis and this means the models have explanation power at the 1% significance level. Thus, the results support the potencies of coefficients computed by the random effects Tobit estimators. Analogous to the cross-sectional Tobit models, the panel Tobit model with Spec 6 is the most appropriate model in terms of a fit to the model since the value of the log pseudo likelihood of Spec 6, which is -181.1, is the largest among six specifications.
The estimation results are examined by category in the following paragraphs.
4.2.1 GHG reduction potentials
pg. 18
2012).
As can be seen from Table 17, the log of CO2 emissions is statistically significant and
positive at the 1% significance level for all specifications as expected and the pooled Tobit models have the same results as well. This is obviously likely to illustrate the difficulty of hosting CDM project activities for LDCs, because the potentials of launching CDM projects in LDCs is low as there ordinarily exists few facilities emitting a volume of GHGs in those countries (e.g., Haites, 2004). Unsurprisingly, CDM investors would prefer to invest in eligible host countries with larger GHG reduction potentials following the principle of the market mechanism. Additionally, it must be important for host countries to have modest GHG abatement costs to attract CDM investors (e.g., Flues, 2010). By further extension, the results seem to imply that levels of economic development influence the number of CDM projects as economically well developed countries should have succeeded at industrialisation, which is the most common cause of being major GHG emitters. More importantly, the results seem to reveal that industrially well developed countries receive a larger amount of CDM benefits (CER sales). This is due to higher potentials to implement CDM projects generating a number of CERs by reducing the emissions of GHGs having higher GWPs such as HFCs, N2O, and SF6.
To sum up, this study regards GHG reduction potentials as one of the important determinants of CDM project hosting. This finding is fully consistent with the expectations of this study and those of previous studies. GHG reduction potentials are solely determined by past GHG emission performances and cannot be controlled afterwards. It sounds imbalanced that those countries that have emitted a vast amount of GHGs can easily enjoy benefits from CDM despite the fact that they have stronger responsibilities for global warming.
4.2.2 Socioeconomic factors
Three independent variables, namely the log of GDP per capita, government effectiveness, and control of corruption, are the socioeconomic factors that are expected to have positive effects on CDM project hosting. However, their individual results are not identical and some are inconsistent with findings of previous studies.
pg. 19
some empirical studies confirm its positive effects (Dinar et al., 2008; Flues, 2010). This may be attributable to the impacts of major CDM host countries which have relatively lower GDP per capita derived from their huge population sizes. This study, therefore, concludes that GDP per capita levels cannot directly be thought of as a determinant of CDM project hosting but it must have positive impacts indirectly.
Governance levels measured by an indicator of government effectiveness are significant and positive in all specifications at the 1% significance level. This result is in accordance with a finding of the study carried out by Dinar et al. (2008). In contrast, this study cannot observe the significance of control of corruption which is a proxy of the degree of corruption in eligible host countries. Certainly, multicolleniarity occurred in the panel Tobit model with Spec 6 owing to a strong correlation between government effectiveness and control of corruption, .839. Yet, since the variable also is insignificant in Spec 3, this study judges that control of corruption is not statistically significant, whilst this finding is inconsistent with the finding of literatures associated with development economics (e.g., Gupta et al., 2002; Mauro, 1995).
Based on the regression results, acquiring effective governance levels is likely to help promote CDM project activities. This study, however, implies that clean governance is not absolute necessity in so far as the governments are effective enough. Consequently, the first hypothesis below is proven here.
H1: When eligible host countries have better governance capacity, they possess more CDM projects.
Correct
4.2.3 Human capital
In line with the study carried out by Kasai (2012), this study employed two independent variable concerning human capital: the log of tertiary school enrolment rates adopted as a proxy of general educational levels, and the log of the number of scientific and technical journal articles which is a proxy of science and technology levels of host countries.
As Table 17 shows, contrary to this study’s expectation, the log of tertiary school enrolment rates is found to be insignificant in all specifications under both pooled and panel Tobit models, though signs are positive in most specifications. This result differs from the findings of the existing literatures (Kasai, 2012; Winkelman and Moore, 2011). However, the results of panel Tobit models are thought to be more reliable than the previous findings. This is because the results of this study are generated from a dynamic analysis using a larger size of observations.
On the other hand, this study demonstrates the significance of science and technology levels at the 1% significance level in Spec 5 under the panel Tobit model. Nevertheless, the variable is insignificant in Spec 6. Due to a strong correlation between the log of the number of scientific and technical journal articles and the log of CO2 emissions, .837, the result of
pg. 20
two variables cannot be clearly captured individually.
Consequently, this study concludes that science and technology levels positively affect the number of CDM project hosting based on the result of the panel Tobit model with Spec 5. This conclusion is backed by the results of cross-country analyses, the majority of which are statistically significant and positive. Moreover, this finding is rational as it is imperative for CDM developers to grasp technical aspects of GHG reduction technologies applied for CDM project activities.
Summing up, as Kasai (2012) suggested, human capital is likely to be one of crucial factors in developing CDM projects. Eligible host countries eager to promote CDM activities should improve scientific and technical levels to retain qualified personnel. Accordingly, the second hypothesis is demonstrated here below.
H2: Scientific and technical levels foster the implementation of CDM project activities.
Correct
4.2.4 Links to advanced countries
To host CDM project, links to advanced countries must be one of material factors as CDM projects are usually developed by PP(s) in host countries in cooperation with PP(s) in Annex I countries. This category comprises of three independent variables: the log of FDI inflows; the log of ODA; and the former British colony dummy.
Firstly, this study finds that the former British colony dummy has statistically significant negative impacts on CDM project hosting differing from the expectation. The majority of estimation results of cross-country analyses and pooled Tobit show the same impacts. This is consistent with the study carried out by Wang and Firestone (2010). The adverse effects of the former British colonies seem to allude to the fact that CDM investors in the U.K. do not lay weight on colonial ties but focus mainly on profitability of projects (larger GHG reduction potentials). This tendency must be attributed to the nature of CDM, which in turn can be thought of as one of flaws that needs to be addressed. Given the above discussions, while this study cannot verify whether or not the former British colonies have strong ties with the U.K., it reveals that the former British colonies host less CDM projects. Therefore, the third hypothesis below is refuted by the analytical results.
H3: Former British colonies have retained a strong connection to the U.K. (a leading CDM investor) and , due to the connection, have received a certain amount of investment in CDM.
Incorrect
pg. 21
between eligible host countries and developed countries in the private sector facilitate CDM activities. This study, therefore, regards FDI inflows as a significant determinant of CDM project hosting based on both theoretical and empirical points of views of this study. Hence, the forth hypothesis below is proven.
H4: The larger the FDI inflows eligible host countries receive, the more CDM projects they are able to host.
Correct
Lastly, the log of ODA is not significant in all specifications under panel Tobit models. This result is consistent with that of the study carried out by Kasai (2012). Although this paper generated the fifth hypothesis by expecting that the amount of receiving ODA reflects the political and/or economic closeness between developing and developed countries, the results explicitly refuted the hypothesis. The statistical insignificance of the log of ODA is likely to suggest that CDM investors act differently from their governments by following the market mechanism or other factors.
H5: Countries receiving a larger ODA tend to host a larger number of CDM projects.
Incorrect
4.3 Robustness checks
This study estimated pooled and panel OLS models with fixed effects and random effects to check the robustness of the main models, the panel Tobit models. As well as panel Tobit models, Spec 6 is the most proper model with the highest R-squared, .595. As discussed in the section of methodology, since this analysis adopted uncensored data which excludes all observations not having CDM projects, the panel OLS estimators can be expected to show similar results to the panel Tobit models.
Table 18 reports the estimation results of OLS models. Before discussing the regression results, the most preferred models have to be identified among the pooled OLS, the fixed effects panel OLS model, and the random effects panel OLS. The results of F-tests chose fixed effects models over simple pooling models by rejecting a null hypothesis assuming that individual fixed effects are absent. Next, Hausman tests reject the fixed effects models in favour of the random effects models. Accordingly, the regression results of the panel OLS with random effects are utilised to check the signs and significances of the main models. Looking at the estimation results, it appears that an entire picture is similar between the panel Tobit models and random effects OLS models. For instance, three major determinants found in the main models, the log of CO2 emissions, the log of the number of scientific and
technical journal articles, and the log of FDI inflows, are statistically significant and positive at the 1% significance level. However, a few exceptions occur. Some variables become insignificant in Spec 6 different from those of main models. These subtle inconsistencies might be caused by the different methods used in both models. Certainly, Tobit models based on maximum likelihood estimation method are innately different from the OLS method.
pg. 22
variables are insignificant differing from those of the main models, their signs are the same in most variables. Therefore, this study concludes that the robustness checks support to the main results.
5. Conclusions
5.1 Research summary
UNEP (2011) argues that reducing GHG emissions to the level that can hold a temperature rise within 2°C is technologically and economically feasible. Theoretically speaking, this might be true, but in reality, it is highly unlikely to happen. To realise this goal, it is necessary to undertake immediate and pertinent actions with the international community (UNEP, 2010b). In this context, the CDM, the world’s first innovative financial mechanism which enables the reduction of GHG emissions internationally in a cost-effective manner, was entered into force in 2005. In fact, the CDM plays an important role in the international GHG reduction activities (e.g., Sutter and Parreño, 2007).
Meanwhile, the distribution of CDM projects has been quite skewed (e.g., Muller, 2007; Boyd et al., 2009; Flamos, 2010). The majority of LDCs have not reaped benefits from the CDM, whereas the major GHG emitters, especially China and India, have been receiving a lot of fund flows from Annex I countries and various positive side effects such as technology transfers, electricity generated from clean renewable sources, and the promotion of sustainable development in their own countries. Consequently, considering the current distributional imbalance of CDM projects, this study was conducted aiming to identify the determinants of CDM project hosting in order to recommend promising approaches for LDCs based on empirical evidence.
This study employed four categories of independent variables towards the dependent variable, the log of the number of CDM projects. By running random effects panel Tobit models, this study specified five statistically significant decisive factors as shown in Table 19. At first, all independent variables were expected to show significance in regression results. However, four variables, namely GDP per capita, control of corruption, tertiary school enrolment rate, and ODA received, resulted in being insignificant. Furthermore, contrary to the expectation, it is confirmed that the former British colony dummy has negative significant effects on CDM project hosting, implying CDM investors have not utilised colonial ties for their business. Based on the empirical analysis, this paper revealed that the persisting four significant factors, GHG reduction potentials, governance levels, science and technology levels, and economic ties between host and Annex I countries in the private sector, have positive impacts on hosting CDM projects. This empirical evidence can be accepted from the theoretical perspective as well.
5.2 Policy implications
pg. 23
emission levels in the base year. LDCs, hence, should focus exclusively on factors which they can control. It is likely to be possible that LDCs can improve the levels of their governance, science and technology, and economic ties with Annex I countries by ameliorating related factors. If these were to be accomplished in reality, LDCs would have better condition prospects for attracting CDM investors.
Alternatively, taking a different perspective on a promising approach for LDCs, it seems feasible to develop the programmatic CDM. The reason for this is because, as mentioned above, LDCs have a serious disadvantage in their lower GHG reduction potentials. It is obviously not reasonable for them to simulate the major GHG emitters such as China. Currently, several international organisations have been actively trying to boost CDM activities including the programmatic CDM in LDCs and, thanks to this, the number of CDM activities in LDCs are actually increasing slowly but surely. The information of the programmatic CDM is described in Appendix II.
In summary, the effective way to promote CDM activities in LDCs is to approach both sides: one is that LDCs improve the significant factors by themselves; and the other is to facilitate the programmatic CDM activities by enlisting cooperation from international organisations or firms capable of investing in CDM activities in LDCs and/or providing capacity building programs.
5.3 Remaining challenges
The findings of this study are based on the limited data for the period between 2005 and 2010 due to data availability. It is hoped that further empirical studies will utilise data after 2011. Furthermore, it is worth applying other analytical models and/or independent variables as there might be better models and/or variables for a panel data regarding the distribution of CDM projects. More specifically, it might be interesting to add regional dummies empirical models because the significance and effects of each variable may be different from a region where eligible host countries are situated. This seems to help LDCs identify more useful and practical approaches.
5.4 Concluding statement
The CDM is a mechanism not only for alleviating the impacts of global warming but also for enhancing sustainable development in host countries, and what is more, the CDM can generate a new type of fund flows, having similar feature to subsidies. Nonetheless, the CDM has not been actively addressing the poor (Michaelowa, A. and K. Michaelowa, 2007).
pg. 24
implemented without CDM status (e.g., Lecocq and Ambrosi, 2007). Therefore, the key point here is to receive additional fund flows from richer countries using the CDM. To do this, LDCs are recommended to ameliorate the controllable significant factors that this study revealed and give positive consideration to implementing the programmatic CDM.
pg. 25
Bibliography
Amemiya, T. , 1984. Tobit models: A survey. Journal of Econometrics, 24, 3-61.
Anderson, K. and A. Bows, 2008. Reframing the climate change challenge in light of post-2000 emission trends. Philsohical Transitions of The Royal Society 366 (1882), 3863-3882.
Boston, J., 2008. Global Climate Change Policies: From Bali to Copenhagen and Beyond. Policy Quarterly 4 (1), 50-63.
Boyd, E., Hultman, N., Roberts, T., Corbera, E., Cole, J., Bozmoski, A., Ebeling, E., Tippman, R., Mann, P., Brown, K. and Liverman, D., 2009. Reforming the CDM for Sustainable Development: Lessons Learned and Policy Futures. Environmental Science & Policy, 12 (7), 820~831.
Brohan, P., J. J. Kennedy, I. Harris, S. F. B. Tett, and P. D. Jones, 2006. Uncertainty estimates in regional and global observed temperature changes: A new data set from 1850. J. Geophys. Res., 111, D12106, doi:10.1029/2005JD006548.
Christensen, J., B. Hewitson, A. Busuioc, A. Chen, X. Gao, R. Held, R. Jones, R. Kolli, W. Kwon, R. Laprise, V. Magana Rueda, L. Mearns, C. Menendez, J. Räisänen, A. Rinke, A. Sarr, P. Whetton, R. Arritt, R. Benestad, M. Beniston, D. Bromwich, D. Caya, J. Comiso, R. de Elia, and K. Dethloff, 2007. Climate Change 2007: The Physical Science Basis: Contribution of Working group I to the Fourth Assessment Report of the Intergovernmental Panel on Climate Change. Cambridge: Cambridge University Press. Dinar, A., S. Mahfuzur, D. Larson, and P. Ambrosi, 2008. Factors affecting levels of
international cooperation in carbon abatement projects. World Bank Policy Research Working Paper 4786.
Flamos, A., 2010. The Clean Development Mechanism - Catalyst for Wide Spread Deployment of Renewable Energy Technologies? or Misnomer? Environment, Development and Sustainability, 12 (1), 89~102.
Flues, F., 2010. Who Hosts the Clean Development Mechanism? Determinants of CDM Project Distribution. CIS Working Paper 53.
Goodman, J., 2009. The Changing Face of Political Ideologies in the Global Age. New Political Science, 31(4), 499-514.
Gupta, S., D. Harnid, A.T. Rosa, 2002, Does corruption affect income inequality and poverty?, Economics of Governance, 3 (1), 23-45.
Haites, E., 2004. Estimating the market potential for the CDM: review of models and lessons
learned. The International Energy Agency and the International Emissions Trading
Association, Washington DC, 71pp.
Hensel, P. R., (2006), ICOW colonial history data 0.4 [Online], Available from: <http://www.paulhensel.org/Data/colhist.zip> [27 April 2012].
Hourcade, J. C. and M. Toman, 1999. Policies for the design and operation of the clean Development Mechanism. Paper presented at the Multinational Workshop.
pg. 26
Development: A Panel Data Analysis. Working Paper, University of Cambridge 39. IGES, 2010. Towards CDM reform. Kanagawa, Japan: IGES.
IGES, 2011. New Market Mechanism in CHART Ver.15. Kanagawa, Japan: IGES.
IGES, (2012), IGES CDM project database [Online], Available from:
<http://www.iges.or.jp/en/cdm/report_cdm.html> [20 July 2012].
IPCC, 2007. Climate Change 2007: Synthesis Report. Contribution of Working Groups I, II and III to the Fourth Assessment Report of the Intergovernmental Panel on Climate Change. Geneva: IPCC.
Jahn, M., A. Michaelowa, S. Raubenheimer, and H. Liptow, 2004. Measuring the potential of unilateral CDM - a pilot study. HWWA Discussion Paper 263.
Jung, M. 2006. Host county attractiveness for CDM non-sink projects. Energy Policy, 34, 2173-2184.
Kasai, K. 2012. A cross-country empirical analysis of determinants of Clean Development Mechanism (CDM) projects. Journal of Environmental Information Science, 40 (5), 1-10. Kitamura, Y. 2006. The purpose of panel data and for its use (Panel data no igi to sono
katsuyou). Japanese Journal of Labour Studies (Nihon Roudou Kenkyu Zasshi), 551, 6-16.
Lecocq F, and P. Ambrosi, 2007. The Clean Development Mechanism: history, status, and prospects. Rev Environ Econ Policy, 1 (1), 134-151.
Mauro. P., 1995, Corruption and Growth, The Quarterly Journal of Economics, 110 (3), 681-712.
Michaelowa, A. 2007. Unilateral CDM - can developing countries finance generation of greenhouse gas emission credits on their own? International Environmental Agreements, 7 (18), 17-34.
Michaelowa, A. and K. Michaelowa, 2007. Climate or development: is ODA diverted from its original purpose? Climatic Change, 84 (1), 5–22.
Muller, A. 2007 How to Make the Clean Development Mechanism Sustainable - The Potential of Rent Extraction. Energy Policy, 35 (6), 3203-3212.
Niederberger, A. and R. Saner, 2005. Exploring the relationships between FDI flows and CDM potential. Transnational Corporations, 14 (1), 1-40.
Olawuyi, D. S., 2009. Achieving Sustainable Development in Africa Through the Clean Development Mechanism: Legal and Institutional Issues Considered. African J. Int. law Comp. Law, 17, 270-301.
Osbahr, H., Twyman C., Adger, W. N. and Thomas, D. S. G., 2008. Effective livelihood adaptation to climate change disturbance: Scale dimensions of practice in Mozambique. Geoforum, 39 (6), 1951-1964.
Paulsson, E., 2009. A review of the CDM literature: from fine-tuning to critical scrutiny? International Environ Agreements, 9, 63-80.
pg. 27
Projects. Climate Change, 84 (1), 75-90.
Tobin, J., 1958. Estimation of relationships for limited dependent variables. Econometrica, 26, 24~36.
UNDP, 2007. Human Development Report 2007/2008: Fighting climate change: Human solidarity in a divided world. New York: UNDP.
UNEP, 2010a. How Close Are We to the Two Degree Limit? Nairobi, Kenya: UNEP.
UNEP, 2010b. Are the Copenhagen Accord pledges sufficient to limit global warming to 2°C or 1.5°C?, The Emissions Gap Report. Nairobi, Kenya: UNEP.
UNEP Risø Centre, 2008. A reformed CDM – including new Mechanisms for Sustainable Development. Roskilde: UNEP Risø Centre.
UNEP, 2011. Bridging the Emissions Gap to Meet 2-Degree Target Doable, Nairobi, Kenya: UNEP.
UNEP Risø Centre, (2012), CDM Pipeline overview [Online], <http://uneprisoe.org/> [3 July 2012].
UNFCCC, (1992), United Nations Framework Convention on Climate Change [Online], Available from: <http://unfccc.int/resource/docs/convkp/conveng.pdf> [25 November 2011].
UNFCCC, (1998), Kyoto Protocol [Online], Available from: <http://unfccc.int/resource/docs/convkp/kpeng.pdf> [25 November 2011].
UNFCCC, (2001), Decision 17/CP.7: Modalities and procedures for a CDM as defined in Article 12 of the Kyoto Protocol [Online], Available from: <http://unfccc.int/files/meetings/workshops/other_meetings/application/pdf/17cp7.pdf>, [5 July 2011].
UNFCCC, (2009), The Copenhagen Accord [Online], Available from: <http://unfccc.int/resource/docs/2009/cop15/eng/l07.pdf> [25 November 2011].
UNFCCC, (2012a), Least Developed Countries [Online], Available from: <http://unfccc.int/cooperation_and_support/ldc/items/2666.php> [7 July 2012].
UNFCCC, (2012b), Designated National Authorities (DNAs) [Online]. <http://cdm.unfccc.int/Statistics/Registration/RegisteredDNAPieChart.html> [7 June 2012].
UNFCCC, (2012c), Registered project activities by host party [Online], Available from: <http://cdm.unfccc.int/Statistics/Registration/NumOfRegisteredProjByHostPartiesPieCha rt.html> [7 July 2012].
UNFCCC, (2012d), CERs issued by host party [Online], Available from: <http://cdm.unfccc.int/Statistics/Issuance/CERsIssuedByHostPartyPieChart.html> [7 July 2012].
UNFCCC, (2012e), Global Warming Potentials [Online], Available from: <http://unfccc.int/ghg_data/items/3825.php>, [15 May 2012].
pg. 28
6~13.
Winkelman, A. and M. Moore, 2011. Explaining the differential distribution of Clean Development Mechanism projects across host countries. Energy Policy, 39 (3), 1132~1143.
Worldwide Governance Indicators, (2012), The Worldwide Governance Indicators (WGI) project [Online], Available from: <http://info.worldbank.org/governance/wgi/index.asp> [3 June 2012].