Georgia State University Georgia State University
ScholarWorks @ Georgia State University
ScholarWorks @ Georgia State University
Chemistry Theses Department of Chemistry
Summer 7-12-2012
Two-site DNA Minor Groove Binding Compounds
Two-site DNA Minor Groove Binding Compounds
Shelby Diane Sheldon Deuser
Georgia State University, [email protected]
Follow this and additional works at: https://scholarworks.gsu.edu/chemistry_theses
Recommended Citation Recommended Citation
Sheldon Deuser, Shelby Diane, "Two-site DNA Minor Groove Binding Compounds." Thesis, Georgia State University, 2012.
https://scholarworks.gsu.edu/chemistry_theses/51
This Thesis is brought to you for free and open access by the Department of Chemistry at ScholarWorks @ Georgia State University. It has been accepted for inclusion in Chemistry Theses by an authorized administrator of
TWO-SITE DNA MINOR GROOVE BINDING COMPOUNDS
By
SHELBY DIANE SHELDON DEUSER
Under the Direction of Dr. W. David Wilson
ABSTRACT
DNA minor groove binding compounds have had limited therapeutic uses, in part due to
problems with sequence specificity. A two-site model has been developed to enhance
specificity, in which compounds bind to two short AT sites separated by one or two GC
base pairs. Using thermal melting, heterocyclic dications with this capability were tested
with various oligonucleotides for binding affinity and specificity. Compounds of interest
were further probed using circular dichroism, mass spectrometry, biosensor-SPR, and
molecular modeling. Several compounds were found to “jump” a GC base pair, binding
to AT sites in the minor groove of DNA with a two-site recognition mode. One
compound was also found to recognize a single intervening GC base pair. Compounds
with terminal, non-polar amidine extensions were found to have increased DNA binding
compared to analogs with terminal amidines. This unique, two-site DNA recognition
mode offers novel design principles to recognize entirely new DNA motifs.
INDEX WORDS: DNA, Minor groove binders, Heterocyclic diamidines,
TWO-SITE DNA MINOR GROOVE BINDING COMPOUNDS
by
SHELBY DIANE SHELDON DEUSER
A Thesis Submitted in Partial Requirement for the Degree of
Master of Science
in the College of Arts and Sciences
Georgia State University
Copyright by
TWO-SITE MINOR GROOVE BINDING COMPOUNDS
by
SHELBY DIANE SHELDON DEUSER
Committee Chair: Dr. W. David Wilson
Committee: Dr. David Boykin
Dr. Markus Germann
Electronic Version Approved:
Office of Graduate Studies
College of Arts and Sciences
Georgia State University
iv DEDICATION
Dedicated to my husband Karl, whose encouragement, love, and support have been
v ACKNOWLEDGEMENTS
This work would not be possible without the patient guidance of Dr. W. David Wilson,
who has been an invaluable mentor and leader. Special thanks to Dr. Rupesh Nanjunda
for answering strange questions, discussing unexpected results, and teaching me the
technique of surface plasmon resonance. The molecular modeling was made possible
with the help of Dr. Michael Rettig. Every member in the Wilson lab group has
vi TABLE OF CONTENTS
ACKNOWLEDGEMENTS………..……….v
LIST OF TABLES………..………....vii
LIST OF FIGURES.………..….viii
LIST OF EQUATIONS………ix
1 INTRODUCTION………..1
1.1 Nucleic Acids as Drug Targets……….………..1
1.2. Two-site Approach…….………..………..2
1.3 Purpose of This Study………..6
2 EXPERIMENTAL………...………....11
2.1 Buffer and Sample Preparation…………..………..11
2.2.1 Cacodylic Acid Buffer……….11
2.2.2 2[N-Morpholino]ethanesulfonic acid buffer...11
2.2.3 4-(2-Hydroxyethyl)-1-piperazineethanesulfonic acid buffer….12 2.2.4 Compound Preparation………..12
2.2.5 Oligonucleotide Preparation……….13
2.2 Thermal Melting……….………...13
2.3 Circular Dichroism…….………..14
2.4 Mass Spectrometry…….……….14
2.5 Surface Plasmon Resonance………15
2.6 Molecular Modeling……...………..………15
3 RESULTS………....16
vii
3.2 Thermal Melting…………....……….………...………...17
3.3 Circular dichroism………..……...………...26
3.4 Mass spectrometry……….…………...………..……...……....36
3.5 Surface Plasmon Resonance………...……...………..……...……40
3.6 Molecular Modeling…….………42
4 DISCUSSION………...……..………47
4.1 DNA Microstructure………..……….…...………..47
4.2 Group I Compounds……….……….……...………..48
4.3 Group II Compounds…….……….…...……….51
4.4 Group III Compounds…….……….…...………53
4.5 Group IV Compounds……..……….…...………...54
5 CONCLUSIONS………...……..………55
REFERENCES………...……..………..57
viii LIST OF TABLES
Table 1. Extinction coefficients and peak absorbances of selected
compounds 17
Table 2. ΔTm results of various compounds and oligonucleotides 19
Table 3. Approximate saturating ratios for CD experiments 35
ix LIST OF FIGURES
Figure 1. Structure of DNA base pairs 3
Figure 2. Two-site concept 4
Figure 3. Heterocyclic diamidine and cyanine dye structures 7
Figure 4. DNA sequences tested 10
Figure 5. Extinction coefficient graphs for DB321 16
Figure 6. Selected thermal melting graphs 17
Figure 7. Comparison of CCL and MES buffers using thermal melting 18
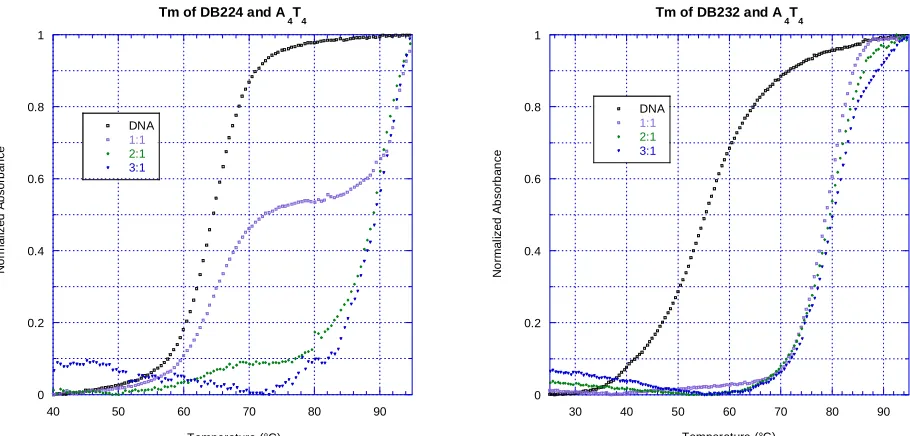
Figure 8. ΔTm graphs for DB224 and DB232 with A4T4 21
Figure 9. ΔTm results for DB224, DB321, DB496, DB510, and analogs 22
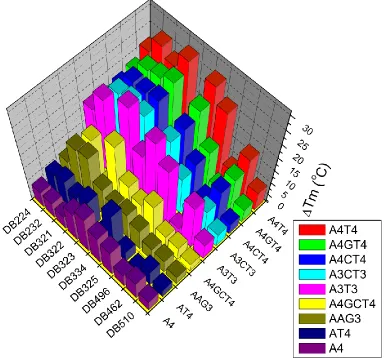
Figure 10. ΔTm results for remaining Group I compounds 23
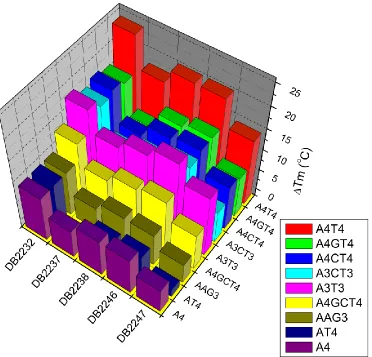
Figure 11. ΔTm results for DB2232 and analogs 24
Figure 12. ΔTm results for selected Group II, III, and IV compounds 25
Figure 13. Circular dichroism results for DB224 and DB232 with A4T4 26
Figure 14. Circular dichroism results for DB321 with A4GT4 27
Figure 15. Circular dichroism results for DB334 with A4T4 28
Figure 16. Circular dichroism results for DB2260 with A4T4 29
Figure 17. Circular dichroism results for DB2150 with A4T4 30
Figure 18. Circular dichroism results for DB2120 with A4GT4 31
Figure 19. Circular dichroism results for DB2232 with A4T4 32
Figure 20. Circular dichroism results for DB1791 with A4T4 33
Figure 21. Circular dichroism results for DB1998 with A4T4 34
x
Figure 23. Mass spectrometry with and without methanol 37
Figure 24. Mass spectrometry results for DB334, DB2120, DB2232,
and DB223 38
Figure 25. SPR sensorgrams for DB2150 41
Figure 26. SPR steady-state fits for DB2150 41
Figure 27. Electrostatic potential maps for minimum energy conformers of
DB224, DB321, and analogs 42
Figure 28. Electrostatic potential maps for minimum energy conformers of
DB496, DB510, and analogs 43
Figure 29. Electrostatic potential maps for minimum energy conformers of
selected Group I compounds 44
Figure 30. Electrostatic potential maps for minimum energy conformers of
DB2232 and analogs 45
Figure 31. Electrostatic potential maps for minimum energy conformers of
1
1 INTRODUCTION
1.1 Nucleic Acids as Drug Targets
The human body is based upon the language of molecules, and through their
interactions states of wellness and disease are created. The effects, and often the root
causes of disease can be traced back to aberrant transcriptional pathways. The
biological system of transcription is complex and dynamic, consisting of proteins,
nucleic acids, co-factors, and other compounds whose interactions maintain life. By
targeting nucleic acids in a sequence-specific manner with small, cell-permeable
molecules, cellular regulation and genomic reprogramming may become medicines of
the future.1
With the advent of the human genome project, nucleic acids have become an
increasingly popular target, both for basic research and for novel therapeutics. Current
and early anti-cancer drugs target DNA, including actinomycin D and cisplatin.2 The
treatment for tuberculosis, streptomycin, specifically targets ribosomal RNA in the
pathogenic microorganism.2b Aromatic diamidines such as pentamidine, currently used
as treatment, target the minor groove of kinetoplast DNA (kDNA) in the trypanosome
parasite responsible for African sleeping sickness. These circular kDNAs are interlocked
similarly to chain mail, and are found inside the protozoan’s mitochondria. Since there
are no equivalent nucleic acid structures in humans, these sites are attractive targets for
antiparasitic drug development.2b, 3 The kinetoplast sites are rich in AT base pairs,
2 contains sites rich in AT base pairs; thus greater sequence specificity must be
developed to increase the therapeutic index of this class.
1.2 Two-site Approach
The AT sites found in kinetoplast minicircles of mitochondrial DNA are often
separated by one or more GC base pairs (BPs); a common motif is 3-4 AT BPs
separated by 1-2 GC BPs.3a If this sequence-specific feature could be selectively
targeted, minor groove binding agents could be improved as anti-parasitic agents with
fewer side effects. The minor groove of an AT BP (Figure 1) has two hydrogen bond
acceptor sites, the N3 of adenine and the C2 carbonyl of thymine; and is easily
recognizable by heterocyclic groups with hydrogen bond donors.4-5 The minor groove of
a GC BP has one hydrogen bond donor group, the C2 amine group of guanine, and two
acceptors, the N3 of guanine and the C2 carbonyl of cytosine. However, the protruding
exocyclic amine group of guanine presents a steric hindrance to deep minor groove
3 Figure 1. Structure of DNA base pairs.4 Adenine-thymine (AT) and guanine-cytosine (GC) are illustrated with major and minor grooves indicated. Note the exocyclic amine of guanine protruding into the minor groove.
AT-rich sequences, especially poly-dA oligonucleotides, have other unique
characteristics. The minor grove of such sequences is compressed, resulting in
increased negative electrostatic potential.4, 6 Introduction of alternating A-T “steps”
lessens this effect. If intervening GC BPs are introduced, the minor groove widens, and
the resulting electrostatic potential is relatively decreased in magnitude. Because of
these minor groove characteristics, preferential binding to GC BPs is both sterically and
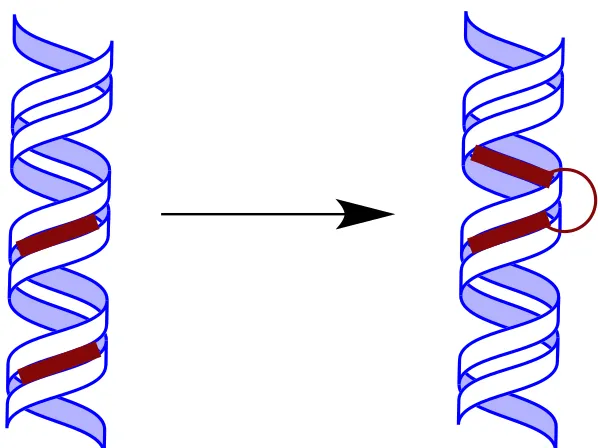
electrostatically challenging. By linking two AT recognizing moieties (Figure 2),
compounds that “jump” the GC BPs can be designed. A linker capable of recognizing
4 Figure 2. Two-site concept. Initially, AT-recognizing compounds bind 3-4 AT base pairs each. The two are joined together with a linker, and can span 1-2 intervening GC base pairs for a longer cognate binding site.
A two-site approach has been used with a variety of DNA binding systems.
Pyrrolo[2,1-c][1,4]benzodiazepines (PDBs) such as tomamycin and anthramycin are
antitumor antibiotic agents currently used clinically.7 These compounds bind to the
minor groove, covalently bonding to the exocyclic C2-NH2 of a guanine base. Two such
PDBs have been joined via a diether linkage (i.e. -O-(CH2)n-O-), and various homologs
tested for linker length optimization. The homolog studies show that three and five
methylene groups correlate with guanine separation of two and three BPs respectively,
with the two covalent bonds forming on opposite strands. Similarly, to serve as a probe
for higher-ordered DNA structures, two Hoechst 33258 moieties have been joined with
an oligo-ethylene glycol linker.8 Hoechst 33258 is known to strongly bind to the minor
groove of DNA at an AT rich site (A3T3). The bidentate compounds bind to the minor
groove of DNA at two AT sites, showing cooperative binding as well as site
5 Other examples include polyamides, minor groove binders based on the natural
products netropsin and distamycin A, which can be programmed for binding in a
sequence specific manner.1a, 9 Hairpin polyamides have been connected together
head-to-head via alkyl linkers (i.e. -CO(CH2)nCO-). The resulting compounds bind one hairpin
moiety to each of two adjacent binding sites, spanning 10-11 BP.9c Linker optimization
studies showed that two methylene groups are preferred for jumping two AT BPs.
Polyamides have also been developed that bind as overlapped dimers.10 These
compounds break the cognate sequence into two halves, binding to AT rich opposite
sides of the binding site and stacking in the mixed BP center. Known as combilexins,
compounds have also been designed that combine a polyamide-type minor groove
binder with an intercalating agent, resulting in anticancer molecules that bind with two
different modes to two different sites.11
Successful implementation of a two-site model would result in compounds that
are thermodynamically driven towards complex formation with longer binding sites.
Binding with a single site would leave half of the ligand unbound, resulting in a high
energy, unstable complex. Such selectivity promises enhanced recognition, which is
necessary for genome-regulating compounds as well as for a new generation of
6 1.3 Purpose of This Study
Minor groove DNA binding compounds hold great potential for new drugs, not
only as anti-parasitics, but also as human genome regulators that can target other
diseases. For this to become a reality a greater understanding of compound structure
vs. selectivity must be developed. In order to keep the synthetic price of potential
therapeutics relatively low, this study focuses on symmetrical molecules. Although
sequence-specific polyamides can be designed and synthesized, they are currently
expensive and impractical as new drug candidates. Other minor groove binding
heterocyclic groups such as benzimidazole and hydroxybenzimidazole have been
developed that show promising selectivity;1a, 9b however, no true substitution for
polyamide sequence recognition has yet been discovered. This study screens a number
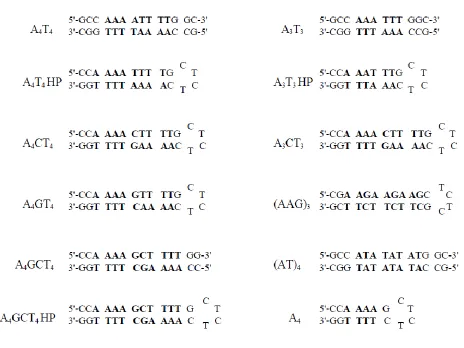
of heterocyclic dications (Figure 3) against a variety of DNA sequences (Figure 4). From
the resulting matrix of data, structure-activity relationships can be derived that further
this goal. The sequence (AAG)3 is a specific target for binding. This sequence is
repeated many times in the genetic disease Friedreich’s Ataxia, causing irregular DNA
hairpin formations. The body’s repair mechanisms are ineffective at removing these
repeats, resulting in “sticky” DNA that forms a triplex structure.12
Stabilizing the duplex
form of this DNA by minor groove binding molecules is a novel treatment approach.
Unlike many minor groove binders, heterocyclic dications are readily cell-permeable;
7 N NH NH HN N N DB232 HN N HN NH N N H H N NH N N H H N NH DB462 N N H NH2 HN N N H NH2 NH DB510
Group I
N NH NH2 HN N N DB224 HN NH2N NH O HN N N NH HN NH
HN DB334 NH
O
HN N N
NH
H2N NH2
HN DB321 NH
O HN N N NH DB322 HN NH NH HN O HN N N NH HN NH HN NH DB323 N NH NH2 HN N N HN N
H2N NH O N NH NH2 HN N N HN N
H2N NH O DB2239 DB2240 O N NH NH2 HN O N HN
H2N NH DB2147 CH3 H N H N HN NH
NH2 H2N
DB1947
H2N HN
N N
H2N NH O
H2N HN
N N
H2N NH O DB2242 DB2243 N N H H N NH N N H H N NH DB325 N N H NH2 HN N N H NH2 NH DB496 N NH NH2 HN H N HN
HN N
H2N NH O DB2265 N NH NH2 HN N N N N HN N
H2N NH O
8 N NH NH2 HN N HN
H2N NH O O CH3 DB2148 N NH NH2 HN N HN
H2N NH O O DB2149 N N NH NH2 HN N HN
H2N NH O O DB2150 N CH3 N N H NH2 HN N N H NH2 NH
O N O
DB2201
Group II
N NH NH2 HN N HNH2N NH O O DB2232 N N NH2 HN N N
H2N NH O O DB2237 N N NH2 HN N HN
H2N NH
O O
DB2238
CH3 CH3 CH3
DB2119 N NH NH2 HN N HN
H2N NH O O N NH NH2 HN O DB2241 O O N HN
H2N NH O N N NH2 HN N HN
H2N NH O O DB2246 N N NH2 HN N N
H2N NH
O O
DB2247
CH3 H3C
CH3 N NH NH2 HN N HN
H2N NH O O N DB2120 NH2 HN O NH2 HN O
H2N
NH O
H2N
NH O
O(H2C)5 O(CH2)2O (CH2)2O
DB1746 DB1747
O
H2N
HN O O
(CH2)3
DB1791
O NH2
NH
Group III
N O
O
H2N
9
S S
NH2
NH2
NH NH
DB1255
S S
N N H H2N
NH
N H N
NH2
HN
DB2224
N S
N S NH2
NH2
NH NH
DB1998
N S
DB2204
N S
HN N N
NH
N S
H3C
N S
CH3
N S
H3C
N S
CH3
N S
H3C
N S
CH3
1C-linker cyanine (3,3'-diethylthiacyanine iodide)
I I I
3C-linker cyanine (3,3'-diethylthiacarbocyanine iodide)
5C-linker cyanine (diethylthiadicarbocyanine iodide)
[image:21.612.127.517.114.308.2]Group IV
10 Figure 4. DNA seuqences tested. Shorthand is listed to the left of each
oligonucleotide, and will be used to refer to the sequences throught the text. Hairpin and self-complementary DNA sequences were selected with a variety of binding sites and
similar flanking sequences. A4T4 is the two-site sequence with no intervening GC BPs,
and A3T3 the shortened version, selected as a test for binding site length. A4 is the
single-site control. A variety of two-site sequences with one or two intervening GC BPs
were selected (A4GT4, A4CT4, A4GCT4, and A3CT3), as well as the Friedreich’s Ataxia
sequence, (AAG)3, which can be thought of as a shortened two-site or three-site
sequence. The sequence (AT)4 was selected to compare an A-T step sequence to the
11
2 EXPERIMENTAL
2.1 Buffer and Sample Preparation
2.1.1 Cacodylic Acid Buffer
Cacodylic acid (CCL), disodium ethylenediamine tetraacetic acid (EDTA), sodium
hydroxide (1 N), and sodium chloride were obtained from Fisher Scientific (Fairlawn,
NJ). Nanopure water was obtained using an ELGA Purelab Classic water purification
system. Cacodylic acid (10 mM), NaCl (100 mM), and EDTA (1 mM) were dissolved into
nanopure water by stirring over low heat. An Accumet pH Meter 910 (Fisher Scientific)
was used to monitor pH, and the buffer was titrated using NaOH until the pH reached
6.2. The solution was transferred into a Kimax volumetric flask and made up to the mark
with additional nanopure water.
2.1.2 2[N-Morpholino]ethanesulfonic Acid Buffer
Surfactant P20 was obtained from GE Healthcare (Uppsala, Sweden),
2[N-morpholino]ethanesulfonic acid (MES) was obtained from Sigma Chemical Company
(St. Louis, MO), and sodium hydroxide was obtained from Fisher Scientific (Fairlawn,
NJ). MES (10 mM), NaCl (100 mM) and EDTA (0.1 mM) were dissolved into nanopure
water by stirring over low heat. The solution was titrated with NaOH to a pH of 6.2, and
the total volume made up in a volumetric flask as described above. Surfactant P20
12 vacuum filtration apparatus with 0.22 µm nitrocellulose filter paper (Millipore, Billerica,
MA).
2.1.3 4-(2-Hydroxyethyl)-1-piperazineethanesulfonic Acid Buffer
Hydrochloric acid (1 N) was obtained from Fisher Scientific (Fairlawn, NJ), and
4-(2-hydroxyethyl)-1-piperazineethanesulfonic acid (HEPES) was obtained from Sigma
Chemical Company (St. Louis, MO). HEPES (10 mM), NaCl (100 mM) and EDTA (0.1
mM) were dissolved into nanopure water by stirring. The solution was titrated with
hydrochloric acid to a pH of 7.4, and the total volume made up in a Kimax volumetric
flask. Surfactant P20 (0.05% v/v) was added, and the solution filtered and degassed as
described above.
2.1.4 Compound Preparation
All DB compounds were synthesized in Professor David Boykin's laboratory
(GSU, Atlanta, GA). Cyanine dyes (diethylthiadicarbocyanine iodine,
3,3’-diethylthiacyanine iodide, and 3,3’-diethylthiacarbocyanine iodide) were obtained from
Aldrich Chemical Company (Milwaukee, WI). Stock solutions of compounds (0.3 - 1
mM) were prepared in nanopure water with 0-30% DMSO added if necessary for
dissolution. Extinction coefficients for selected compounds were obtained using a Cary
300 Bio UV-vis spectrophotometer (Varian) run from 800-200 nm at 60 nm/min. A plot of
concentration vs. peak absorbance was created using Kaleidagraph software, and the
slope taken to be the extinction coefficient of the compound as evident from the
13
2.1.5 Oligonucleotide Preparation
Oligonuleotides were obtained from Integrated DNA Technologies (Coralville, IA).
Solutions were prepared by adding nanopure water to the oligonucleotide vial for ~1 mM
concentration. These concentrations were checked by using the simple reads function
of a Cary 300 Bio UV-vis spectrophotometer (Varian) at 260 nm. The absorbance
values of five titrations of DNA stock solution were averaged and used to determine
concentration based on the Beer-Lambert Law.
2.2 Thermal Melting
Binding of compounds to oligonucleotides was screened by thermal melting
using a Cary 300 Bio UV-vis spectrophotometer (Varian). Samples of DNA and
compound in buffer (1000 μL) were prepared in 1 cm quartz cuvettes at various ratios
(e.g. 0:0 (buffer blank), 0:1 (DNA), 1:1, 2:1 and 3:1), and were annealed prior to being
tested. For bulk screening purposes, different compounds at a 2:1 ratio were tested at
the same time. A concentration of 3 μM DNA was used unless significant aggregation
occurred, in which case a concentration of 1 μM DNA was used. The machine was set
to test a single ramp at 260 nm and 0.5° C/min, beginning well below the native melting
temperature and ending well above it or at 95.00° C. The absorbance of the buffer was
subtracted, and a graph of normalized absorbance vs. temperature was created using
Kaleidagraph software. The ΔTm values were calculated using a combination of the
14 2.3 Circular Dichroism
Circular dichroism studies were performed using a Jasco J-810 instrument. Four
spectra were averaged from 500 to 220 nm, using a 1 cm quartz cuvette, a scan speed
of 50 nm/min, and a response time of 1 sec. A cacodylic acid buffer spectrum was taken
first, followed by DNA in the same buffer (3 μM). Compound was then titrated into the
solution, taking a spectrum at each new concentration until saturation was reached.
Buffer subtracted graphs were created using the Kaleidagraph software.
2.4 Mass Spectrometry
Hairpin oligonucleotide solutions were desalted three times using 150 mM
ammonium acetate (Sigma-Aldrich, St. Lious, MO) buffer and a 1000 Da cut-off
membrane (Spectrum Laboratories Inc., Rancho Dominguez, CA). A concentration of 5
μM of each oligonucleotide was run together with an appropriate amount of compound
to yield the desired ratio, reported as [compound]:[each oligonucleotide]. Compounds
were prepared in ammonium acetate buffer (150 mM) with or without 5% (v/v) methanol
(Fisher Scientific, Fairlawn, NJ). Electrospray ionization mass spectrometry on a
negative mode was performed using a Waters Micromass Q-TOF micro (ESI-Q-TOF,
Milford, MA) instrument. ‘Soft’ ionization conditions were used, with a capillary voltage
of 2.5 kV, sample cone voltage of 30 V, source block temperature of 70° C, desolvation
temperature of 100° C, nitrogen as the nebulizing and drying gas, and direct injection at
5 μL/min. Spectral information was recorded in the mass/charge region 300-3000, and
15 2.5 Surface Plasmon Resonance
Surface plasmon resonance (SPR) was conducted using a four-channel Biacore
2000 or Bia T200 optical biosensor system (Biacore, GE Helthcare Inc.). Hairpin
oligonucleotides biotin labeled at the 5’ end were immobilized on to streptavidin-coated
sensor chips (Biacore SA) as described in the literature.1b, 2b, 14 One flow cell was left
blank as a reference, and the three remaining cells immobilized with ~350 RU DNA.
Filtered, degassed MES or HEPES buffer was used for all SPR experiments. Serially
diluted compound samples were prepared and tested, and the resulting sensorgrams fit
using steady state models.2b, 14a Data processing was performed using the
BIAevaluation software (Biacore, GE Heathcare Inc.) and Kaleidagraph software.
2.6 Molecular Modeling
Compounds were modeled using Spartan ’04 running on a Windows XP platform.
Molecules were drawn and the molecular geometry minimized with molecular
mechanics based on the MMFF force field after the addition of each group. Next, an
equilibrium conformer calculation was performed using the MMFF force field. This
output was further refined by calculating the equilibrium geometry using a Hartree-Fock
model with a 6-31G* basis set. A high-resolution electrostatic potential map was
16
3 RESULTS
3.1 Extinction Coefficients
UV-vis absorption spectra were measured to determine if the compounds studied
resulted in linear Beer-Lambert plots, as well as to determine extinction coefficient
values. An example of spectral series and extinction coefficient are shown in Figure 5
for DB321. Despite their hydrophobicity, compounds typically resulted in linear
Beer-Lambert plots throughout the concentration range tested (1-20 µM), with extinction
coefficients in the range of 4 x 10⁴ - 7 x 10⁴ L/(M*cm), and peak absorbances between
270 and 400 nm.
0 0.2 0.4 0.6 0.8 1
200 250 300 350 400 450 500
H20 1 uM
3 uM 6 uM
8 uM
9.5 uM 11 uM 12.4 uM
13.9 uM 15.3 uM 16.8 uM 18.2 uM 19.6 uM
A
b
so
rb
a
n
ce
Wavelength (nm)
Figure 5: Extinction coefficient graphs for DB321. For DB321, a peak absorbance value at 381 nm can be found from the plot of absorbance vs. wavelength. As with the other compounds, the extinction coefficient was found from the slope of the best-fit line of a plot of peak absorbance vs. concentration.
0.2 0.3 0.4 0.5 0.6 0.7 0.8 0.9 1
6 8 10 12 14 16 18 20
y = -0.078589 + 0.049828x R= 0.9999
Pe
a
k
Ab
s
o
rb
a
n
c
e
17 Table 1: Extinction coefficients and peak absorbances of selected compounds. The extinction coefficient values were calculated using the Beer-Lambert Law,
measuring the absorbance of various ratios of compound at the wavelength with maximum absorbance.
Compound Extinction Coefficient (L/(M*cm)) Peak Absorbance (nm)
DB321 5.0 x 10⁴ 381
DB462 6.5 x 10⁴ 365
DB510 5.2 x 10⁴ 366
DB1947 6.8 x 10⁴ 277
DB2148 4.4 x 10⁴ 313
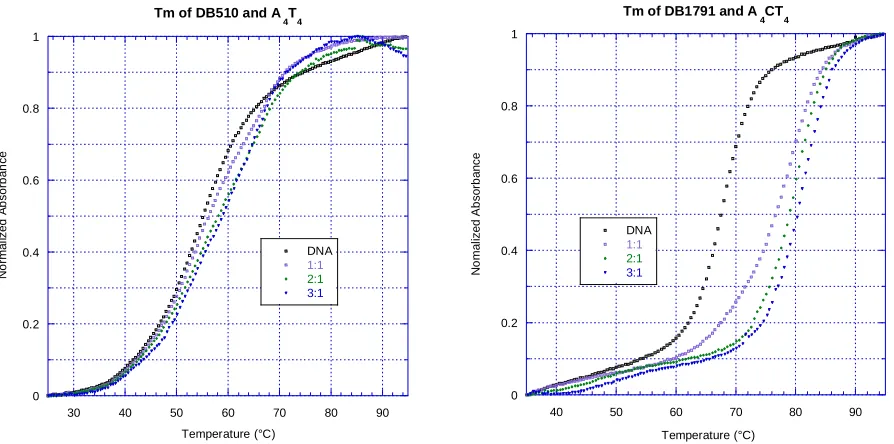
3.2 Thermal Melting
Thermal melting experiments were performed as a robust screening method for
relative binding affinity. The method is illustrated in Figure 6, with different compounds
and different DNA sequences.
0 0.2 0.4 0.6 0.8 1
30 40 50 60 70 80 90
Tm of DB510 and A 4T4
DNA
1:1 2:1 3:1
N
o
rm
a
liz
e
d
A
b
s
o
rb
a
n
c
e
Temperature (°C)
0 0.2 0.4 0.6 0.8 1
40 50 60 70 80 90
Tm of DB1791 and A 4CT4
DNA
1:1 2:1 3:1
N
o
m
a
lize
d
A
b
so
rb
a
n
ce
[image:29.612.77.524.422.644.2]Temperature (°C)
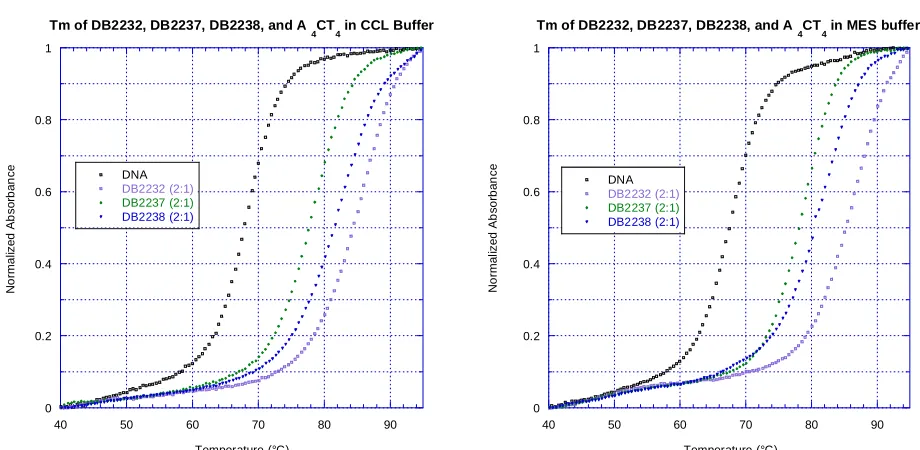
18 CCL or MES buffer at pH 6.2. Typically a ratio of 2:1, [compound]:[DNA], was used to compare relative binding affinities. For compounds with abnormal graphs the derivative function occasionally failed to produce an accurate Tm value. In these cases, the ΔTm
value was estimated from the graph.13
0 0.2 0.4 0.6 0.8 1
40 50 60 70 80 90
Tm of DB2232, DB2237, DB2238, and A
4CT4 in CCL Buffer
DNA
DB2232 (2:1) DB2237 (2:1) DB2238 (2:1)
N
o
rma
liz
e
d
A
b
s
o
rb
a
n
c
e
Temperature (°C)
0 0.2 0.4 0.6 0.8 1
40 50 60 70 80 90
Tm of DB2232, DB2237, DB2238, and A
4CT4 in MES buffer
DNA
DB2232 (2:1) DB2237 (2:1) DB2238 (2:1)
N
o
rma
li
z
e
d
A
b
s
o
rb
a
n
c
e
[image:30.612.73.533.176.401.2]Temperature (°C)
Figure 7. Comparison of CCL and MES buffers using thermal melting. Samples were tested with 3 μM DNA in either CCL or MES buffer at pH 6.2. Compounds were assumed to bind as either monomers or dimers, and so a 2:1 ratio was chosen for
comparison. The ΔTm results for A4CT4 with DB2232, DB2237, and DB2238 were the
19 Table 2: ΔTm results of various compounds and oligonucleotides. Compounds were tested with 3 μM or 1 μM DNA in either CCL or MES buffer (100 mM NaCl) at pH 6.2. ΔTm was calculated in degrees centigrade from (Tm with compound) - (Tm without compound) at a 2:1 ratio of compound to duplex DNA, and is assumed to have an error of +/- 1° C. “*” indicates trials run with hairpin sequences; “**” indicates that a 3:1 ratio was used for this compound; “---” indicates that no trial has been done.
DNA A4T4 A4GT4 A4CT4 A3CT3 A3T3 A4GCT4 (AAG)3 (AT)4 A4
Native Tm (° C)
55, 65*
67 66 66 54, 63* 53 73* 58 69
Group I
DB224 21 18 17 16 >17* 0 6 5 3
DB232 26 >22 >22 >22 24 14 15 7 3
DB321 23 23 22 23 5 0 16 5 2
DB322 28 >25 >23 >22 29 20 8 8 8
DB323 14 10 10 8 16* 9 6 -2 11
DB334 27 >23 >21 >21 >25* 6 7 12 8
DB325 >22 12 12 11 19* 10 5 1 7
DB496 4 2 2 2 0* 2 2 -2 2
DB462 13 10 10 7 14* 2 2 3 4
DB510 4 2 1 2 3* 0 0 0 1
DB2147 14 --- 0 --- --- 0 1 --- ---
DB1947** 16 13 14 15 18* 14 9 --- 12
DB2239 2* 3 2 1 2 1 1 -2 1
DB2240 13* 10 9 12 11 7 4 1 3
DB2242 2* 1 --- --- --- 2 --- --- ---
DB2243 0* 1 --- --- --- 0 --- --- ---
DB2260 15* 13 13 12 12* 11 5 0 7
DB2265 12* 2 3 1 2 0 1 0 1
Group I
I
DB2119 14* 12 11 2 2 2 1 3 1
DB2120 15* >21 >21 >19 3 9 4 4 2
DB2148 17 17 17 8 2* 1 2 2 0
DB2149 11 5 6 3 2* 3 1 --- 2
DB2150 15* 14 13 13 14* 9 9 0 7
DB2201 5* 4 --- --- --- 1 2 --- ---
DB2241 2* 1 --- --- --- 0 --- --- ---
DB2232 >24* 16 17 16 18 13 9 9 9
DB2237 17* 9 10 9 13 8 4 -1 5
DB2238 20* 13 13 11 15 10 6 3 7
DB2246 20* 14 14 13 17 11 6 3 7
20 Many of the larger compounds showed preferences for sequences with two
AT-rich sites, suggesting a two-site binding mode. Group I compounds elevated the melting
temperature of such sequences the most, with ΔTm values over 22° C. All of the larger
compounds that showed binding predominantly preferred sequences having two
A-tracts, and had trouble accommodating two intervening GC base pairs. DB1947, a
smaller compound, bound to the two-site sequences as well as to the others, showing
little to no selectivity. DB2147 thermally stabilized the A4T4 sequence, but did not do the
same to any of the other oligonucleotides. When compared to the A4T4 sequence, the
introduction of alternating AT base pairs, (AT)4, effectively decreased the binding of all
compounds. Several compounds were ineffective as minor groove binders, including
DB2242, DB2243, DB2201, the symmetrical compounds in Group III, the larger
sulfur-containing compounds, and the selected cyanine dyes. However, many more
G
rou
p II
I DB1746 2 0 0 --- --- 2 --- --- ---
DB1747 3 --- 3 --- --- 0 --- --- ---
DB1791 15 13 14 13 14 9 5 0 4
DB2189 2* 1 --- --- --- 2 --- --- ---
DB1998 18 13 --- 13 19 11 9 2 9
Group I
V
DB1255 17 14 --- 14 16 6 5 2 6
DB2204 4 4 --- --- 4* 4 --- 3 ---
DB2224 0 0 --- --- --- -2 1 -2 ---
1C-Linker Cyanine
2 0 --- --- --- 0 --- --- ---
3C-Linker Cyanine
2 1 --- --- --- 1 --- --- ---
5C-Linker Cyanine
21 compounds were found to be strong binders by thermal melting, and show promising
results.
0 0.2 0.4 0.6 0.8 1
40 50 60 70 80 90
Tm of DB224 and A 4T4
DNA
1:1 2:1 3:1
N
o
rm
a
lize
d
A
b
so
rb
a
n
ce
Temperature (°C)
0 0.2 0.4 0.6 0.8 1
30 40 50 60 70 80 90
Tm of DB232 and A 4T4
DNA
1:1 2:1 3:1
N
o
rm
a
li
z
e
d
Ab
s
o
rb
a
n
c
e
[image:33.612.78.533.155.373.2]Temperature (°C)
Figure 8. ΔTm graphs for DB224 and DB232 with A4T4. Compounds were tested at
0:1, 1:1, 2:1, and 3:1 ratios with 3 µM DNA in CCL or MES buffer (100 mM NaCl) at pH 6.2. DB232, the close analog of DB224, resulted in a more uniform thermal melting
curve than did the parent compound. The 1:1 ratio of DB224 and A4T4 showed free DNA
22 Figure 9. ΔTm results for DB224, DB321, DB496, DB510, and analogs. Compounds were tested at a 2:1 ratio with 3 µM DNA in CCL or MES buffer (100 mM NaCl) at pH
6.2. DB224,DB321, DB496, and DB510 bound to nearly all sequences more weakly
than their analogs, DB232, DB322, DB334, and DB496, which are identical except for the inclusion of terminal non-polar groups. DB323, containing no phenyl groups, bound
more weakly than DB321 to most sequences, exceptions being A4, A3T3, and A4GCT4.
Compounds predominantly preferred the A4T4 sequence, with most binding with similar
23 Figure 10. ΔTm results for remaining Group I compounds. Compounds were tested at a 2:1 ratio, with the exception of DB1947, which was tested at a 3:1 ratio. A
concentration of 3 µM DNA was used in CCL or MES buffer (100 mM NaCl) at pH 6.2.
Again, compounds predominantly preferred the A4T4 sequence. DB1947, a smaller
compound, showed little to no specificity. DB2240, containing a six-membered central ring with a carbonyl, bound more strongly to all sequences than did DB2239, which contains a similar five-membered central ring. DB2260 bound more strongly or the same as DB2240, the only difference being the replacement of phenyls by pyridines.
24 Figure 11. ΔTm results for DB2232 and analogs. Compounds were tested at a 2:1 ratio with 3 µM DNA in CCL or MES buffer (100 mM NaCl) at pH 6.2. DB2232 and
analogs predominantly preferred the A4T4 and A3T3 sequences. Significant binding also
occurred with the A4GT4, A4CT4, A3CT3, A3T3, andA4GT4, sequences. Analogs differed
by the location of methyl groups placed on nitrogen atoms of the flanking
25 Figure 12. ΔTm results for selected Group II, III, and IV compounds. Compounds were tested at a 2:1 ratio with 3 µM or 1 µM DNA in CCL or MES buffer at pH 6.2. Similar trends in selectivity were observed for DB2148, DB2150, DB1791, DB1998, and
DB1255. The A4T4 sequence was generally preferred, followed by A4GT4, A4CT4,
A3CT3, and A3T3. One notable exception is DB2120; this compound prefers A4GT4 and
A4CT4 binding sites to A4T4. DB2119 and DB2149 bound to A4T4, but were poor binders
26 3.3 CIRCULAR DICHROISM
Circular dichrosim experiments were performed to observe induced chirality by
ligands binding to DNA. Changes in compound chirality can be seen above about 300
nm, in the compound region of a spectrum, and indicate minor groove binding. Shape
changes in DNA can be seen below about 300 nm, in the DNA region of a spectrum,
and indicate that binding alters the conformation of DNA in some way. Examples
include groove distortion, curvature change, and intercalation.
-20 -10 0 10 20 30 40
240 280 320 360 400 440 480
CD of DB224 and A 4T4
DNA 0.4:1
0.8:1
1.2:1
1.6:1
2:1 2.4:1 2.8:1
3.2:1
3.6:1
4:1
4.4:1
C
D
(
m
d
e
g
)
Wavelength (nm)
-20 -10 0 10 20 30
240 280 320 360 400 440 480
CD of DB232 and A 4T4
DNA 0.2:1
0.4:1
0.6:1
0.8:1 1:1 1.2:1
1.4:1
1.6:1
1.8:1
2:1
2.2:1
C
D
(
m
d
e
g
)
Wavelength (nm)
Figure 13. Circular dichroism results for DB224 and DB232 with A4T4. Spectra were
measured in pH 6.2 CCL buffer (10 mM CCL, 100 mM NaCl, 1 mM EDTA) with a DNA concentration of 3 μM. Similar changes in the compound and DNA regions were
observed for DB224 and DB232 with A4T4; however, the CD of DB232 was saturated at
27 -30
-20 -10 0 10 20
240 280 320 360 400 440 480
CD of DB321 and A 4GT4
DNA
0.5:1
1:1
1.5:1
2:1
2:1 (anealed)
C
D
(
m
d
e
g
)
Wavelength (nm)
-30 -20 -10 0 10 20
240 280 320 360 400 440 480
Annealed CD of DB321 and A 4GT4
DNA
1:1 2:1 3:1
C
D
(
m
d
e
g
)
[image:39.612.80.519.73.264.2]Wavelength (nm)
Figure 14. Circular dichroism results for DB321 with A4GT4. Spectra were measured
in pH 6.2 CCL buffer (10 mM CCL, 100 mM NaCl, 1 mM EDTA) with a DNA
concentration of 3 μM.The spectra marked “annealed” are from samples that were removed from the instrument and annealed prior to scanning. Initially, DB321 did not
appear to have induced CD for the A4GT4 sequence; however, when the samples were
28 -40
-30 -20 -10 0 10 20 30
240 280 320 360 400 440 480
CD of DB334 and A
4T4
DNA 0.4:1 0.8:1 1.2:1 1.6:1 2:1
2.4:1
2.8:1
3.2:1 3.6:1
C
D
(
m
d
e
g
)
[image:40.612.151.464.75.359.2]Wavelength (nm)
Figure 15. Circular dichroism results for DB334 with A4T4. Spectra were measured
in pH 6.2 CCL buffer (10 mM CCL, 100 mM NaCl, 1 mM EDTA) with a DNA
concentration of 3 μM. The CD of DB334 with A4T4 shows a dramatic positive and
29 -40
-20 0 20 40 60 80
240 280 320 360 400 440 480
CD of DB2260 and A 4T4
DNA 0.4:1 0.8:1 1.2:1 1.6:1
2:1
2.4:1 2.8:1 3.2:1 3.6:1
4:1
4.4:1
4.8:1 5.2:1
C
D
(
m
d
e
g
)
[image:41.612.161.463.74.348.2]Wavelength (nm)
Figure 16. Circular dichroism results for DB2260 with A4T4. Spectra were measured
in pH 6.2 CCL buffer (10 mM CCL, 100 mM NaCl, 1 mM EDTA) with a DNA
concentration of 3 μM. The CD of DB2260 with A4T4 shows a large positive and
30 -10
-5 0 5 10
240 280 320 360 400 440 480
CD of DB2150 and A
4T4
DNA 0.4:1 0.8:1 1.2:1 1.6:1 2:1
2.4:1 2.8:1
C
D
(
m
d
e
g
)
[image:42.612.150.465.74.361.2]Wavelength (nm)
Figure 17. Circular dichroism results for DB2150 with A4T4. Spectra were measured
in pH 6.2 CCL buffer (10 mM CCL, 100 mM NaCl, 1 mM EDTA) with a DNA
concentration of 3 μM. The CD of DB2150 with A4T4 shows an induced CD in the
31 -15
-10 -5 0 5 10 15
240 280 320 360 400 440 480
CD of DB2120 and A
4GT4
DNA 0.5:1 1:1 1.5:1 2:1 2.5:1 3:1
3.5:1 4:1
C
D
(
m
d
e
g
)
[image:43.612.155.466.73.358.2]Wavelength (nm)
Figure 18. Circular dichroism results for DB2120 with A4GT4. Spectra were
measured in pH 6.2 CCL buffer (10 mM CCL, 100 mM NaCl, 1 mM EDTA) with a DNA
concentration of 3 μM. The CD of DB2120 with A4GT4 shows an induced CD in both the
32 -20
-15 -10 -5 0 5 10 15
240 280 320 360 400 440 480
CD of DB2232 and A
4T4
DNA 0.4:1 0.8:1 1.2:1 1.6:1 2:1 2.4:1
2.8:1 3.2:1
C
D
(
m
d
e
g
)
[image:44.612.152.462.75.356.2]Wavelength (nm)
Figure 19. Circular dichroism results for DB2232 with A4T4. Spectra were measured
in pH 6.2 CCL buffer (10 mM CCL, 100 mM NaCl, 1 mM EDTA) with a DNA
concentration of 3 μM. The CD of DB2232 with A4T4 shows an induced CD in the
33 -20
-15 -10 -5 0 5 10 15
240 280 320 360 400 440 480
CD of DB1791 and A
4T4
DNA 0.4:1 0.8:1 1.2:1 1.6:1
2:1 2.4:1
C
D
(
m
d
e
g
)
[image:45.612.153.465.73.359.2]Wavelength (nm)
Figure 20. Circular dichroism results for DB1791 with A4T4. Spectra were measured
in pH 6.2 CCL buffer (10 mM CCL, 100 mM NaCl, 1 mM EDTA) with a DNA
concentration of 3 μM. The CD of DB1791 with A4T4 shows significant induced CD in
34 -20
-15 -10 -5 0 5 10 15 20
240 280 320 360 400 440 480
CD of DB1998 and A
4T4
DNA 0.4:1 0.8:1 1.2:1
1.6:1 2.4:1
C
D
(
m
d
e
g
)
[image:46.612.152.464.74.358.2]Wavelength (nm)
Figure 21. Circular dichroism results for DB1998 with A4T4. Spectra were measured
in pH 6.2 CCL buffer (10 mM CCL, 100 mM NaCl, 1 mM EDTA) with a DNA
concentration of 3 μM. The CD of DB1998 with A4T4 shows both positive and negative
35 Table 3. Approximate saturating ratios for CD experiments. Spectra were measured in pH 6.2 CCL buffer (10 mM CCL, 100 mM NaCl, 1 mM EDTA) with a DNA
concentration of 3 μM. DB232 saturated at a much lower ratio than did its analog DB224, which suggests that DB232 is a stronger binding compound. DB321 and its analog, DB334, saturated the spectra of different sequences at similar ratios; however, the samples of DB321 were annealed between each titration. DB2150, DB1791, and DB1998 all saturated at or below approximately a 2:1 ratio, suggesting that these compound are relatively strong binders. DB2120 saturated at about 3.5:1, DB2232 saturated at about 2.8:1, and DB2260 saturated at a high ratio of approximately 4.4:1.
Compound Sequence Appx. Saturating Ratio
DB224 A4T4 3.8-4.2
DB232 A4T4 1.8-2.2
DB321 A4GT4 2.8-3.2
DB334 A4T4 3-3.4
DB2260 A4T4 4.2-4.6
DB2150 A4T4 1.8-2.2
DB2120 A4GT4 3.3-3.7
DB2232 A4T4 2.6-3
DB1791 A4T4 1.4-1.8
36 3.4 MASS SPECTROMETRY
Mass spectrometry experiments were performed to determine the stoichiometry
of binding. Multiple DNA sequences were tested together with a single compound for
[image:48.612.81.447.210.456.2]speed and qualitative assessment of relative binding.
Figure 22. Mass spectrometry results for DB224. Samples containing 5 μM of each oligonucleotide were tested in 150 mM ammonium acetate buffer with a capillary
voltage of 2.5 kV, cone voltage of 30 V, source block temperature of 70° C, desolvation temperature of 100° C, nitrogen as the nebulizing and drying gas, and direct injection at 5 μL/min. Using MassLynx 4.1 software, the observed mass of each equivalent species was multiplied by its charge and the areas were added to give a single peak at the “parent” mass. Ratios are reported as [compound]:[each oligonucleotide]; samples were prepared from the same pre-mixed DNA stock solution. DB224 bound as a monomer to
A4T4 and A4GT4. No complex is visible for A4GCT4, which is in agreement with the Tm
37 Figure 23. Mass spectrometry with and without methanol. Samples containing 5 μM of each oligonucleotide were tested in 150 mM ammonium acetate with and without 5% methanol (v/v) buffer, with a capillary voltage of 2.5 kV, cone voltage of 30 V, source block temperature of 70° C, desolvation temperature of 100° C, nitrogen as the nebulizing and drying gas, and direct injection at 5 μL/min. Using MassLynx 4.1 software, the observed mass of each equivalent species was multiplied by its charge and the areas were added to give a single peak at the “parent” mass. Ratios are reported as [compound]:[each oligonucleotide]; all samples were prepared from the
same pre-mixed DNA stock solution. DB232 bound as a monomer to A4T4, A4GT4, and
A4GCT4. DB2150 also bound as a monomer to A4T4, A4GT4, and A4GCT4. In all cases,
the samples tested with 5% methanol resulted in a better signal-to-noise ratio. The
39 Figure 24. Mass spectrometry results for DB334, DB2120, DB2232, and DB2238. Samples containing 5 μM of each oligonucleotide were tested in 150 mM ammonium acetate/5% methanol (v/v) buffer with a capillary voltage of 2.5 kV, cone voltage of 30 V, source block temperature of 70° C, desolvation temperature of 100° C, nitrogen as the nebulizing and drying gas, and direct injection at 5 μL/min. Using MassLynx 4.1
software, the observed mass of each equivalent species was multiplied by its charge and the areas were added to give a single peak at the “parent” mass. Ratios are reported as [compound]:[each oligonucleotide]; all samples were prepared from the
same pre-mixed DNA stock solution. DB334 bound as a monomer to A4T4 and A4GT4,
but no complex was visible with A4GCT4. DB2120 bound as a monomer to A4GT4, but
no complex was visible with A4T4 or A4GCT4. This is in agreement with the selectivity of
DB2120 shown via thermal melting experiments. DB2232 bound as a monomer to A4T4,
A4GT4, and A4GCT4. DB2238 bound as a monomer to A4GT4 and A4T4, but no complex
40 Table 4: Summary of mass spectrometry results. Samples containing 5 μM of each oligonucleotide and a 6:1 ratio of [compound]:[each oligonucleotide] were tested in 150 mM ammonium acetate with or without 5% methanol (v/v) buffer. “1:1” indicates
monomeric binding; “0 “ indicates that no complex was formed. Monomeric complexes
were observed for DB224 with A4T4 and A4GT4; for DB232 with A4T4, A4GT4, and
A4GCT4; for DB334 with A4T4 and A4GT4; for DB2120 with A4GT4; for DB2150 with A4T4,
A4GT4, and A4GCT4; for DB2232 with A4T4, A4GT4, and A4GCT4; and for DB2238 with
A4T4 and A4GT4. No 2:1 complexes were observed.
3.5 SURFACE PLASMON RESONANCE
Surface plasmon resonance studies were performed for determination of binding
constants. Several compounds were tested via SPR with HEPES buffer; however, these
large compounds resulted in significant streptavidin-surface binding. MES buffer gave
better results for a few cases, and was used instead for all surface plasmon resonance
studies. Many of the compounds in Groups I and II were tested in this manner, but most
resulted in unpresentable sensorgams due to streptavidin-surface binding, aggregation,
and general “sticky” compound properties.
A4T4 A4GT4 A4GCT4
DB224 1:1 1:1 0
DB232 1:1 1:1 1:1
DB334 1:1 1:1 0
DB2120 0 1:1 0
DB2150 1:1 1:1 1:1
DB2232 1:1 1:1 1:1
41 Figure 25. SPR Sensorgrams for DB2150. Samples were prepared and tested in pH 6.2 MES buffer (0.005% P20, v/v) at various ratios from 5 nM to 500 nM. Data was collected using a Biacore 2000 optical biosensor instrument.
Figure 26. SPR Steady-State Fits for DB2150. Samples were prepared and tested in pH 6.2 MES buffer (0.005% P20, v/v) at various ratios from 5 nM to 500 nM. Data was collected using a Biacore 2000 optical biosensor instrument. DB2150 bound with similar affinity to A4T4, A4GT4, and A4GCT4, with binding constants of 7.1 x 10⁷, 6.4 x 10⁷, and
average binding constant of 9.1 x 10⁶ respectively. The dimeric binding to A4GCT4
[image:53.612.79.538.341.500.2]42 MOLECULAR MODELING
N
NH
NH2 HN
N N
DB224
HN N
H2N NH
N
NH
NH HN
N N
DB232
HN N
HN NH
O
HN N N
NH
H2N NH2
HN DB321 NH
O
HN N N
NH
DB322
HN NH
NH HN
O HN
N N
NH
HN NH
HN DB323 NH
O
HN N N
NH
HN NH
[image:54.612.78.529.85.601.2]HN DB334 NH
Figure 27. Electrostatic potential maps for minimum energy conformers of DB224, DB321, and analogs. Maps were generated by Spartan ’04 using a Hartree-Fock
model with a 6-31G* basis set to determine the conformation with Emin. Red indicates
43 N
N H NH2 HN
N
N
H NH
2 NH
DB496
N
N H H
N
NH
N
N H
H N
NH
DB325
N
N H NH2 HN
N
N
H NH
2 NH
DB510
N
N H H
N
NH
N
N H
H N
NH
[image:55.612.81.537.73.326.2]DB462
Figure 28. Electrostatic potential maps for minimum energy conformers of DB496, DB510, and analogs. Maps were generated by Spartan ’04 using a Hartree-Fock
model with a 6-31G* basis set to determine the conformation with Emin. Red indicates
44 N
NH
NH2 HN
N N
HN N
H2N NH O
DB2239
N
NH
NH2 HN
N N
HN N
H2N NH O
DB2240
N
NH
NH2 HN
N N
N N
HN N
H2N NH O
DB2260
N
NH
NH2 HN
H N HN
HN N
H2N NH O
[image:56.612.79.544.69.382.2]DB2265
Figure 29. Electrostatic potential maps for minimum energy conformers of selected Group I compounds. Maps were generated by Spartan ’04 using a
Hartree-Fock model with a 6-31G* basis set to determine the conformation with Emin. Red
45 N
N
NH2 HN
N
N
H2N NH
O O
DB2247
CH3 H3C
N
NH
NH2 HN
N
HN
H2N NH
O O
DB2232
N
N
NH2 HN
N
N
H2N NH
O O
DB2237
CH3 CH3
N
N
NH2 HN
N
HN
H2N NH
O O
DB2238
[image:57.612.81.540.108.379.2]CH3
Figure 31. Electrostatic potential maps for minimum energy conformers of DB2232 and analogs. Maps were generated by Spartan ’04 using a Hartree-Fock
model with a 6-31G* basis set to determine the conformation with Emin. Red indicates
46 N
NH
NH2
HN
N
HN
H2N
NH
O O
DB2119
N
NH
NH2 HN
N
HN
H2N
NH
O O
N
DB2120
N
NH
NH2
HN
N
HN
H2N NH
O O
CH3
DB2148
N
NH
NH2
HN
N
HN
H2N
NH
O O
DB2150 N CH3
N
N H NH2 HN
N
N
H NH
2
NH
O N O
[image:58.612.79.536.74.390.2]DB2201
Figure 32. Electrostatic potential maps for minimum energy conformers of selected Group II compounds Maps were generated by Spartan ’04 using a
Hartree-Fock model with a 6-31G* basis set to determine the conformation with Emin. Red
indicates regions of negative electrostatic potential, green indicates hydrophobic regions, and blue indicates regions of positive electrostatic potential. DB2119 and DB2120 have different minimized conformations despite their structural similarity. DB2148 and DB2119 both show the central ring twisted out of the plane created by the flanking groups. DB2150 was modeled as a trication, and as such has enhanced electropositive potential. The model of DB2201 shows a conformation inconsistent with typical minor groove binders due to the geometry of the ether linkages. This
47
4 DISCUSSION
4.1 DNA Microstructure
Poly-dA oligonucleotides such as A4T4 are more highly curved than mixed
sequences.4-5 The minor groove narrows relative to sequences containing GC BPs,16
but less so for sequences containing multiple AT steps.6 The bases also take on a
propeller twist in A-tracts.4, 16 The narrowed minor groove allows stronger contacts with
groove-binders and greater negative electrostatic potential.4-6 The combination of these
forces accounts for the overarching binding preferences evident most clearly in Group I
compounds.
Since mixed A-T sequences take on A-tract characteristics to a lesser extent,
compounds with a high affinity for A4T4 bind to (AT)4 with a lower K and a less favorable
ΔG. Alternating A-T sequences also tend to have overwound helices compared to
mixed sequence B-DNA, which has a helix repeat of about 10.5 BPs per turn.4-5, 17 In
the case of poly-dAT or poly-dAAT sequences, a D-DNA has been observed, which has
a helix repeat of about 8 BPs per turn; but alternating A-T sequences are quite
polymorphic. None of the compounds tested were able to bind to the (AT)4 sequence
with much success. Introduction of GC base pairs in the middle of the binding region
causes the DNA to adopt a wider minor groove and a more regular curvature, a bad fit
for conformationally locked compounds. A longer linker could solve this problem;
however, some structural rigidity should be maintained if the compound is to be
48
The ΔTm results indicate that the sequence A4GCT4 is quite different from A4GT4
and A4CT4, which have many similarities with A4T4. Two GC BPs effectively disrupt the
A-tract curvature and present a large steric hindrance to binding in the form of exocyclic
amines in the minor groove. Most of the compounds tested did not bind well to the A4
single-site control sequence in the minor groove, which indicates that the longer,
two-site binding sequence is required. The (AAG)3 site was also challenging to recognize.
Having only two AT BPs on either side of a GC BP decreased minor groove
electrostatic potential and binding affinity of compounds. Once a successful paradigm is
developed for GC recognition, such a complex sequence should be recognizable.
4.2 Group I Compounds
Minor groove binders typically have a characteristic crescent shape,4 a motif that
holds true for many of the examined compounds. Evident from the molecular models
(Figures 28-32), many of the relatively rigid compounds in Group I are slightly more
curved than most. Their limited accessible conformations cause tighter than normal
curvatures, providing the physical basis for these compounds’ specificity of binding.
Binding of any ligand to the minor groove is expected to decrease the number of
available conformations accessible to the DNA. It follows that a more conformationally
limited ligand will result in a more conformationally limited complex, and that a more
rigid compound could mean a greater entropic loss by DNA upon binding. However, this
conformational entropic loss should be somewhat offset by the release of water from the
49
Compounds in Group I which were able to significantly bind to A4GT4 and A4CT4
( Tm > 10 ºC) did so with a similar or lessened affinity compared to A4T4, indicating that
the hydrogen bond acceptors in the linker region are most likely not binding to the
amine of guanine. Interestingly, the larger compounds from Group I, such as DB232
and DB321, showed very low affinity for smaller sequences such as A4. Again, this
selectivity suggests the two-site binding mode for these compounds. Also, since DB321
could bind well to A3CT3 but not to A3T3, this particular compound may require a binding
site at least seven base pairs long. DB2147 bound well only to the A4T4 sequence. This
compound is extremely curved, so the inclusion of even one GC base pair may have
relaxed the minor groove curvature enough to make DB2147 a bad fit.
The terminal amidine-isopropyl or amidine-cyclopentane analogs (DB232,
DB322, DB235, DB334, and DB462) bound with a greater thermal melting point
elevation than their parent, terminal-amidine compounds (DB224, DB321, DB496, and
DB510). These analogs, containing non-polar amidine extensions, experience
increased binding in a non-specific manner. Such an inclusion would likely do the same
for many minor groove binders. Shown in Figure 13, the CD of DB232 with A4T4
saturated at a much lower ratio than did DB224 (Table 3), again, suggesting increased
binding affinity. Although DB510 is extremely close in structure to DB462, it showed
very little change in thermal melting temperature for any sequence, indicating that the
flanking isopropyl groups are essential to the binding of this structure. Likewise, DB496
showed almost no binding affinity, whereas DB325 dramatically increased the thermal
melting temperature of many sequences. This increased DNA affinity is most likely due
50 deoxyribose of the DNA. The increased van der Waals surfaces can clearly be seen
from the electrostatic potential maps. The molecular models also suggest that the
positive charge on the amidine groups becomes partially dispersed through the
non-polar extensions. Such a change may decrease the Gibb’s energy necessary for
compound dissolution for DB224 and DB321, as the interaction between the positive
terminals and the central hydrogen bond acceptor would be decreased. Indeed, the
circular dichrosim results for DB321 (Figure 14) and DB334 (Figure 15) as well as the
thermal melting results for DB224 and DB232 with A4T4 (Figure 8) suggest that the
inclusion of terminal cyclopentane groups may have decreased stacking effects.
Specifically, the inclusion of terminal cyclopentane groups in DB334 eliminated the need
to anneal between CD titrations, shown for DB321 in Figure 14.
The molecular modeling results suggest that many of the linkers, designed to
accept a hydrogen bond from guanine, may actually be shielded within the molecule
and inaccessible due to the flanking phenyl rings. Because of this structural feature,
DB2239 and DB2240 were synthesized and are notable exceptions, with the carbonyl
group protruding to a more easily accessible location. DB2240, which contains a
six-membered central ring, is a stronger binding compound than DB2239, which contains a
five-membered central ring. The models show that the change from a six-membered to
a five-membered central ring has a profound effect on the geometry of the ligand, with
the central ring of DB2239 lying in the plane created by the flanking
phenyl-benzimidazole groups, and the central ring of DB2240 twisting out of the plane created
by the flanking phenyl-benzimidazole groups. This structural difference can clearly
51 the accessibility of a hydrogen bond acceptor group. A comparison between DB323 and
DB334 indicates that the phenyl ring does contribute significantly to binding for all
sequences except A4; however, this ring probably interacts in a weakly specific manner
to AT BPs, and presents a structural feature that may be changed for greater specificity.
By replacing the phenyl with a smaller group, such as an alkyl ether, ethyl, or amide,
other hydrogen bond accepting groups could become available. The replacement of the
phenyl groups in DB2240 by pyridine groups in DB2260 causes an increase in binding,
notably to the A4GCT4 sequence. This may be due to decreased steric hindrance, as
adjacent hydrogens of the phenyl groups which face the minor groove are effectively
eliminated with this substitution.
4.3 Group II Compounds
Thermal melting results suggest that Group II compounds generally do not bind
as well as Group I compounds to the favored sequences. Perhaps due to increased
flexibility and ability to fold back on themselves, many Group II compounds also appear
to be more able to accommodate the single site sequence when compared to the
two-site sequences containing one GC BP. For example, DB2150, DB2232, DB2237,
DB2238, and DB2246 all elevate the thermal melting point of the A4GT4 sequence only
4-7 ºC more than the A4 sequence, compared to DB224, DB232, DB321, DB322, and
DB334, which elevate the A4GT4 sequence 15-21 ºC more than the A4 sequence. The
ability to take on a secondary binding mode where each AT site accommodates one
52 DB2148 is one interesting exception to this lack of selectivity. Perhaps due to the
electrostatic potential of the DNA sequences, this compound does not bind well to any
sequence other than A4T4, A4GT4 and A4CT4. DB2119 exhibits similar selectivity;
however, the analog DB2120 is strikingly selective for sequences with a single G or C,
elevating the thermal melting point of A4GT4 and A4CT4 over 21 °C. The molecular
modeling results for DB2119 and DB2120 (Figure 32) indicate significantly different
minimized structures, with the central phenyl of DB2119 twisting out of the plane
created by the flanking phenyl-benzimidazole groups, and the central pyridine of
DB2120 lying in plane with the flanking phenyl-benzimidazole groups. This is likely a
contributing factor to their differences in selectivity. Although DB2120 shows significant
binding to the A4T4 sequence (ΔTm of 15 °C), this compound is an excellent lead for the
development of linkers capable of recognizing one or two GC BPs. DB2120 combines a
central aromatic ring with flexible linkers, which perhaps allow the adjacent hydrogens
of the phenyl groups enough room to prevent steric clashes.
DB2150 binds with a similar affinity to A4T4 and A4GT4, and with a slightly
lessened binding affinity to A4GCT4. These SPR results are reinforced by the ΔTm
results; however, the mass spectrometry and SPR results are not in good agreement as
to the stoichiometry of the DB2150 and A4GCT4 complex (Figures 23 and 26). Mass
spectrometry indicates a 1:1 complex, while SPR indicates a 2:1 complex. This
discrepancy can be explained by the negative cooperativity shown via SPR. Since the
first binding constant is significantly higher than the second, the second molecule may
be binding through non-specific interactions. DB2150 is assumed to be a trication in
53 using ESI mass spectrometry. The monomeric complex would be more stable, thus
visible by mass spectrometry.
The N-CH3 substituted benzimidazole analogs of DB2232 were developed in an
effort to understand the effects of the protonation states of the benzimidazoles on
affinity and selectivity. The results suggest no change in selectivity, only decreases in
binding most likely due to steric effects and a loss in the ability to act as hydrogen bond
donors. Interestingly, the mass spectrometry results for DB2232 (Figure 24) show only
monomeric complexes with A4T4, A4GT4, and A4GCT4. This is in stark contrast with a
previously reported dimer that forms with the sequence AATTGCAATT.18 The proposed
binding model involved RT546 (DB2232) folding back on itself and binding one folded
molecule to each AATT site. Because the minor groove of AATT sites is wider relative
to A4 sites, DB2232 may not be able to fit in such a narrowed minor groove when folded
back. The discrepancy between the monomeric and dimeric results may arise from
specific properties inherent with flanking A4 sites; perhaps this tightened minor groove
must be wedged apart for even monomeric binding to occur.
4.4 Group III Compounds
The symmetrical Group III compounds (DB1746, DB1747, and DB2289) proved
to be poor binders of any sequences tested. This suggests that the
phenyl-benzimidazole-amidine terminals are much preferred to the
phenyl-furan-phenyl-amidine terminals. However, the results from DB1791 indicate that the inclusion of at
least one phenyl-furan-phenyl-amidine terminal does have potential as a structural