ScholarWorks @ Georgia State University
ScholarWorks @ Georgia State University
Biology Theses Department of Biology
Summer 7-12-2010
Subcloning, Expression, and Enzymatic Study of PRMT5
Subcloning, Expression, and Enzymatic Study of PRMT5
Ran Guo
Georgia State University
Follow this and additional works at: https://scholarworks.gsu.edu/biology_theses Part of the Biology Commons
Recommended Citation Recommended Citation
Guo, Ran, "Subcloning, Expression, and Enzymatic Study of PRMT5." Thesis, Georgia State University, 2010.
https://scholarworks.gsu.edu/biology_theses/26
This Thesis is brought to you for free and open access by the Department of Biology at ScholarWorks @ Georgia State University. It has been accepted for inclusion in Biology Theses by an authorized administrator of
SUBCLONING, EXPRESSION, AND ENZYMATIC STUDY OF PRMT5
by
RAN GUO
Under the Direction of Yujun George Zheng
ABSTRACT
Protein arginine methyltransferases (PRMTs) mediate the transfer of methyl groups to
arginine residues in histone and non-histone proteins. PRMT5 is an important member of PRMTs
which symmetrically dimethylates arginine 8 in histone H3 (H3R8) and arginine 3 in histone H4
(H4R3). PRMT5 was reported to inhibit some tumor suppressors in leukemia and lymphoma
cells and regulate p53 gene, through affecting the promoter of p53. Through methylation of
H4R3, PRMT5 can recruit DNA-methyltransferase 3A (DNMT3A) which regulates gene
transcription. All the above suggest that PRMT5 has an important function of suppressing cell
greatly enhanced the yield and quality of the recombinant PRMT5. In addition, mutagenesis and
enzymatic studies implicate an interesting mechanism of PRMT5 activity regulation.
by
RAN GUO
A Thesis Submitted in Partial Fulfillment of the Degree of
Master of Science
in the College of Arts and Sciences
Georgia State University
Copyright by Ran Guo
by
RAN GUO
Committee Chair: Yujun George Zheng
Committee: Zhi-Ren Liu
Parjit Kaur
Electronic Version Approved:
Office of Graduate Studies
College of Arts and Sciences
Georgia State University
ACKNOWLEDGEMENTS
First, I would like to thank Dr. Yujun George Zheng who is my thesis advisor. He gave me a
lot of encouragement and instruction for the thesis research.
Secondly, the colleagues in the laboratory supported me so much during my research. I
would like particularly to thank Chao Yang, Juxian Wang, Nan Xie, Jiang Wu, Yutao Yang, You
Feng and James Kurasawa, who helped me when I met experimental problems. I also want to
thank Dr. Zhi-Ren Liu and Dr. Parjit Kaur who are my committee members and gave me helpful
suggestions.
Finally, this research project is supported by Georgia Cancer Coalition Distinguished Cancer
TABLE OF CONTENTS
ACKNOWLEDGEMENTS……….….…..iv
LIST OF TABLES..………..…………...ix
LIST OF FIGURES………...xii
LIST OF ABBREVIATIONS……….……….….…xvi
Chapter 1. Background and Introduction……….………..………...1
2. Experimental Methods……….…….9
2.1 PCR Reaction to Amplify Target Gene……….………....9
2.2 Gel Extraction with Q1Aquick Gel Extraction Kit Protocol………..10
2.3 Restriction Digestion for Cutting the Target Gene and Vector………...…11
2.4 DNA Ligation of Gene and Vector……….……….…....12
2.5 Transformation for Using Bacteria to amplify Constructed Plasmids…………12
2.6 Expression of His-tagged Protein………..…….14
2.7 Radioactive Assay for Activity Test………...………….……17
2.8 General Radioactive Assay Text………...…….18
2.9 Quickchange to Make Truncated PRMT5 Gene/Protein……….…....19
3. Subcloning of PRMT5 Gene into an Expression Vector………...…21
3.1 Subcloning PRMT5 into PGEX4T1………..…..………..…..21
3.1a PCR Experiments……….………...…..21
3.1b Restriction Digestion of PRMT5 and pGEX4T1………...22
3.1c DNA Ligation to Rebuild the Plasmids……..……….…..23
3.1d Transformation of the Recombinant Plasmid into XL1 Blue Bacteria....24
3.2 Subcloning shPRMT5 into pTXB1 and pET28a………..…...26
3.2a Preparation shPRMT5 from puc57-shPRMT5 Plasmid………26
3.2b Insertion of shPRMT5 into pTXB1 and pET28a……….…………...…27
3.3 Subcloning shPRMT5 into pTXB1………..………...…………...…..30
4. Expression of His-Tagged shPRMT5 Protein ………..………...…32
5. Enzymatic Activity of shPRMT5………...…35
5.1 Radioactive Assay of His-tagged shPRMT5………...…...36
5.3 Radioactive Assay of Degraded shPRMT5……….………....…....37
5.4 FPLC of shPRMT5……….…...….40
5.5 Radioactive Assay of Different Protein from shPRMT5 on H4-20...41
6. Mutagenesis of shPRMT5………..…....…..46
6.1 Quickchange Reaction to delete 1-50 Amino Acids at the N-terminal End of shPRMT5………..…...…46
6.2 Quickchange Reaction to delete 1-200 Amino Acids at the N-terminal End of shPRMT5 ………..…...….48
7. Expression and Enzymatic Test of Truncated shPRMT5………...…..50
7.1 Expression of Truncated shPRMT5 in BL21 (DE3)………..…….50
7.2 Radioactive Assay of Truncated shPRMT5………...…...51
8. Bioinformatic Study of PRMT5……….…...….55
8.1 Blast Search of PRMT5………...….55
8.2 CLUSTAl W2 analysis of PRMT5, PRMT1, PRMT3 and CARM1…………...56
8.3 Pattern VLMVLGAGRGPLV in Prosite Server to Figure out the SAH/SAM Binding Site Position………...…..56
8.4 Predict the Structure of PRMT5 SAH/SAM Binding Site………...…57
9. Conclusions and Discussion………....………..….…..60
LIST OF TABLES
Table 1. Composition of the PCR reaction samples………..…10
Table 2. Composition of the digestion reaction of target gene and vector………...12
Table 3. Component of Bradford protein concentration system measurement………....….16
Table4. Composition of the radioactive assay in different substrate concentrations ……..…....18
Table 5. Composition of the general radioactive assay………...………..…....19
Table 6. Quickchange PCR reaction system………..……….…….…….20
Table 7. Quickchange PCR Program………..……….………..……20
Table 8. Calculations of the concentration and molecular weight (MW) of PRMT5, pTXB1 and pET28a………...….…..27
Table 9. Setup of ligation reaction……….……..…..28
Table 10. General test of shPRMT5 activity on H4-20 and H3-20……….….….35
Table 11. Results of activity assay of shPRMT5 on H4-20 and H3-20…….……….…...35
Table 13. Compositions Composition of additional general radioactive assay
of shPRMT5 on H4-20 and H3-20………....…..38
Table 14. Results of additional radioactive assay of shPRMT5
on H4-20 and H3-20………..….…...…38
Table 15. Composition of radioactive assay of different sections of shPRMT5
on H4-20……….………...……...42
Table 16. Results of the five sections of shPRMT5 activity on
H4-20 methylation ………..…………...…………42
Table 17. Results of the five sections of shPRMT5 activity
on H4-20 methylation ……….………...43
Table 18. Results of the activity of 5 group normalized concentrations on H4-20………..…43
Table 19. Composition of radioactive assay of truncated
of shPRMT5 on H4-20…..…….………….………..…..51
Table 20. Results of general test of radioactive assay of truncated PRMT5………...52
Table 22. Results of duplicate general test of radioactive
LIST OF FIGURES
Figure 1. Reaction of PRMT enzyme catalyzed arginine methylation ………..2
Figure 2. The domain structure of PRMT proteins. ………..….3
Figure 3. Nucleosome structure and posttranslational modification…………...………4
Figure 4. Mechanism of PRMT5 and DNMT3A cooperation for inhibition of
transcription of the target gene ………....….…..….7
Figure 5. Process and composition of radioactive assay …………..………...….…..…18
Figure 6. PCR products of PRMT5 DNA ……….…...…22
Figure 7. Checking the ligation efficiency of PRMT5 efficiency with
restriction digestions. ………....……..…..24
Figure 8. Alignment of two sequences for checking the identity …………...…25
Figure 9. SDS-PAGE of expressed of GST-tagged PRMT5………....….…25
Figure 10. Band A is unclear. Band B are puc57-shPRMT5 plasmid. Band C is
Figure 11. DNA bands on a 1% agarose gel for checking the ligation efficiency
of shPRMT5 and pTXB1……….…...29
Figure 12. DNA bands on a 1% agarose gel for checking the ligation efficiency
of shPRMT5 and pET28a ………....…..……..29
Figure 13. DNA bands on a 1% agarose gel for checking the ligation efficiency
of the second sub-cloning attempt of shPRMT5 and pTXB1………....…...31
Figure 14. 12% SDS-PAGE with supernatant, pellets, washing solution
1, 2, 3, 5, 7 samples in upper gel ………...….…33
Figure 15. 12% SDS-PAGE with shPRMT5 protein. It seems that PRMT5
has degraded into two major bands at around 60 kD and 25 kD ………...….34
Figure 16. Radioactivity results for shPRMT5 to H4-20 and H3-20………....……36
Figure 17. 12% SDS-PAGE Gel representation of the shPRMT5. shPRMT5
degraded further and generated multiple bands ………...…37
Figure 18. Radioactivity results for shPRMT5 on H4-20 and H3-20……….….….39
Figure 20. 12% SDS-PAGE gel with different groups of proteins with
different molecular weights separated by FPLC ……….……41
Figure 21. Activity of 5 fractions of the shPRMT5 and original shPRMT5……….……44
Figure 22. 12% SDS-PAGE gel showing the samples after condensation of the different groups of protein and the previous shPMRT5 as the control ………44
Figure 23. Quickchange with PCR reaction products of 51-637 amino acids of PRMT5………...………….47
Figure 24. Quickchange with PCR reaction products of 201-637 amino acids of PRMT5…...49
Figure 25. 12% SDS-PAGE gel showing 51-637 and 201-637 protein after purification……….…………...…51
Figure 26. The CPM values of 51-637, 201-637, full-length shPRMT5 and negative control of shPRMT5.………….……….……….…..…53
Figure 27. BLAST analysis of PRMT5……….……..…..…55
Figure 28. CLUSTAl W2 analysis of PRMT5, PRMT1, PRMT3 and CARM1………...56
Figure 30. PRMT5 SAH binding site position in the prediction structure which use
PRMT1 as a template ………..…….…………58
Figure 31. The arrow pointing to the best docking site of SAH in the prediction
LIST OF ABBREVIATIONS
IPTG Isopropyl β-D-1-thiogalactopyranoside
DTT Dithiothreitol
TAE Tris-acetate-EDTA
SDS-PAGE Sodium dodecyl sulfate polyacrylamide gel electrophoresis
shPRMT5 Synthetic human PRMT5
EtOH Ethyl alcohol
Chapter 1 Background and Introduction
PRMTs (protein arginine methyltransferase) are a group of proteins in mammalian and plant
cells. PRMTs use S-adenosylmethionine (AdoMet/SAM) as a methyl donor in the cells (1) (2).
Different PRMT enzymes share a core conserved region which is around 310 amino acids long
that is involved in the enzymatic reaction. In addition, PRMTs can catalyze the methyl transfer
through various ways to the nitrogen of the terminal guanidine of arginines. Firstly, as shown in
Figure 1, it can transfer a single methyl group to the terminal guanidino nitrogen, namely,
monomethylated arginine (MMA). Secondly, it can transfer two methyl groups symmetrically to
the two nitrogens of the guanidine to form symmetrically dimethylated arginine (SDMA). Lastly,
it can transfer two methyl groups asymmetrically to the same nitrogen of the guanidine to form
NH2
NH H2N
NH O AdoMet SAH AdoMet SAH AdoMet SAH NH NH H2N
NH O CH3 NH NH N H NH O CH3
H3C
N
NH H2N
NH O
CH3
CH3
Type II PRMTs
Type I PRMTs
Symmetric
[image:21.612.92.509.71.332.2]Asymmetric PRMT
Figure 1. Reaction of PRMT enzyme catalyzed arginine methylation.
Because differences in arginine methylation leads to different functions (4), PRMTs are
divided into two types according to whether the second methyl group was asymmetrically (type
I) or symmetrically (type II) added to the nitrogen of arginine as shown in Figure 1. Type I
includes PRMT1, PRMT2, PRMT3, PRMT4, PRMT6, PRMT8 and Type II includes PRMT5,
PRMT7, PRMT9, PRMT10 and PRMT11 (3). PRMTs share a highly conserved domain which is
shown in Figure 2. Additionally, some PRMTs contain other specific motifs, such as SH3, zinc
Figure 2. The domain structure of PRMT proteins. Gray part indicating the highly conserved
PRMT core region, green part indicating the zinc finger in PRMT3 and orange part indicating the
SH3 domain in PRMT2 (5).
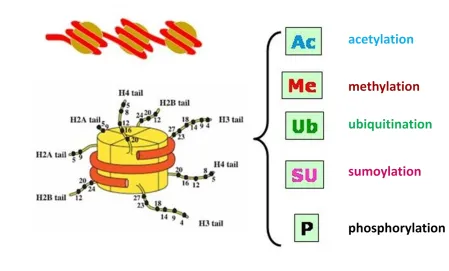
PRMTs belong to a type of posttranslational modification enzymes which transfer methyl
groups to the arginine of histones to regulate gene expression (6). Chromatin is composed of
DNA and histone proteins in which DNA wraps around histones called nucleosomes, which can
be further packed to form chromosomes. Figure 3 illustrates some posttranslational modification
sites on the histone tails of nucleosome. Chromatin regulates gene expression through
modification of histones, which can be altered by different histone modifying enzymes such as
histone acetyltransferse and methyltransferase (3). In histone methylation, the methyl group
transferred usually occurs on arginine and lysine residues, which can change the chromatin
structure to inhibit or stimulate gene transcription. The histone core contains four major highly
conserved histones, H2A, H2B, H3 and H4 with very similar three-dimensional structure, and a
linker subunit H1 that is located of where DNA enters and leaves (7) (8). Two H3 and H4 form a
tetramer and combine with two H2A-H2B dimers to construct the histone octamer. The
left-handed super-helix DNA wraps around the histone octamer (9), so it can be highly compacted to
store long double-stranded DNA into the small nucleus. The histone core wound by supercoiled
DNA is the main part of nuclesomes. Every histone has an amino-terminal tail which extends
that can be methylated to modify the interaction between the histone and DNA (10). H3R8 and
H4R3 are well-known substrates of PRMT5 (11) (12), and H4R3 can also be methylated by
PRMT1 (13). Therefore, to study PRMT5 enzymatic properties, H3R8 and H4R3 are feasible
[image:23.612.65.514.179.450.2]researching element.
Figure 3. Nucleosome structure and posttranslational modification.
In leukemia and lymphoma, PRMT5 was shown to suppress the Retinoblastoma (RB) family
of tumor suppressors through methylating H3R8 and H4R3 at the transcriptional level (14).
Additionally, PRMT2, which catalyzes the asymmetric dimethylation of arginine, also interacts
with the RB protein through the AdoMet-binding domain to form complexes with E2F (15). E2F
is a transcription factor that regulates the cell proliferation-related gene expression (16). p53 is a
critical protein involved in apoptosis of tumors which respond to DNA damage. However,
PRMT5 as a cofactor of p53 can methylate p53 to regulate p53 protein interaction with target
PRMT5 can induce G1 arrest, and consequently inhibit of cell proliferation (19). Through
methylation of H4R3, PRMT5 enzyme has an important function in suppressing cell apoptosis.
A zinc finger is an amino acid sequence motif that interacts with one or several zinc ions to
maintain its structure. A zinc finger usually consists of an α helix and a β sheet and coordinates
with two cysteine and two histidine residues. A KRAB-containing zinc finger is a critical DNA
binding protein with Kruppel-like associated box (KRAB) at the beginning. ZNF224 is a
member of KRAB-ZFP family which includes 19 zinc finger motifs at the C-terminus. PRMT5
can physically coordinate with ZNF224 to form a complex which will be recruited to the L-type
aldolase A promoter to suppress transcription around H4R3 (20). Additionally, Ajuba is a protein
that can repress the zinc finger-protein Snail by recruiting PRMT5 to form complex to silence the
Snail target gene. NR2 (nuclear-receptor binding motifs), which is necessary for binding
PRMT5, is one of the putative nuclear-receptor binding motifs which exist in Ajuba.
Furthermore, PMRT5 was observed to bind to the NR2 motif of Ajuba, which is also the binding
site of RAR (retinoic acid receptors), to inhibit Ajuba/RAR interaction. Thus, PRMT5 seems to
be like a “switch” of Ajuba which can interact with Snail or RARs (21).
In addition, PRMT5 can also generate symmetric dimethylarginine in non-histones proteins.
pICln is a 26 kDa protein which can bind to Sm protein in human cells to regulate the
RNA-splicing. By interacting with the pICln, PRMT5 can stimulate symmetrical dimethylation of the
RG tail which is rich with arginine and glycine at the C terminal end of the Sm protein. However,
this phenomenon inhibits PRMT5 methylation function of histones (22). Other tumor
suppressors could also interact with PMRT5. Furthermore, a cooperator of PRMT5 (COPR5)
was reported to be involved in the function of PRMT5 in vitro and in vivo. COPR5 binds to
regulates the promoter of cyclin E1 (CCNE1) and COPR5 interacts with the amino terminus of
H4 to play a critical role between PRMT5 and the target gene (23).This reveals that PRMT5 has
an additional function of maintaining the structure of certain proteins with methylated arginine.
In addition to GM130, ribosomal protein s10 (RPS10) was reported as a substrate of PRMT5.
PRMT5 catalyzes the methylation of Arg 158 and Arg 160 of ribosome protein RPS10 to
regulate proliferation of the cells (24). Tumor necrosis factor-related apoptosis-inducing ligand
(TRAIL) has activity of selective antitumor suppressing tumors. However, PRMT5, as a TRAIL
receptor-binding protein, binds to receptor 4 and receptor 5 of TNF selectively. Additionally,
PRMT5 can contribute to nuclear factor-kappaB (NF-kappaB) which resistance TRAIL pathway
to inhibit tumor cell necrosis (25). So, PRMT5 prefers to combine with other protein to regulate
target gene indirectly.
CpG sites consist of cytosines which are next to guanines connected by a phosphodiester
bridges.CpG sites are often located in the promoters of genes. The cytosine of CpG sites can be
methylated by DNA methyltransferase to 5-methylcytosine that can silence genes. This reaction
is an epigenetic modification function (26) (27). In addition, previous research showed that
methylated H4R3 by PRMT5 can recruit DNMT3A which is one of DNA methyltransferases to
methylate promoter CpG islands to silence gene transcription (28) (29). Figure 4 illustrates the
mechanism of PRMT5 and DNMT3A regulating function. Therefore, PRMT5 and DNA methyl
transferases might have a coordinated function to mediate gene expression. H4R3Me2 modified
by PRMT5 can support a target for DNMT3A binding to methylate CpG sites. On the other hand,
methyl-CpG-enriched region also can recruit PRMT5 complex to repress transcription. This
Figure 4. Mechanism of PRMT5 and DNMT3A cooperation for inhibition of transcription of the
target gene.
It also shows that the ribosomal RNA gene promoter is regulated by methylated H4R3 and
H3R8 which means PRMT5 not only can regulate RNA polymerase II, but also RNA polymerase
I. H3R8Me2 and H4R3Me2 generate different pathways for suppressing the ribosomal RNA
gene transcription in resting B cells and HeLa cells. Hereby, PRMT5 inhibiting function can
operate in some different genes (11). Histone methylation can not only generate DNA damage,
but also repress transcription (31). Methylation of CpG-rich sequence will prevent transcription
factors from binding, which can play an active role in transcription in the genes (32) (33).
However, another hypothetical pathway to inhibit the gene transcription through DNA
methylation is opposite. Other than repelling the factors, methylated CpG sites can recruit
methyl-CpG-binding domain (MBD) family protein which includes MeCP2 (34), MBD1,
MBD2, MBD3, MBD4 and KAISO without an MBD domain (35). These proteins were observed
to bind methylated DNA and associate with different corepressor to inhibit gene transcription
(36). Therefore, PRMT5 and DNA methyltransferase have a relative function to methylate
histone and DNA to silence the gene transcription at epigenetic level.
Finally, PRMT5 inhibits protein transcription. These proteins usually have direct or indirect
function in tumor cell suppression. Moreover, ribosomal RNA synthesis by RNA polymerase I is
also influenced by PRMT5 (11). Meanwhile, PRMT5 usually associate with other protein to
symmetrical dimethylation occurs on arginine H4R3 and H3R8 of histones which recruits
DNMT3A to the promoter and then methylates CpG sites to inhibit transcription. This is the
Chapter 2 Experimental Methods
2.1 PCR Reaction to Amplify Target Gene
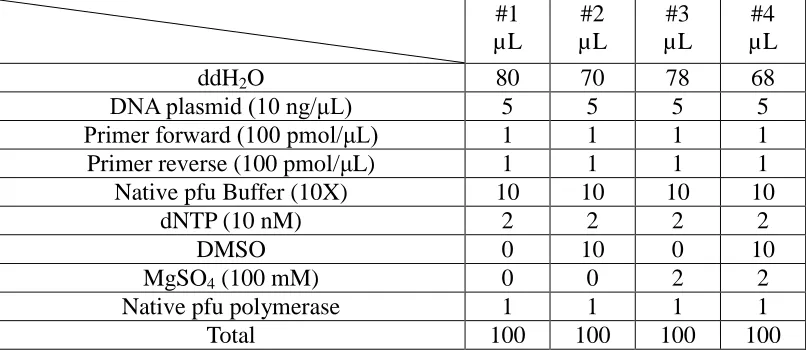
A PCR reaction was set up to amplify the PRMT5 gene. Through PCR, the PRMT5 genes
can be amplified to produce many copies of it for future experiments. Primers are designed
around 12-16 nucleotides which were complementary to each 3’ strand of the DNA templates.
The PCR reaction includes the DNA templates, primers, buffers, dNTP, DMSO, MgSO4, and
DNA Native pfu polymerase, which are required in the system and the volumes of each
component are shown in Table 1. The first step is the denaturation with the temperature set at
94°C for 45 seconds to denature the double stranded DNA by breaking the hydrogen bonds
between the bases. Next, the temperature is decreased to 55°C for 45 seconds to let the primers
anneal to the DNA templates which is called the annealing step. In this step, new hydrogen bonds
form between primers and single strand DNA templates and DNA polymerase binds to the
complex to start DNA replication. The temperature is then lifted to 72°C for 3 minutes to make
the DNA polymerase active to elongate the DNA copies. The system then cycles back to step one
and repeats this 25 times. After the last cycle, the system is set to 72°C for 10 minutes to make
sure the copies of DNA are completely extended and it is then held at 4°C. PCR is the best way
to get lots of DNA from a very small amount efficiently and precisely. When the PCR reaction is
finished, the products will be confirmed as the correct DNA size by gel electrophoresis. The 1%
agarose gel was composed of 300 mL of 1X TAE buffer and 3 g of agarose. To dissolve the
agarose into the 1X TAE buffer, it was heated in a microwave oven for 4 minutes. 8 µL of
fluorescence under ultraviolet (UV) light, is added 20 µL of loading dye is added to the samples
and loaded into the gel, along with a DNA ladder as a reference. The gel with the loaded sample
[image:29.612.68.471.211.386.2]was run at 120 volts for 50 minutes.
Table 1. Composition of the PCR reaction samples.
#1 µL #2 µL #3 µL #4 µL
ddH2O 80 70 78 68
DNA plasmid (10 ng/μL) 5 5 5 5 Primer forward (100 pmol/μL) 1 1 1 1 Primer reverse (100 pmol/μL) 1 1 1 1 Native pfu Buffer (10X) 10 10 10 10
dNTP (10 nM) 2 2 2 2
DMSO 0 10 0 10
MgSO4 (100 mM) 0 0 2 2
Native pfu polymerase 1 1 1 1 Total 100 100 100 100
2.2 Gel Extraction with Q1Aquick Gel Extraction Kit Protocol
The DNA PCR products was cut out from the agarose gel and extracted from the gel through
Gel extraction with the Q1Aquick Gel Extraction Kit Protocol. The DNA products are cut out
and transferred into microcentrifuge tubes, then 900 μL of QG buffer was added to each tube and
kept at 55°C until the gels dissolved. The solution was transferred into a QIAquick column and
centrifuge for 1 minute at 12k rpm. 750 μL of PE washing buffer with EtOH (ethyl alcohol) is
added and incubated at room temperature for 5 minutes. After centrifuging for 1 minute at 12k
rpm and discarding the flowthrough, the samples were centrifuged again at same speed for 1
additional minute. The QIAquick column is then inserted into a 1.5 mL tube and 30 µL ddH2O
tube was centrifuged at the same speed for 1 minute and the DNA concentration was measured
by UV at 260 nm.
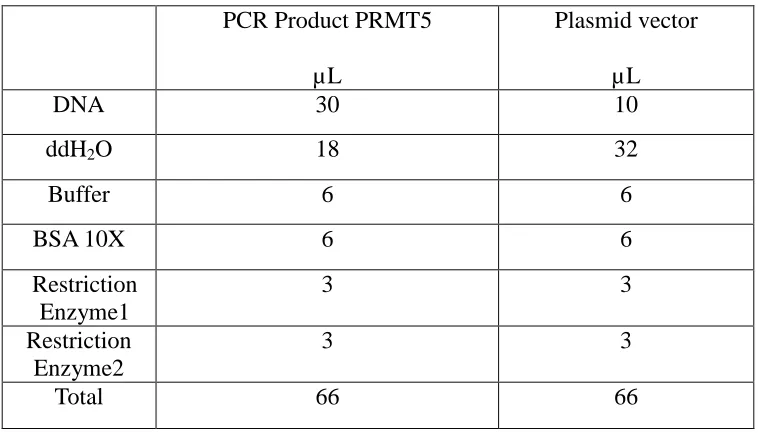
2.3 Restriction Digestion for Cutting the Target Gene and Vector
When adding the components which are in Table 2, ddH2O was added first and enzymes
were added last. Restriction enzymes were kept in a -20°C box to maintain their activity. The
digestions were incubated at 37°C for 3 hours. After the incubation, the DNA plasmids were
purified with the PCR purification kit. From the PCR purification kit, 300 uL of PBI binding
buffer was added to each sample at a 5:1 volume ratio. Then the samples were put in the
Q1Aquick spin columns and centrifuged for 1 minute at top speed. 750 µL of PE buffer
containing EtOH was added into the samples and incubated at room temperature for 5 minutes.
The samples were then centrifuged for 1 minute at top speed, and the flow-through was
discarded after centrifuging again for 1 additional minute. Q1Aquick columns were placed in
sterile 1.5 mL microcentrifuge tubes and 30 µL of ddH2O was added in the center of each
column. After incubating at room temperature for 2 minutes and centrifuged for 1 minute, the
flow-through was collected and the concentration was measured. The PCR product and the
Table 2. Composition of the digestion reaction of target gene and vector.
PCR Product PRMT5
µL
Plasmid vector
µL
DNA 30 10
ddH2O 18 32
Buffer 6 6
BSA 10X 6 6
Restriction Enzyme1
3 3
Restriction Enzyme2
3 3
Total 66 66
2.4 DNA Ligation of Target Gene and Vector
In the experiment, 3 samples are necessary. The ratios of target genes and vectors, both of
which have been digested by restriction enzymes, are 1:1, 3:1 and one negative control sample.
The negative control contains only the vector and it is used to check different growth situation of
bacteria after transformation. Like previously, ddH2O was added first and T4 DNA ligase was
added last and was kept in a -20°C box. The three samples were then reacted at 16°C overnight.
2.5 Transformation for Using Bacteria to Amplify Constructed Plasmids
Three aliquots of 50 µL of XL1-Blue supercompetent cells from the -80°C freezer were put
in their own 1.5 mL eppendorf tube and then thawed on ice for 10 minutes. Then 0.85 µL of
beta-mercaptoethanol (1.4M) was added to each tube and kept on ice for 10 minutes, followed by
ice for 30 minutes. The tubes were then heated at 42°C for 45 seconds and put on ice for 2
additional minutes. 0.5 mL of pre-heated NZY-Broth (NZY-Broth solution is made up of 1 mL
NZY media, 12.5 µL of 1M MgCl2, 12.5 µL of 1M MgSO4, 20 µL of 20% glucose) was added to
each tube. The tubes were incubated at 37°C for 1 hour with rotation (rotation of 225 rpm).Agar
plates were pre-warmed at 37°C for 1 hour.50 µL of the mixed solution is added to an agar plate.
The rest of the solution was centrifuged at 5000 rpm for 1 minute at room temperature. Most of
the supernatant was discarded and the remaining solution, which is about 50-100 µL, was gently
mixed and applied to another agar plate.Around 7 beads were added on the plates and the plates
were then shaken to let the bacteria distribute uniformly on the surface of the agar. Beads were
then poured out and the plates (1:1 A and B plates 3:1 A and B plates and Control A and B plates)
were put in the incubator at 37°C overnight. The following day, the agar plates were taken out
and checked for bacteria colonies. The agar plates were then sealed and stored at 4°C. In the
afternoon of the same day, ten (5 from 1:1 and 5 from 3:1) colonies were chosen and incubated
in 8 mL of LB media with ampicilin (AMP) or kanamycine (Kana) antibiotics. Then, the tubes
with LB media were put into the incubator at 37°C overnight with rotation at 225 rpm. The next
day, the bacterial cultures were taken out of the incubator and 20 µL of the LB culture media was
kept from each sample as seeds and stored at 4°C. The culture tubes were centrifuged at 3000
rpm for 10 minutes at 4°C to discard supernatant. Cell pellets were resuspended thoroughly with
250 µL of Cell Resuspension Solution. The solution was then transferred to 1.5 mL tubes and
250 µL of Cell Lysis solution was added to each sample and inverted 4 times inverted to mix. 10
µL of Akaline Protease Solution was then added and inverted 4 times to mix. The solution was
incubated at room temperature for 5 minutes. Then 350 µL of Neutralization Solution was added
temperature. Spin columns were inserted into collection tubes and the cleared lysate was
decanted into the Spin Columns and centrifuged at top speed for 1 minute at room temperature.
Flowthrough was discarded and columns are reinserted into collection tubes. 750 uL of wash
solution (ethanol added) was added in the solution and centrifuged at top speed for 1 minute.
Flowthrough was removed and the column was reinserted into collection tubes and 250 uL of
wash solution was added into the columns. After centrifuging, the flowthrough was discarded
and centrifuged for additional 2 minutes. The Spin columns were transferred to sterile 1.5 mL
micrcentrifuge tubes and 40 uL of nuclease-free water is added into the spin columns. The tubes
were centrifuged at top speed for 1 minute at room temperature and the flowthrough containing
the DNA plasmid was collected.
2.6 Expression of His-tagged Protein
First, DNA plasmid was transformed into BL21 (DE3), and two colonies were chosen for
LB culture overnight. Then LB media culture with bacteria is poured in two flasks, each with 1 L
of LB media with Kana or AMP antibiotics. The culture tubes were then put in the 37°C
incubator with shaking at 225 rpm. Two hours later, the O.D. values of the media in the flasks
were checked every 10 minutes until the value was in the range of 0.6 to 0.8. The flasks were
then taken out and cooled down in the 4°C refrigerator. When the flasks were cooled, 0.3 mL of
IPTG (1 M) was added into flasks and shaken at 255 rpm in 16 °C overnight. On the second day,
to get the pellets, each 1 L of culture liquid was centrifuged in three 500 mL bottles at 5000 rpm
for 10 minutes in 4°C. Then the supernatant was discarded and the pellets were resuspended with
30 mL Ni-lysis-buffer and the resuspended cells were frozen with liquid N2 and stored at -80°C.
for 10 minutes, and then the sample was put through the French Press twice with sample coming
out drop by drop. The cell lysate was centrifuged immediately for 30 minutes at 14000 rpm at
4°C. 20 µL of supernatant was saved for SDS-PAGE later on. A column with 5 mL of Ni-beads is
prepared and washed with 50 mL 1X column equilibrium buffer 5 times. The supernatant of
PRMT5 after the French-press was loaded onto the beads and shaking for 1 hour. The beads with
the enzyme bound were washed with 50 mL of column equilibrium buffer twice. Then the beads
need to be washed with 10 mL of washing buffer 10 times. The washing solution was collected
in 8 tubes. Afterwards, the beads need to be washed with 8 mL of elution buffer which washed
the PRMT5 out of the and the eluted solution is collected into 6 separate collection tubes. Then
20 µL of the beads were taken out to check on a SDS-PAGE gel. A 12% SDS gel is appropriate
for PRMT5. The supernatant and pellets from the French-press, beads before binding, 5 washing
samples, 6 elution samples and beads after elution are loaded onto the SDS-PAGE gel. For the
solution and supernatant samples, 5 µL of 5X loading dye was added into 20 µL of samples and
for the beads and pellets, 80 µL of H2O and 20 µL of 5X loading dye were added. Then every
tube was heated at 100°C for 10 minutes and run on the SDS-PAGE at 200 V. When the blue
frontline from the dye arrives at the bottom line, the SDS-PAGE was stopped. The gels were
transferred to staining solution and shaken overnight. The next morning, the gels are destained
for about 5 hours. Meanwhile, all elution buffers needed to be combined together and
centrifuged. During the centrifuging, the storage buffer was added into the protein 3 times to
change the buffer making the protein stable. When the final solution volume was around 1 mL,
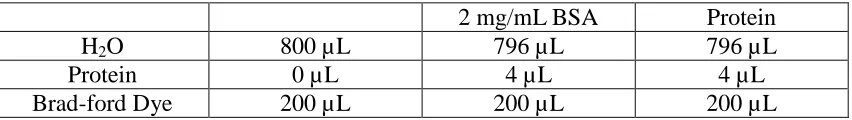
Table 3. Components of Bradford protein concentration measurement.
2 mg/mL BSA Protein
H2O 800 µL 796 µL 796 µL
Protein 0 µL 4 µL 4 µL
Brad-ford Dye 200 µL 200 µL 200 µL
One tube of H2O, three tubes of BSA and three tubes of protein was prepared as shown in
Table 3 above. The Brad-ford dye was added every 30 seconds between two tubes. Sample H2O,
BSA 1, BSA 2, BSA 3, Protein 1, Protein 2 and Protein 3 needed to be checked by UV at O.D.
595 nm. The final concentration of the protein was [Average Protein (595 nm)/Average BSA
(595 nm)]*2 mg/mL.
Ni-Lysis buffer (Na-HEPES 25 mM PH 7.0, NaCl 500 mM, MgSO4 1 mM, Glycerol 10%,
PMSF (Phenylmethylsulfonyl fluoride) 1mM with prepared fresh)
Column equilibrium buffer (Na-HEPES 25 mM PH 7.0, NaCl 500 mM, Glycerol 10%,
Imidazole 30 mM, PMSF 1 mM with prepared fresh)
Column washing buffer (Na-HEPES 25 mM PH 7.0, NaCl 500 mM, Glycerol 10%, Imidazole
70 mM, PMSF 1 mM with prepared fresh)
Elution buffer (Na-HEPES 25 mM PH 7.0, NaCl 500 mM, Glycerol 10%, Imidazole 200 mM,
NaCl 500 mM, EDTA 100 mM)
Storage buffer (HEPES 25 mM PH 7.0, NaCl 500 mM, Glycerol 10%, NaCl 500 mM, EDTA
2.7 Radioactive Assay for Activity Test
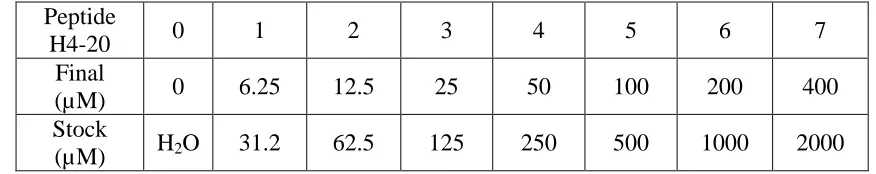
PRMT5 was always kept on ice. Peptide H4-20 (the first 20-amino acid peptides in histone
H4) was prepared for 7 samples from Sample 1 to Sample 7 with an increasing final
concentration of 6.25 µM, 12.5 µM, 25 µM, 50 µM, 100 µM, 200 µM, 400 µM as shown in
Table 4. A mix solution composed of 13 µL of 14C labeled AdoMet (400 µM), 200 µL of 2XRB (
HEPES: 100 mM PH 8.0, NaCl 100 mM, EDTA 2 mM, DTT 2 mM) and 87 µL of H2O was also
prepared. 18 µL of this solution was added into the 7 samples with different concentrations of
H4-20 and H2O every 30 seconds. After 5 minutes of, 6 µL of PRMT5 (2 µM) was added to
sample 1 through sample 7 every 30 seconds. All the samples were kept in 30°C and the total
reaction time after adding the enzyme was 45 minutes. When the reaction was completed, 20 µL
of the solution was taken from every sample and loaded onto P81 paper separately. The
remaining solutions were combined together and 20 µL of the mixture was taken and loaded onto
three P81 papers. All the P81 papers were dried in the room temperature for 30 minutes and then
sample 0-7 were washed by 1L of NaHCO3 (50 mM PH 9.0) for 12 minutes, three times. The
P81 papers loaded with the mixed sample solution do not wash. After washing, all the P81 paper
including sample 1-7 and the three mixtures were put in separate 20 mL disposable scintillation
vials and dried in the incubator overnight. A duplicate group of the whole experiment reaction
was also done. The next day, 10 mL of scintillation liquid was added into the vials and covered
with lids. Then the vials were then put into the scintillation machine to measure the CPM value
Figure 5. Process and composition of radioactive assay.
Table 4. Composition of the radioactive assay in different substrate concentrations.
Peptide
H4-20 0 1 2 3 4 5 6 7
Final
(µM) 0 6.25 12.5 25 50 100 200 400 Stock
(µM) H2O 31.2 62.5 125 250 500 1000 2000
2.8 General Radioactive Assay Test
In some cases, proving whether the PRMT5 has activity on H4-20 and H3-20 (the first
20-amino-acid peptides in histone H3) is a priority in addition to figuring out the specific
enzymatic properties. Then a consistent concentration of substrate can be applied, with the
Table 5. Composition of the general radioactive assay
H2O 2XRB Peptide AdoMet Protein Total
H4-20 0 µL 20 µL 7 µL 3 µL 10 µL 40 µL
H3-20 5.6 µL 20 µL 1.4 µL 3 µL 10 µL 40 µL
Control 7 µL 20 µL __ 3 µL 10 µL 40 µL
Reaction time was 1-24 hours. The final concentration of H4-20 and H3-20 was 350 µM.
AdoMet concentration was 30 µM. Protein concentration was flexible. 30 µL of the total solution
was loaded onto P81 papers. After washing for 30 minutes and completely dried, the P81 papers
were sent for scintillation. This general test of radioactive assay was straightforward and
convenient for figuring out if the proteins have activity to the substrates. This simplified method
focuses on the preliminary study of a protein to a substrate.
2.9 Quickchange to Make Truncated PRMT5 Gene/Protein
For the quickchange PCR, the components are shown in Table 6. The PCR program is
shown in Table 7. After the PCR, 10 µL of the product was checked for amplification efficiency
on a 1% agarose gel. If a single band was present in the right position, this indicated the
efficiency was good. 1 µL of Dpn I was added to the remaining 40 µL of PCR product with
gentle mixing and then centrifuged for 1 minute at 5000 rpm. The solution is then incubated in
37°C for 1 hour and 1 µL of the solution was used for transformation into XL1-Blue
supercompetent cells for amplification. Three colonies were picked and the DNA is extracted to
Table 6. Quickchange PCR reaction system.
#1
uL
#2
uL
#3
uL
ddH2O 36 35 32
DNA Template (20 ng/μL) 1 2 5 Primer forward (40 ng/μL) 3 3 3 Primer reverse (40 ng/μL) 3 3 3 Native plus Buffer (10X) 5 5 5
dNTP (10 mM) 1 1 1
Pfu native polymerase 1 1 1
Total 50 50 50
Table 7. Quickchange PCR program.
T(°C) Time
1 95 10 min
2 95 30 s
3 55 1 min
4 68 16 min (2 min/kb)
5 2-5 17 times
6 4 forever
Chapter 3 Subcloning of PRMT5 Gene into an Expression Vector
3.1 Subcloning PRMT5 into pGEX4T1
Subcloning is a widely used technique which can transfer a gene of interest into a target
vector for further studies. pGEX4T1 is a vector with a GST tag that can be used to purify the
PRMT5 protein. GST (Glutathione S-transferase) is an enzyme present in both eukaryotes and
prokaryotes. GST can be used in genetic engineering to rebuild the plasmid with a GST
sequence. Thus, Glutathione-Sepharose 4B beads can be used to bind the GST tag and then the
protein will be eluted by elution buffer to obtain a purified product.
3.1a PCR Experiments
PCR (Polymerase Chain Reaction) is an important method in modern biology and
biochemistry research which can amplify small amounts of DNA to millions of copies (38). With
two well designed primers, which bind to opposite ends of the DNA template, Native pfu DNA
polymerase, dNTP, DMSO, MgSO4 and PCR buffer, a target piece of DNA can be amplified in
vitro. Primers were designed around 12-16 nucleic acids which were complementary to each 3’
Figure 6. PCR products of PRMT5 DNA. Correct bands are around 1.9 kb. Lanes 1, 2, 3, and 4
are sample 1, 2, 3 and 4. Sample 1 and 2 contain no MgSO4. Sample 1 and 3 contain no DMSO.
Figure 6 shows that samples 1, 2 and 4 have the desired PCR product size, which is around
1.9 kb. The bands were cut and the DNA was extracted out of the gel using Q1Aquick Gel
Extraction Kit Protocol and the concentration was measured. (Concentration=O.D.
260*0.05*dilution factor) Sample 1 and Sample 2 concentrations were 0.0700 mg/mL; sample 3
concentration was 0.0200 mg/mL.
3.1b Restriction Digestion of PRMT5 and pGEX4T1
The target gene PRMT5 and vector pGEX4T1 needed to be constructed into one plasmid,
which is a circular double stranded DNA. Plasmid DNA can be transformed into bacteria to
express the target gene. The target gene and vector can be cleaved at the same restriction sites,
which are specific nucleotide sequence, usually around 6 bases, to make them combine together
forming a plasmid. This process is called restriction digestion. Restriction sites have to exist in
both the target gene, which are the PRMT5 PCR products and the vector pGEX4T1. These
restriction sites can be cleaved by their corresponding restriction enzyme. So finding two
restriction digestion step. The two sites in the gene and the vector can be combined together by
DNA ligase. For PRMT5 and pGEX4T1, EcoRI and XhoI were appropriate. Therefore the
restriction enzymes EcoRI and XhoI were used to cleave the PRMT5 gene and the pGEX4T1
vector.
PRMT5 was a PCR products, so in the PRMT5 batch, the components were 30 µL of
PRMT5, 18 µL of ddH2O, 6 µL of Buffer4, 6 µL of BSA10X, 3 µL of EcoRI and 3 µL XhoI. In
pGEX4T1 batch the components were 10 µL of pGEX4T1, 32 µL of ddH2O, 6 µL of Buffer4, 6
µL of BSA10X, 3 µL of EcoRI, 3 µL of XhoI. The total volume of each batch is 66 µL. The
digestions were incubated in 37°C for three hours. PRMT5 and pGEX4T1 were purified using
the PCR purification kit. The concentration of PRMT5 was 0.1225 mg/mL. The molecular
weight was 1.2*106 Da and molar concentration was 1.0*10-7. pGEX4T1 concentration was
0.1300 mg/mL. Molecular weight equaled to 3.2*106 Da and Molar concentration was
0.1300/3.2*106=0.4*10-7 M.
3.1c DNA Ligation to Rebuild the Plasmids
The target gene and vector after the digestion have sticky ends of DNA. So to combine these
two as a plasmid, it requires the enzyme DNA ligase to reconstruct the hydrogen bond at the
restriction sites. The function of DNA ligase is to recreate covalent phosphodiester bonds
between 3’ ends and 5’ ends of two single stranded DNA, which were cut by the restriction
enzymes. In this reaction, ATP is required to provide energy and DNA ligase buffer is also
needed. In this step, 3 groups of samples with different ratios of target gene and vector were
setup. 1:1 group included 1 µL of PRMT5, 3 µL of pGEX4T1, 21.5 µL of ddH2O, 3 µL of
µL of ddH2O, 3µL of T4buffer, 1.5 µL of T4DNA ligase. Negative control group includes 0 µL
of PRMT5, 3 µL of pGEX4T1, 22.5 µL of ddH2O, 3µL of T4buffer, 1.5 µL of T4DNA ligase.
Every group had a total volume of 30 µL. The ligation reaction was carried out in the 16°C
incubator overnight.
3.1d Transformation of the Recombinant Plasmid into XL1 Blue Bacteria
Some bacteria like E. coli have the ability of taking up foreign genes. pGEX4T1-PRMT5
plasmid after ligation was transformed into XL1 Blue, which can replicate the DNA efficiently.
The batches of 1:1, 3:1 and a negative control were transformed in to XL1-Blue and cultured on
agar plates. The next day, 5 colonies from 1:1 and 5 colonies from 3:1 were picked and cultured
in 8 mL LB media overnight. The plasmid from these colonies were extracted and digested with
EcoRI and XhoI for 3 hours again. However, the volume was changed to 20 µL, which includes
10 µL of DNA, 4 µL of ddH2O, 2 µL of Buffer4, 2 µL of BSA10X, 1 µL of EcoRI and 1 µL of
XhoI. Then the DNA after digestion was run on a 1% agarose gel to check the efficiency of
ligation which was a critical step to figure out whether the subcloning was successful.
Figure 7. Checking the ligation efficiency of PRMT5 efficiency with restriction digestions.
Lanes 1-10 are ten representative samples.
compared to the marker of 1 kb. So DNA samples 2 and 6 which were extracted from the
colonies were sent for sequencing to verify the identity of the PRMT5 in the plasmid and the
original PRMT5 sequence. In the BLAST tool of NCBI which is shown in Figure 8, 97%
identities showed the two PRMT5 sequences were almost the same. This indicates that the
[image:44.612.126.487.420.558.2]subcloning of PRMT5 to pGEX4T1 is successful.
Figure 8. Alignment of two sequences for checking the identity.
Figure 9. SDS-PAGE of expressed of GST-tagged PRMT5.
The gel image shown in Figure 9 showed that pGEX4T1-PRMT5 was expressed in BL21
(DE3). The PRMT5 made for the radioactive assay was prepared by another student Arpana
3.2 Subcloning of shPRMT5 into pTXB1 and pET28a
3.2a Preparation of shPRMT5 from puc57-shPRMT5 Plasmid
Synthetic human PRMT5 (shPRMT5) was obtained from the GenScript company, which has
changed the nucleotide sequence of PRMT5 through gene codon optimization analysis to
optimize the PRMT5 gene via removing inhibition sites, repeated sequence, restriction sites
which may interfere with the cloning, and negative CpG islands. The PRMT5 gene can be
expressed well in E coli. without modifying the amino acid sequence. The shPRMT5 gene was
originally isolated from the puc57 vector.The concentration of the plasmid puc57-shPRMT5 was
0.4675 mg/mL; the concentration of pTXB1 was 0.1175 mg/mL and the concentration of pET28a
was 0.1375 mg/mL. The DNA samples were digested by restriction enzymes NdeI and XhoI. The
components are 6 µL of buffer4, 3 µL of NdeI and 3 µL of XhoI, 6 µL of BSA10X in every
group. pTXB1 was 10 µL and ddH2O was 32 µL; pET28a was 10 µL and ddH2O was 32 µL;
puc57-shPRMT5 was 20 µL and ddH2O was 22 µL. Each digestion had a total volume of 60 µL.
The digestion was incubated in 37°C for three hours. Then the puc57-shPRMT5 after digestion
was separated via agarose gel electrophoresis. In Figure 10, five major bands appeared on the
Figure 10. Band A is unclear. Band B are puc57-shPRMT5 plasmid. Band C is puc57 vectors.
Band D is unclear. Band E is shPRMT5.
3.2b Insertion of shPRMT5 into pTXB1 and pET28a
The concentration of shPRMT5 from the lowest band was 0.0475 mg/mL. Then pET28a and
pTXB1 after digestion with NdeI and XhoI restriction enzymes were purified by PCR
purification kit. Concentration of pTXB1 was 0.025 mg/mL and concentration of pET28a was
also 0.025 mg/mL. Table 8 showed the molar ratio of shPRMT5, pTXB1 and pET28a. And in
[image:46.612.230.383.72.182.2]Table 9, according to Table 8 results, ligation reaction system was set up.
Table 8. Calculations of the concentration and molecular weight (MW) of PRMT5, pTXB1 and
pET28a.
Concentration
(mg/mL)
Base Pair MW
(Da)
M
(pmol/μL) shPRMT5 0.0475 1900 1235000 0.038
pTXB1 0.025 6700 4355000 0.0057
[image:46.612.102.510.583.687.2]Table 9. Setup of the ligation reaction.
pTXB1
Molar ratio of target gene over vector
3:1 6:1
pET28a
Molar ratio of target gene over vector
3:1 6:1 shPRMT5 3.8 μL 7.6 μL 3.8 μL 7.6 μL
vector 8.4 μL 8.4 μL 6.7 μL 6.7 μL
ddH2O 13.3 μL 9.5 μL 15 μL 11.2 μL
T4Buffer 3 μL 3 μL 3 μL 3 μL
T4Ligase 1.5 μL 1.5 μL 1.5 μL 1.5 μL
Total 30 μL 30 μL 30 μL 30 μL
Each ligation reaction had 10 μL taken for transformation into XL1-Blue and cultured on
agar plates. 17 colonies of pTXB1-shPRMT5 and 20 colonies of pET28a-shPRMT5 were picked
out and after culturing each of them in 8 mL LB media, the plasmid DNA was extracted. Then 10
μL of DNA from the colonies was taken for digestion with NdeI and XhoI enzymes again. The
digested DNA was then run on a 1% agarose gel to check the result. The agarose gel in Figure 11
indicates the results of pTXB1-shPRMT5 ligation and the agarose gel in Figure 12 indicates the
Figure 11. DNA bands on a 1% agarose gel for checking the ligation efficiency of shPRMT5 and
pTXB1. Lanes 1-17 are representations of DNA plasmids after restriction enzyme cutting of
bacteria colonies 1-17
Figure 12. DNA bands on a 1% agarose gel for checking the ligation efficiency of shPRMT5 and
pET28a. Lanes 1-20 are representations of DNA plasmids after restriction enzyme cutting of
bacteria colonies 1-20.
In the pTXB1-shPRMT5 gel, there was no band in the correct position, which is around 1.9
is the length of shPRMT5. So the primers T7 and T7 terminator were used to sequence sample
12. The result showed that shPRMT5 sequence is the same as shPRMT5 in puc57 vector, and
pET28a had almost the same sequence.
3.3 Subcloning shPRMT5 into pTXB1
To get more linear shPRMT5, puc57-shPRMT5 was taken for PCR with a cloned DNA
polymerase and the modification of the temperature in the second step to 62°C. shPRMT5
products were checked on a 1% agarose gel and found a band in the correct position, which was
around 1.9 kb. Since the PCR reaction was successful, DNA was extracted from the gel and the
concentration was measured, which was 0.15 mg/mL. The PCR products were digested by NdeI
and XhoI enzymes, along with shPRMT5-pET28a which was also digested by the same enzymes
to act as a control to confirm shPRMT5 is in the right position on the agarose gel. The picture of
the agarose gel showed that the digestion of the shPRMT5 PCR product was successful, and the
digested shPRMT5 concentration was 0.065 mg/mL. A ligation reaction was set up at a molar
ratio of 6:1 (shPRMT5:pTXB1). After transformation into XL1-Blue and cell lysis, plasmids of
pTXB1-shPRMT5 were digested again with NdeI and XhoI enzyme to check the ligation
efficiency. However, there was no successful constructed plasmid shown on the 1% agarose gel
image. In order to make sure that the vector pTXB1 was digested completely, pTXB1 bands
were cut out of the gel and extracted. Then pTXB1 was digested again and after purification, the
concentration of pTXB1 was 0.05 mg/mL. shPRMT5 and pTXB1 were used to set up two
ligations again with molar ratios of 6:1 and 3:1. After transformation into XL1-Blue and cell
lysis, the plasmids were digested with NdeI and XhoI and checked on an agarose gel. From thirty
6 and sample 13 were sent for sequencing and the results indicated that the plasmids were both
the same as pTXB1-shPRMT5. Concentration of sample 6 was 0.105 mg/mL and concentration
of sample 13 was 0.095 mg/mL.
Figure 13. DNA bands on a 1% agarose gel for checking the ligation efficiency of the second
sub-cloning attempt of shPRMT5 and pTXB1. Lanes 1-30 representation of DNA plasmids
Chapter 4 Expression of His-Tagged shPRMT5 Protein
pET28a is a widely used vector in biochemistry, which contains restriction sites such as
NdeI, XhoI, EcoRI and a 6X-His tag sequence (39). In certain E. coli strains, it can be expressed
at a high efficiency, like for instance in BL21 (DE3). The selectable marker of pET28a is
Kanamycin. This pET28a vector contains a 6X His-tag sequence and after its expression, the 6
histidines will be fused to the shPRMT5 products. The fused 6X His-tag will then be purified by
a nickel affinity column. The histidine structure contains an imidazole ring. Both imidazole and
histidine can bind to Ni-beads. Therefore, competition can be used to purify the His-tagged
protein. At low concentrations, imidazole can bind to nickel ions that prevent nonspecific and
low-affinity binding to the nickel column, which then can be washed out, and the 6X His-tagged
protein will remain bound to the Ni-beads. However, at a high concentration of imidazole, the
6X His-tagged proteins will eluted out since there is higher competition for the Ni-beads. IPTG
is required for expression of the protein of interest in the BL21(DE3) cells at 16°C. IPTG is an
analog of the metabolite lactose, which can trigger the transcription of the lac operon.
Additionally, IPTG can induce transcription constitutively, since it can not be metabolized in
BL21 (DE3) cells. After lysing the cells using the French-press twice and centrifuged, the
supernatant was purified with Ni-beads and washed by 50 mL equilibrium buffer twice. Then it
was washed by 10mL washing buffer for 10 times and 8 mL elution buffer for 6 times. The
supernatant, pellets, washing solution and elution solution were checked on a 12% SDS-PAGE.
SDS-PAGE (sodium dodecyl sulfate polyacrylamide gel electrophoresis) is widely used in
biochemistry and molecular biology to check the protein fraction by molar weight through their
electrophoretic mobility (40). Sodium dodecyl sulfate (SDS) can separate the proteins by binding
molecules. Consequently, proteins lose their secondary, tertiary and quaternary structures which
leave a linear structure binding to SDS with negative charge. Acrylamide can become
polyacrylamide spontaneously when dissolved in the water and form different sized pores.
During electrophoresis, electric current can induce the negative charged protein molecules to
move through the polyacrylamide gel which is cross-linked to make the protein molecules move
solely on their sizes. The small sized molecules run faster, while the larger sized molecules run
slower. After staining the protein, the band will show that the different sized bands of protein
[image:52.612.194.422.306.517.2]molecules which can be compared to a standard marker.
Figure 14. 12% SDS-PAGE with supernatant, pellets, washing solution 1, 2, 3, 5, 7 samples in
upper gel. Elution solution 1, 2, 3, 4, 5, 6 samples in lower gel. PRMT5 protein at 70 kD
position.
The SDS gel in Figure 14 shows that the correct shPRMT5 bands are at the 70 kD position.
The protein was then condensed to get a higher concentration and changed with 135 mL of
make the radioactivity assay more efficient, the concentration of protein needed to be higher. So
shPRMT5 was centrifuged from 1.2 mL to 200 uL and 60 uL of shPRMT5 was taken and 15 uL
of dye was added to run on a 12% SDS-PAGE. The concentration of shPRMT5 came out to be
0.2824 mg/mL.
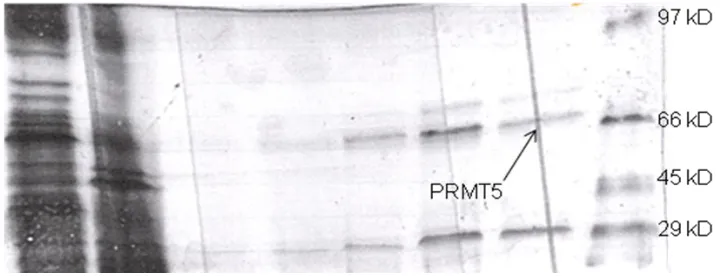
Figure 15. 12% SDS-PAGE with shPRMT5 protein. It seems that PRMT5 has degraded into
two major bands at around 60 kD and 25 kD.
Based on Figure 15, the sum of two degraded bands molecular weights equals to
molecular weight of shPRM5. The bands are clear in different volumes loaded on the gel. So it is
possible that some shPRMT5 had degraded due to unknown reasons. The next step is to check
Chapter 5 Enzymatic Activity of shPRMT5
5.1 Radioactive Assay of His-tagged shPRMT5
To investigate if the shPRMT5 had activity on H4-20 and H3-20, a general test of activity of
shPRMT5 was performed with the composition of Table 10. A mixture of 2XRB, H4-20, H3-20,
AdoMet and enzyme with Peptide (H4 and H3) final concentration of 350 µM and shPRMT5
final concentration of 1 µM was prepared.
Table 10. General test of shPRMT5 activity on H4-20 and H3-20.
H2O 2XRB Peptide AdoMet PRMT5 Total
shPRMT5 H4-20 0 µL 20 µL 7 µL 3 µL 10 µL 40 µL H3-20 5.6 µL 20 µL 1.4 µL 3 µL 10 µL 40 µL Control 7 µL 20 µL - 3 µL 10 µL 40 µL
The CPM values of shPRMT5 were 3590 for H4, 310 for H3 and 112 for the control which
was background. The results are shown in Table 11. There was activity of shPRMT5 on H4-20
which was obviously higher than on H3-20.
Table 11. Results of activity assay of shPRMT5 on H4-20 and H3-20.
CPM
H4-20 3509
H3-20 301
Negative control 112
Mixture 74002
The general radioactivity assay of shPRMT5 needed to be repeated with the same
value is 80986 in Table 12, which show that the activity decreases a little bit but still has activity
[image:55.612.128.505.228.590.2]of shPRMT5 on H4-20 and H3-20.
Table 12. Results of duplicate activity assay of shPRMT5 on H4-20 and H3-20.
CPM
H4-20 2073
H3-20 270
Negative control 126
Mixture 80986
Figure 16. Radioactivity results for shPRMT5 to H4-20 and H3-20.
The results of the reaction shown in Figure 16 indicate that the results are repeatable and
reasonable. PRMT5 has a higher activity on the H4-20 substrate and lower activity on the H3-20
2791 285.5 119 0 500 1000 1500 2000 2500 3000 3500 4000
H4-20 H3-20 Negative control
substrate in vitro. This is an important result and it supports the need to conduct future
experiment to study the enzymatic relation between PRMT5 and H4-20.
5.2 Degradation of shPRMT5
As the previous data showed, there was activity of shPRMT5 on H4-20 and H3-20.
However, through the SDS-PAGE gel in Figure 17, multiple bands were found, which showed
that shPRMT5 degraded further more. To collect the further degraded shPRMT5 protein, the
washing solution was combined and condensed with centrifugation and changed in the storage
buffer with DTT. The condensed solution concentration of the protein was 1.15 mg/mL.
Figure 17. 12% SDS-PAGE Gel representation of the shPRMT5. shPRMT5 degraded further
and generated multiple bands.
5.3 Radioactive Assay of Degraded shPRMT5
His-tagged shPRMT5 protein was expressed once more with the same steps as the previous
[image:56.612.109.494.322.530.2]was in the elution solution whose concentration of imidazole was 200 mM. So the washing
solution was collected and condensed with centrifugation and run on a SDS-PAGE. There were
multiple bands present in the gel pictures. To figure out whether these proteins had activity on
H4-20 and H3-20, a general radioactive assay test was set up with the composition of Table 13.
The total proteins concentration was 1.15 mg/mL and the reaction time was 1 hour.
Table 13. Composition of additional general radioactive assay of shPRMT5 on H4-20 and H3-20.
H2O 2XRB Peptide AdoMet shPRMT5 Total
H4-20 0 µL 20 µL 7 µL
(2 mM) 3 µL (400 µM) 10 µL (16 µM) 40 µL
H3-20 5.6 µL 20 µL 1.4 µL
(10 mM) 3 µL (400 µM) 10 µL (16 µM) 40 µL Negative Control
7 µL 20 µL ___ 3 µL
(400 µM)
10 µL
(16 µM)
40 µL
Table 14. Results of additional radioactive assay of shPRMT5 on H4-20 and H3-20.
CPM
H4-20 248
H3-20 180
Negative Control 131
Figure 18. Radioactivity results for shPRMT5 on H4-20 and H3-20.
Based on the results of the scintillation in Table 14 and Figure 18, activity of shPRMT5 on
H4-20 and H3-20 was present. However, the activity of shPRMT5 on H4-20 was higher and
lower on H3-20. Compared to the first time expression of shPRMT5, the activity on H4-20 and
H3-20 decreased dramatically. Therefore, fragments of the whole shPRMT5 protein may still
have activity. To investigate which part of protein contains the active site, the proteins should be
separated and another radioactivity test would be a logical research plan in the future. In
addition, to analyze it together with the protein expressed the first time, SDS-PAGE would be
helpful and reasonable. FPLC (Fast protein liquid chromatography) can be applied as a feasible
method to separate proteins with different molecular weights with these setting shown in Figure
19. In FPLC, the size exclusion chromatography column was used.
248
180
131
0 50 100 150 200 250 300
H4-20 H3-20 Negative control
5.4 FPLC of shPRMT5.
Figure 19. FPLC settings.
Tube 33-35 (No. 1), 36-39 (No.2), 39-41(No.3), 45-48(No.4) and 52-57(No.5) were chosen
for collection and after condensing, concentrations were measured and checked via SDS-PAGE
gel of Figure 20. Concentration of No.1 was 0.52 mg/mL; No.2 was 0.75 mg/mL; No.3 was 0.27
Figure 20. 12% SDS-PAGE gel with different groups of proteins with different molecular
weights separated by FPLC.
5.5 Radioactive Assay of Different Protein from shPRMT5 on H4-20.
Every protein fraction from FPLC was tested with the radioactive assay for enzymatic
activity. The composition is shown in Table 15. Reaction time was 1 hour. Final concentration of
H4-20 was 350 µM and SAM was 30 µM. Then the samples were checked by liquid scintillation
Table 15. Composition of radioactive assay of different sections of shPRMT5 on H4-20.
H2O Peptide H4-20
(2 mM)
Protein SAM
(400 µM)
Total
Control 37 µL - - 3 µL 40 µL
No. 1 - 7 µL 30 µL 3 µL 40 µL
No. 2 - 7 µL 30 µL 3 µL 40 µL
No. 3 - 7 µL 30 µL 3 µL 40 µL
No. 4 - 7 µL 30 µL 3 µL 40 µL
No. 5 - 7 µL 30 µL 3 µL 40 µL
Original protein
- 7 µL 30 µL 3 µL 40 µL
Table 16. Results of the five sections of shPRMT5 activity on H4-20 methylation.
CPM
Control 91
No. 1 88
No. 2 96
No. 3 103
No. 4 81
No. 5 81
Original protein 191
The results in Table 16 showed that the five sections of the separated proteins CPM values
are quite low and close to the control values. It is possible that these 5 groups have no activity. In
order to confirm this, the reaction time was elongated to 20.5 hours and the same reaction was
[image:61.612.104.430.360.479.2]Table 17. Result of general test of radioactive assay of 5 sections after modifying the reaction
time to 20.5 hours.
CPM
Control 189
No. 1 334
No. 2 444
No. 3 452
No. 4 219
No. 5 359
Original protein 712
However, certain sections had an increased in CPM values showed in Table 17 and this
verifies that some of these protein fragments have activity on H4-20. To make the data more
clear, every group CPM value was subtracted by the control CPM value to get the modified data.
These data were divided by No.1, No.2, No.3, No.4 and No.5 concentrations separately to get the
[image:62.612.104.427.141.258.2]normalized values as in Table 18 and Figure 21.
Table 18. Results of the activity of 5 group normalized concentrations on H4-20.
Protein group Minus control CPM Divide by concentration
No.1 145 278.9
No.2 225 340
No.3 263 974
No.4 30 166
No.5 170 447
Figure 21. Activity of 5 fractions of the shPRMT5 and original shPRMT5.
To obtain clearer bands of No.1, No.2, No.3 No.4 and No.5 proteins on the SDS-PAGE gel,
the volume of each group was increased to 40 µL and the original protein to 20 µL, 40 µL of the
previous shPRMT5 was also loaded as a control.
Figure 22. 12% SDS-PAGE gel showing the samples after condensation of the different groups
of protein and the previous shPMRT5 as the control.
[image:63.612.159.453.439.599.2]activity on H4-20. However, No.3 had a protein fragment around 66 kD, which might contain the
active site, since it has a high CPM value. Furthermore, No.5 has high activity and a band around
48 kD, which also is presented in the degraded shPRMT5. Therefore, if shPRMT5 was cut into