ScholarWorks @ Georgia State University
ScholarWorks @ Georgia State University
Physics and Astronomy Theses Department of Physics and Astronomy
Spring 4-16-2012
A New Look at Hard Labor Creek Observatory
A New Look at Hard Labor Creek Observatory
Robert D. Moore Jr
Georgia State University
Follow this and additional works at: https://scholarworks.gsu.edu/phy_astr_theses
Recommended Citation Recommended Citation
Moore, Robert D. Jr, "A New Look at Hard Labor Creek Observatory." Thesis, Georgia State University, 2012.
https://scholarworks.gsu.edu/phy_astr_theses/15
This Thesis is brought to you for free and open access by the Department of Physics and Astronomy at
ScholarWorks @ Georgia State University. It has been accepted for inclusion in Physics and Astronomy Theses by an authorized administrator of ScholarWorks @ Georgia State University. For more information, please contact
by
ROBERT D. MOORE, JR.
Under the direction of Dr. Russel White
ABSTRACT
This document presents a study of astronomical observing conditions of Hard Labor Creek
Observatory. Analysis of factors such as sky brightness, astronomical seeing, and patterns in the
level of cloudiness at the site are presented. Characteristics of the observatory's Apogee Alta
U230 camera are also measured and calculated. These characteristics include loss of linearity in
the CCD's response to light, read noise, gain, dark current, and stability in the camera's bias
levels. The camera is also used in conjunction with the 20-inch RC Optics telescope to
determine the system's pixel scale and a set of limiting magnitudes for the Johnson-Cousins
photometric filters that are used with the camera. Observations of a transit of known transiting
exoplanet Qatar-2 b as well as observations of the open cluster Messier 29 are also performed to
demonstrate the ability of the equipment to perform precise photometric observations.
by
ROBERT D. MOORE, JR.
A Thesis Submitted in Partial Fulfillment of the Requirements for the Degree of
Master of Science
in the College of Arts and Sciences
Georgia State University
by
ROBERT D. MOORE, JR.
Committee Chair: Dr. Russel White
Committee: Dr. Misty Bentz
Dr. H. Richard Miller
Dr. Bob Powell
Electronic Version Approved:
Office of Graduate Studies
College of Arts and Sciences
Georgia State University
DEDICATION
This work is dedicated to my wife Cheryl and my supervisor and friend, Dr. Bob Powell.
Without their help and encouragement I would likely never have even attempted this, much less
ACKNOWLEDGMENTS
The next few pages are tasked with thanking those that assisted in helping to shape this work.
Truthfully if I did that it would be longer than the whole rest of the work. That said I will start
by thanking my fellow students, my colleagues, at Georgia State University. Thanks to Adric
Riedel, Sergio Dieterich, and Rob Parks who helped in figuring out the arcane workings of
IRAF. Thanks to Nic Scott, Noel Richardson, and Ben Jenkins who were instrumental in setting
up the telescope and other instruments at Hard Labor Creek. I would add that Nic and Noel were
also invaluable in fielding all the little questions I fired out, such as “Which photometric system
do the filters at HLCO use?”
For doing a great deal of the work in setting up IRAF on the LINUX system at the
Department of Physics at the University of West Georgia, I also thank Brian Hubbard, R. J. Hill,
and Justin Cantrell. Justin answered many frantic questions about setting up such a system, and
Brian and R. J. did the bulk of the installation. I cannot emphasize enough how much the
implementation of this system assisted me in analyzing the data for this work.
Dr. Bob Powell, Chair of the Department of Physics at the University of West Georgia
deserves thanks for all the help he gave me. From day one he encouraged me to follow what I
wanted to do, not what might be expedient. He also went out of his way to arrange things at
work so that I had the time to pursue this degree. Often times this meant that he took on work
that he should not have. When the filters did not arrive for the Alta U230, he made the offer to
lend the UWG Department of Physic's filters of the same type to GSU so I could begin work.
When the Alta U230 itself spent a few months away getting repaired, he offered to loan the
Department's Apogee Alta U16M to the cause. Certainly it was not the same camera, but he was
could finish. His moral support was also crucial and his willingness to stop and listen and make
suggestions were invaluable. Without his constant and steadfast support there is simply no way I
could have even reached the point of writing this thesis, much less have written it.
Dr. Douglas Gies is owed thanks for his support. He posted reminders to me of
deadlines, and on at least one occasion helped me with a means of adding a class so that I could
keep moving forward. He made recommendations on how I could manage the degree program
with regards to my limits imposed by working at the University of West Georgia at the same
time. I will also always remember his good cheer and enthusiastic encouragement when things
seemed their worst.
Dr. Russel White is owed a great deal of thanks. He proposed the project to me and has
offered many ideas on what might be included to flesh it out. His thoughts and ideas on how to
analyze the data and on what might be of interest to others helped to shape its focus. Dr. White
also helped rein in my tendency to want to go to in depth or to over complicate matters that
should have remained simple, and thanks to his input did. Not only this, his patience in dealing
with my split loyalty – working as the Lab Coordinator for the Department of Physics at UWG
as well as pursing a graduate degree at GSU – deserves mention. Given my own frustration at
times with my inability to make significant progress on this work, I can only imagine his. I
therefore thank him for not giving up and simply telling me that I may need to work with
someone else or find a different goal. He either has the patience of a saint or an understanding
and willingness to work within circumstances that passes well beyond what should be expected.
For only grumbling a little when I had to miss football game performances or Christmas
concerts I thank my daughter, Alexandra, and son, Jesse. They have had to deal with my not
doors or having to decline on other things, the little things, that seem so important to you when
you are young. Even bigger, they have dealt with a year of my not even being there at all, other
than as a presence on the phone and occasional visits.
Finally I must thank my wife, Cheryl. She has encouraged and supported me from the
beginning. She has put up with many nights alone while I went off to collect data and learn how
to use the equipment, and she has also endured a year's separation while I finished this work.
My finishing my work at GSU has been at least as important to her, if not more so. Without her
encouragement and pushing, I would likely have given up. She has also used her expertise with
computer systems to make suggestions on how I might want to approach some of the problems I
have encountered. She has been solid foundation in my life and has believed in me, and my
ability even when I no longer did.
Robert D. Moore, Jr.
TABLE OF CONTENTS
ACKNOWLEDGMENTS v
LIST OF TABLES xi
LIST OF FIGURES xii
1. INTRODUCTION 1
2. THE SITE 3
2.1. Physical Characteristics 3
2.2. Observing Characteristics 4
2.2.1. Sky Brightness 4
2.2.2. Cloud Cover 6
2.2.3. Seeing 13
3. THE EQUIPMENT 16
3.1. The Telescope 16
3.2. The Camera 22
3.3. The Computer and Software 25
3.3.1. MaxIm DL 26
3.3.2. TheSky 6 29
4. TELESCOPE-CAMERA SYSTEM ANALYSIS 32
4.1. Observations 32
4.2. Pixel Scale 32
4.3. Flat Fields 41
4.3.1. Dome Flats 43
4.4. Linearity 48
4.5. Bias Frames 56
4.6. Dark Current 64
4.7. Gain and Read Noise 66
4.8. Limiting Magnitudes 68
5. SCIENCE DEMONSTRATIONS 72
5.1 Transit Detection of the Planet Orbiting Qatar-2 72
5.1.1 Introduction 72
5.1.2 Observations and Analysis 73
5.2 A Color-Magnitude Diagram of the Open Cluster Messier 29 78
5.2.1 Introduction 78
5.2.2 Observations and Analysis 79
6. SUMMARY 85
REFERENCES 90
APPENDICES 92
A. Observer's Guide 92
A.1 Setup 92
A.1.1 The Camera 92
A.1.2 The Telescope 96
A.1.3 Guide Camera 97
A.2 Using MaxIm DL 98
A.2.1 Focusing the Camera 98
A.2.2.1 Choosing Filters 101
A.2.2.2 Single Images 101
A.2.2.3 Sequences of Images (Autosave) 102
A.2.2.4 Continuous Imaging Mode 107
LIST OF TABLES
Table 2.1: Colors Used in Sky Brightness Map 4
Table 2.2: Monthly Mean Cloudiness Condition Numbers 13
Table 2.3: Values of the Mean FWHM of Stars Through Five Photometric Filters 14
Table 3.1: Characteristics of the Apogee Alta U230 Camera 23
Table 4.1: Stars Used for Pixel Scale Determination 33
Table 4.2: Fit Results for Groups From Central Square of 800 x 800 Pixels 39
Table 4.3: Fit Results for Groups With 4 Stars From Center and 3 From Edge 39
Table 4.4: Fit Results for Groups With All Stars From Outside Center 800 x 800 39
Table 4.5: Analysis of Flat Fields for Testing CCD Linearity 49
Table 4.6: Analysis of Bias Frames 57
Table 4.7: Analysis of the Sunlit Bias Frames 63
Table 4.8: Photometry for Comparison Stars 69
Table 5.1: Basic Data for Host Star Qatar-2 72
Table 5.2: Basic Data for Transiting Exoplanet Qatar-2 b 73
Table 5.3: Comparison Stars for Photometry of Qatar-2 b Transit 74
LIST OF FIGURES
Figure 2.1: HLCO Satellite Sky Brightness 5
Figure 2.2: Yearly Average Cloudiness 9
Figure 2.3: Completely Clear Percentage 11
Figure 2.4: Completely Cloudy Percentage 12
Figure 2.5: Radial Plot of Star from V Band Image of Messier 29 15
Figure 3.1: 20-inch RC Optics Telescope 17
Figure 3.2: An Image of Messier 61 Without Autoguiding 18
Figure 3.3: An Image of Messier 65 With Autoguiding 21
Figure 3.4:Wavelength Response for e2v CCD230-42 Back-Thinned Chip 24
Figure 3.5: Comparison of Two MaxIm DL Stretch Settings 28
Figure 3.6: TheSky 6 Screen Shot 30
Figure 4.1: Annotated Image of Messier 29 35
Figure 4.2: Plot of Angular Separation vs. Pixel Distance 37
Figure 4.3: Parallel Lines With Barrel Distortion 40
Figure 4.4: Flat Field Taken With an Exposure of 80ms 42
Figure 4.5: U Band Dome Acquired Flat Field 44
Figure 4.6: B Band Dome Acquired Flat Field 44
Figure 4.7: R Band Dome Acquired Flat Field 44
Figure 4.8: V Band Sky Acquired Flat Field 47
Figure 4.9: Plot of Intensity Counts vs. Exposure Length 53
Figure 4.10: Plot of Intensity Counts vs. Exposure Length at Non-Linear Regime 54
Figure 4.12: Histogram of a Bias Image Taken on July 22, 2011 60
Figure 4.13: Bias Image From the Apogee Alta U230 Camera 61
Figure 4.14: Zoom of Bias Frame From Figure 4.13 62
Figure 4.15: Plot of Mean Dark Frame Count vs. Exposure Length 65
Figure 5.1: Annotated Image of Qatar-2 Star Field 75
Figure 5.2: R Band Differential Photometry Lightcurve for Qatar-2 b Transit 77
Figure 5.3: V-I Color Plot for Stars in the Field of View of Messier 29 83
Figure 5.4: V-I Color Plot for Field of View of Messier 29 With Isochrones 84
Figure A.1: Screen Capture of MaxIm DL Main Interface 94
Figure A.2: Screen Capture of MaxIm DL Interface With Camera Setup 95
Figure A.3: Screen Capture of MaxIm DL Interface With Camera Exposure Window 99
Figure A.4: Screen Capture of MaxIm DL Interface With Autosave Setup 103
Figure A.5: Screen Capture of MaxIm DL Autosave Setup Window 105
Figure B.1: Normal Distribution Curve 111
1. INTRODUCTION
Hard Labor Creek Observatory (HLCO) is the observatory facility operated locally by the
Georgia State University Department of Physics and Astronomy. The primary use of the facility
until recently has been to host student and public observations. With the addition of a 20-inch
RC Optics telescope and other equipment, the possibility of using the facility for scientific
observations is being considered.
Work has already been done and reported by Benjamin Jenkins, Noel Richardson, and
others on the setup of the telescope and its use with the LHIRES III spectrograph. I will
therefore not be focusing or repeating information about turning on the telescope, aligning it, and
other initialization routines for its use. For that information I will refer interested individuals to
the Master's thesis of Mr. Benjamin Jenkins: A Study of the LHIRES III Spectrograph on the
Hard Labor Creek Observatory 20 Inch Telescope.
The focus of this work is on characterizing the observing site of HLCO, and recently
added facilities, with particular regard to the cloudiness of the site, astronomical seeing
conditions, and brightness of the sky at the site, and thus how often observations might be made
from the location and what sort of limits to those observations exist. Information will also be
reported on characterizing the new Apogee Alta U230 CCD camera and its use in conjunction
with the 20-inch RC Optics telescope. In Section 4 reports are made of the stability of the bias,
calculations of gain and read noise, flat fielding effects, and other aspects of the combined
telescope-camera system. Observations of the transit of a known exoplanet, Qatar-2 b, were also
made, and reported in Section 5, to demonstrate the capabilities of the telescope-camera system
for making precise photometric observations. As a further demonstration of the photometric
presented. This demonstrates the multi-wavelength capabilities of the system at optical
wavelengths. Finally the Appendix will cover suggested settings and operation procedures for
making observations with the telescope and camera and their associated computer software.
The long-term goal of this effort is to provide information that will assist others to
determine what sorts of observations might be possible from HLCO with this equipment. With
the included site information, scheduling observations may also be possible in so far as at least
predicting when conditions are most likely to be favorable. Overall, the goal is to expand the
usefulness of the HLCO facility, and to provide a guide for determining reasonable limits for
2. THE SITE
2.1 Physical Characteristics
Hard Labor Creek Observatory is located in Hard Labor Creek State Park near Rutledge,
GA. According to the U.S. Geological Survey’s website1 the observatory is located at 33° 40’
16” N, 83° 35’ 38” W, and has an elevation of 219m. The observatory is 5km from Rutledge,
GA, 40km from Athens, GA, and 74km from downtown Atlanta, GA,2 the location of the GSU
campus.
The facilities include a fenced enclosure around the main building and two auxiliary
buildings. The main building houses the two domes, the western most housing the 20-inch RC
Optics telescope. On the north side of the building are the dome housing the MTT (Multiple
Telescope Telescope) and a newer facility to house the old 16-inch Meade EMC telescope and
another telescope to be used for the public observations and perhaps secondary observations
when the main telescopes are in use for other purposes.
Trees along the fence line do become a problem for observing from the two main domes.
This is especially true from the eastern dome as it lies close to the fence line on the eastern side,
and the trees in that direction are particularly tall. It would take the agreement of the
management of the Hard Labor Creek State Park to allow them to be trimmed or removed
however, so this difficulty may be outside the realm of remedy. Some may question that the
trees are useful for shielding the site from outside lights. The size of the park and distance from
major sources of light make it unlikely that the removal of the trees would increase the sky
brightness of the site. To the west the problems with trees obstructing the sky are lessened by the
1 U.S. Geological Survey website: http://www.usgs.gov/
2 Distances calculated using the NOAA Latitude/Longitude Distance Calculator:
fact that the ground slopes down on that side of the facility, which puts the trees at a lower level
than the observatory from the start.
2.2 Observing Characteristics
2.2.1 Sky Brightness
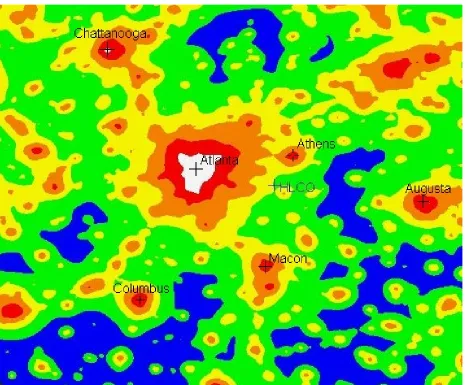
The sky brightness for the HLCO location can be empirically determined by referring to
images such as Figure 2.1.3 This figure shows a cropped version of an image made from satellite
monitoring of artificial night sky brightness. The image is approximately 480km x 480km and is
annotated to show the location of HLCO and the identity of some of the brighter locations. The
colors and contours of the map represent levels of sky brightness. Table 2.1 gives a description
of the various colors and their meanings. From this image it can be seen that HLCO is located in
one of the darker sky locations possible in Georgia while remaining within 100km of Atlanta.
Table 2.1: Colors Used in Sky Brightness Map4
Color Sky Brightness Bortle Scale
V-mag./sq. arcsecond
Blue 21.89 to 21.69 3
Green 21.69 to 21.25 4
Yellow 21.25 to 20.49 4.5
Orange 20.49 to 19.50 5
Red 19.50 to 18.38 6 or 7
White <18.38 8 or 9
The Bortle scale is a rating system proposed by John Bortle (2001) as a means of
reporting sky brightness. The ranks sky brightness on a numeric scale of 1 to 9 based on the
visibility of phenomena and objects such as gegenschein, zodiacal light, Messier 33, Messier 4,
and Messier 5. From Figure 2.1 and Table 2.1, the skies at HLCO rate a 4 on the Bortle scale
3 Uncropped image can be found at http://www.inquinamentoluminoso.it/worldatlas/pages/fig2.htm. The uncropped image shows the entirety of the North American continent.
which is classed as a “Rural/Suburban Transition” sky. The characteristics of such a sky include
a visible Milky Way, lacking in all but the most obvious structure and a naked eye limiting
magnitude of about 6.
2.2.2 Cloud Cover
Since observations in visible wavelengths cannot be made through clouds, some idea of
how often it is cloudy, and if certain times are more cloudy or less cloudy, is useful. There has
been no long term weather monitoring campaign at HLCO, therefore weather data from Athens,
GA was used for this determination. The Washington Post reports average weather statistics for
several cities, including Athens, GA, on its website.5 On this site are reported averages from data
collected by the National Weather Service, and include such things as average temperatures, high
and low temperatures, average precipitation and snowfall, and average numbers of cloudy, clear,
and partly cloudy days.
The information reported on this site shows that HLCO can generally expect 147 cloudy
days, 106 partly cloudy days, and 113 clear days each year. Averages are further broken down to
a number of days each month that could be expected to be cloudy, partly cloudy, or clear.
Looking at these numbers, the cloudiest months should be January, February, and December; all
three have a mean of 15 cloudy days. Similarly the months with the highest number of clear
days are October and November with 14 and 12 clear days respectively. As for the partly cloudy
days, there is no indication made as to what the designation means (just how cloudy is “partly
cloudy”), but if absolutely clear conditions are needed for planned observations, then June, July,
and August would seem to be the poorest months for planning to observe.
The above gives general information about the weather conditions that can be expected,
but little real predictive ability. For this reason a site that acquired long term data for the area
was found. Using WebMET.com, a weather and climate data archiving site, Weather Bureau
Army Navy (WBAN) Station #138736 located at Athens Municipal Airport (Ben Epps Airport)
was chosen. This station is only 40km from HLCO. The station stopped collecting data in 1990,
but from 1961 to 1990 it collected weather data on an hourly basis. The data monitored includes
measurements of temperature, solar irradiance, wind speed, precipitation, and opaque and total
cloud coverage.
Since the data were taken on an hourly basis, it could be used to specifically focus in on
conditions at night. Looking at the solar irradiance data, there is a period of nine hours where the
irradiance is zero throughout the year. This establishes an “observing night” from 2100 to 0500
local time. Twilight conditions will make a few hours of this time unusable during summer
months, but this time period allowed for a consistent time frame with which to make a
comparison for all days of the year. Leap Year Days were excluded since they only occur in
one-fourth of the years.
Once these hourly data were limited to only the hours of the observing night, the opaque
cloud cover was chosen for analysis. The opaque cloud cover data was chosen over the total
cloud cover because “total” could include hazy, wispy clouds through which differential
photometry and imaging can still be done. Thus the stricter criterion of an occluded sky implied
by the term opaque was chosen to be more representative of when observations could not be
made.
Quantitative analysis was possible because the cloudiness level for the hour was rated on
a scale from 0, representing completely clear, to 10, representing completely clouded over.
Having worked with Air Traffic control, the author knows that modern measurements of this
rating are taken using an all sky camera and computer analysis of the amount of cloud cover.
Considering that the data from WBAN #13873 predates such computer analysis, this
measurement would have been done by a trained observer.
Analysis of the data was done by calculating the mean of the cloudiness number for each
day over the available years. This is not a percentage chance for the sky to be cloudy, but an
indicator of how cloudy that particular night is on average. For example on September 28 (Day
100), the cloudiness rating is 4.4. This means that on average approximately 44% of the sky will
be cloudy on that night. This produces the non-surprising result that there is no single night that
can be said to be either completely clear or completely overcast at the site on any given night or
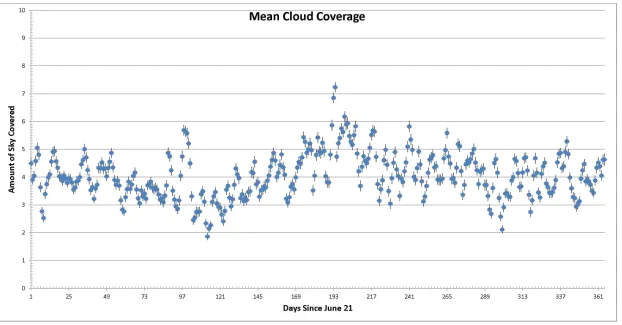
set of nights. As Figure 2.2 illustrates though, there is still ability to make predictions about
better times to schedule observations. The first day of the graph in Figure 2.2 is June 21, the
Summer Solstice. It is clear that most of the year is fairly uniform, but there are two notable
features visible. The first is a cloudiness peak around Day 194 (December 31). The entirety of
the peak covers from late November through January. This time frame would therefore be the
worst time for trying to schedule observations at HLCO.
Another feature is the deep lull in cloudiness that can be seen from around August 14
(Day 55) until about November 15 (Day 147). This period of time tends to be less cloudy than
any other time of year. There is a brief spike from September 16 (Day 88) to September 30 (Day
of the weather in the area, and appears to coincide with the peak of the tropical storm season.7
The rest of the year appears to scatter about the mean cloud cover level of 4.05.
The data were also analyzed to determine the percentage of years when each day was
either completely clear or completely cloudy. Figure 2.3 shows the percentage of the time that
each day of the year is completely clear and Figure 2.4 shows the percentage of the time that
each day of the year is completely cloudy. As with Figure 2.2, the plots start with June 21. In
both graphs the trend line marks a moving average of three points from the data set, and was
added to more readily show the trends in the set.
Figures 2.3 and 2.4 show many of the same features as Figure 2.2. The highest
probability of a completely clear day is found during the Fall months, and the highest chance for
completely cloudy day is found during the Winter. It is interesting though that the Winter peak in
cloudiness does not bring with it a lower chance of a completely clear day, nor does the Fall lull
in cloudiness indicate a decrease in the chance of a completely cloudy day. An overview of the
mean number of completely clear, completely cloudy, and a mean cloudiness level for each
month for the years of the data set is given in Table 2.2.
Table 2.2: Monthly Mean Cloudiness Condition Numbers
Month Mean Cloudiness Days Clear Days Cloudy
January 4.92 8 8
February 4.23 9 6
March 4.44 9 6
April 3.70 10 4
May 4.05 8 4
June 3.87 7 3
July 4.10 5 3
August 3.81 7 3
September 3.92 9 5
October 3.01 13 4
November 3.91 11 6
December 4.63 9 8
The net result is that fall is the best time for scheduling important observations at HLCO,
and the winter months of December, January, and February are the worst. At other times of the
year, an observer at HLCO will likely have to rely on a short range local weather forecast.
2.2.3 Seeing
Another important observing characteristic of any observing site is astronomical seeing, a
measure of the amount of image smearing caused by the atmosphere. Without this distortion the
theoretical limit of resolution, using the Rayleigh criterion; is:
R≈1.22
d
where λ is wavelength in meters and d is aperture in meters. For a 0.508m aperture telescope at
500nm, R=1.20×10⁻⁶≈0.248arcseconds . At any terrestrial site the actual resolution limit
will be worse than this theoretical limit due to atmospheric distortion, and astronomical seeing is
Seeing for HLCO was determined through a simple method. After determining a pixel
scale (discussed in Section 4.1), images of Messier 29 were used to obtain the point spread
function (PSF) for several stars across the field. A star's PSF is the star's measurable profile on
the image. It can be affected by many things including poor focus, optical distortions, and
seeing. The full width at half maximum (FWHM) of the star's PSF gives a measure of the
number of pixels over which the star's image is spread. Combined with the pixel scale, this gives
a measure of the seeing for the site in arcseconds.
The images used were 5-second exposures. Three images were taken through each of the
five Johnson-Cousins filters. For each filter the FWHM of the PSF of three stars on each image
were measured using the IRAF imexam routine and a radial plot of each star. Figure 2.5 shows
the radial plot of a star visible in one of the V band images. For the three images through each
filter, the same three stars were used. All three stars were chosen to be in the center of the image
to avoid some types of optical distortion.
The values of the FWHM in pixels were then averaged. Table 2.3 gives the results of
these averages along with the associated standard deviations. Table 2.3 also lists the width of
these profiles in arcseconds, calculated by multiplying the FWHM in arcseconds by the value of
the pixel scale of the system given in Section 4.2.
Table 2.3: Values of the Mean FWHM of Stars Through Five Photometric Filters
Filter Mean FWHM Std. Dev. Seeing Std. Dev.
Pixels Pixels Arcseconds Arcseconds
U 2.86 0.247 2.12 0.18
B 3.39 0.269 2.52 0.2
V 2.76 0.187 2.05 0.14
R 2.51 0.241 1.86 0.18
3. THE EQUIPMENT
3.1 The Telescope
The current main telescope and HLCO is a RC Optics 20-inch (0.508m) aperture
Ritchey-Chrétien. It is an f/8.1 system giving a focal length of 4.11m. The telescope is mounted on an
Astro-Physics 3600GTOPE German equatorial mount that was polar aligned by Nic Scott and
Benjamin Jenkins, with follow-up adjustments made by Nic Scott. A 120mm apochromatic
refractor from Orion Telescopes and Binoculars can be used as a guide scope. Figure 3.1 shows
the 20-inch telescope and the 120mm refractor with the Apogee Alta U230 camera attached to
the rear of the main telescope.
An important consideration for any telescope mounting system is its tracking ability.
Errors in tracking result in distorted images for long exposures. As an illustration of the image
quality that can be achieved over long duration exposures, two targets were chosen. One was
imaged without the use of an autoguider, and the other was imaged with the use of an autoguider.
At this point it was known that further adjustments would be made to the telescope and mount,
so the analysis was made on a purely qualitative basis. Qualitatively a distorted image was
considered to be one where stars in the image were twice as long as they were wide.
Figure 3.2 is an image of Messier 61 (NGC 4303) taken on January 29, 2012 at 0711 UT
without the use of an autoguider. It is a 60-second image taken with no filter, and an
approximate airmass of 1.4. The stars are noticeably elongated as is the central region of the
galaxy. This is one of twenty-two images taken. While some did show less distortion, they all
show elongated stars. This suggests exposure times of 30-seconds as the non-distorted image
Autoguiding involves the use of a second camera, and in the case of the HLCO system a
second telescope in order to make corrections to the tracking of the telescope's mount. It is
accomplished by selecting a suitable star with the second camera and using computer control
software to keep the selected star on a specified set of pixels. The second camera used for
autoguiding at HLCO is a SBIG STV. This is a self-contained system with one of its primary
design functions being use as an autoguider. The guide scope is mounted in fixed rings which
allow for no adjustment of the telescope's pointing. It is also not aligned to the same portion of
the sky as the main telescope. Even without being able to adjust the guide scope's pointing, there
was little difficulty in finding a suitable guide star, though one occasion did arise where an
exposure of 5-seconds was needed in order to get a suitable intensity level for the chosen guide
star. The field of view for this autoguiding setup is approximately 18.0 arcminutes x 13.8
arcminutes.
The minimum brightness of a guide star is dependent on many factors. If the star is too
bright in the autoguider image, the centroid point that the autoguider is guiding to can shift about
within the star's Airy disc, and corrections are being made due to these shifts as opposed to errors
in tracking. The chosen guide star should be bright enough in the guide exposure to be at least
3σ above the background level. For this autoguiding system, this usually means a brightness of
at least 1000 counts, which is indicated on the STV's display. A final consideration is that an
autoguider exposure should be no shorter than 0.5-second and no longer than approximately
6-seconds. A shorter exposure results in corrections that are too aggressive (over-correction) and
longer indicates a guide star that is simply too faint. Since the autoguider only corrects for
tracking errors after each exposure, a longer autoguider exposure also means noticeable errors
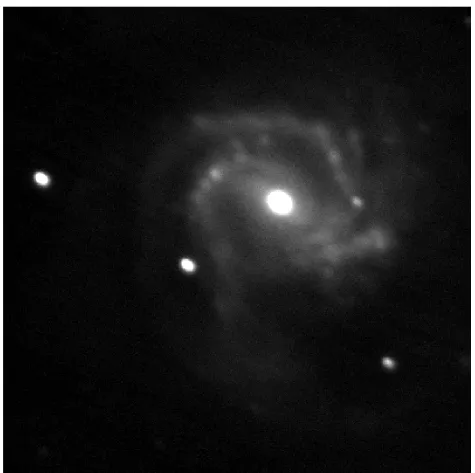
Figure 3.3 is an example of an image taken while using the SBIG STV as an autoguider.
It is a 310-second exposure of Messier 65 through a Johnson-Cousins B photometric filter taken
on May 1, 2011 at 0448 UT with 2x2 pixel binning. This is the longest exposure that was
attempted, and the stars show relatively little distortion in shape. As a note, the small flecks
scattered over the image are not stars. This speckling occurred in all images taken on this night,
regardless of the filter being used, and the location of this noise varied from image to image.
The quantity of “speckling” did vary with exposure length, being worse for longer exposures
than for shorter. This noise disappeared from images taken later on the same night (May 1,
3.2 The Camera
The camera used in this study was an Apogee Alta U230. It contains a back-thinned e2v
CCD230-42 chip with 15-micron pixels in a 2048x2048 (30.7cm x 30.7cm) array. It uses the
optional D09 high cooling capacity housing which can lower the CCD's temperature 60-65ºC
below ambient temperature according to the factory specifications. Table 3.1 gives other
characteristics as reported by the manufacturer and as measured in this study. Figure 3.4 shows
the manufacturer's report of the CCD's sensitivity.8 Characteristics such as bias level, dark
current, gain, and read noise were tested and and are described in Section 4.
Table 3.1: Characteristics of the Apogee Alta U230 Camera
Characteristic Manufacturer's Value Measured Value
Pixel Array 2048x2048 (30.7cm x 30.7cm)
Pixel Size 15 microns
Field of View (with 20-inch Telescope)
~25.3arcminutes x 25.3 arcminutes*
Linear Full Well 150,000 electrons (typical)
Gain 2.480*
Loss of Linearity 61,000 ADU counts*
Dynamic Range 85dB
QE at 400nm 55%
Peak QE @ 720nm 96%
Maximum Cable Length 5m between hubs with 5 hubs
maximum
Digital Resolution 16 bits @ 700kHz; 12 bit @
2MHz
System Noise 12 e- RMS (typical) 11.82 e- RMS*
Binning Modes 1x1 to 8x2048
Exposure Time 30ms to 10980s in 2.56μs
intervals
Dark Current 0.1 e-/pixel/s 0.0683 e-/pixel/s*
Temperature Stability +/- 0.1ºC
Operating Environment -22 to 27ºC with 10% to 90%
humidity
A seven-position filter wheel, an Apogee AFW50-7S, is attached to the camera. The filter
wheel uses square 50mm, unmounted filters. The filters currently used in the filter wheel are a
set of U, B, V, RC, IC, Johnson-Cousins broadband photometric filters. They are only loosely
held in place by two circular plastic washers on opposite sides of the square slot for the filter.
Care should therefore be exercised in carrying or setting the camera down. It may be possible
for the filters to come loose within the wheel or be jostled out of position in their slot. The filter
wheel adds approximately 1.6kg of mass to the camera and a fair amount of bulk since it extends
beyond the 7-inch square housing of the camera body.
It should therefore be noted that the Apogee Alta U230 camera comes with the choice of
three different housings: the D07 (for cooling to 45C below ambient), the D09 high cooling (for
cooling to 60-65C below ambient), and the D11 low profile (contains no internal shutter). The
model used at HLCO has the D09 high cooling housing which gives the camera a mass of 3.3kg.
This is not an insubstantial mass, especially given the height of the telescope and the added mass
and bulk of the filter wheel (bringing the total mass to about 5kg). Great care should be taken
when mounting or unmounting the camera. For safety of both the user and the camera itself, it
should be mounted or unmounted only with two people present. If the camera does not
immediately thread onto the telescope's adapter coupling, or if its mass comes free when it is
being removed, it can be a surprise when one is working with extended arms and at shoulder
height or above.
3.3 The Computer and Software
The computer used at HLCO is a Dell Optiplex 755 computer running 64-bit Windows
XP. The processor is an Intel Core 2 Duo E8500 operating at 3.16 GHz. It has 3.25GB of RAM
because of the number of programs that must be open to operate the telescope and the camera.
The main programs needed are MaxIm DL with its associated control windows and TheSky 6.
There are also programs from RC Optic for controlling the telescope fans and focusing.
3.3.1 MaxIm DL
MaxIm DL is a software package that is produced by Cyanogen Imaging Products, a
division of Diffraction Limited. The version purchased for HLCO also comes with MaxPoint, a
mount modeling program for improving the pointing accuracy. MaxIm DL is the resource which
controls the cameras attached to the telescope, the filter wheel, and allows for much image
manipulation and calibration.
At HLCO the primary use is control of the camera and filter wheel. The program itself
can control a wide variety of cameras including most of the common models of DSLR cameras
(Nikon, Canon, etc.) The interface is controlled through the use of several menus and system
control windows. The main windows of interest for camera control are the Stretch Window and
the Camera Control Window.
There are three tabs on the Camera Control Window. When this window opens, it will
automatically open to the Setup tab, where the camera and filter wheel are turned on and
initialized to the system. It is also the tab used to turn on the camera's cooling, the cooling set
point, and to establish which filters are in which position in the filter wheel. Also of note is that
a second camera can be initialized as well. Typically this is where a guide camera would be set
up and initialized. More about the Camera Control window will be discussed in the Appendix.
The Screen Stretch window allows for easy access to an image's “stretch” as the name
implies. Stretch is a term that refers to how the various intensity levels recorded in a FITS image
the camera's CCD can record thousands of intensity levels. How these levels are binned can
make a great deal of difference in what is visible in an image and what is not. Figure 3.5 shows
two views of the same image, but with different settings on the stretch.
The reason that this issue with the stretch is important is that this setting may need to be
adjusted simply to see if the desired target is actually in the field of view. For instance, if
someone were trying to image the Eagle Nebula and had the stretch set as it is for the version on
the right side of Figure 3.5, it is unlikely that they would know that it was in the field unless they
recognized the cluster of stars there. Before giving up or deciding the telescope is off target, it
may be advisable to change the stretch settings to verify this before moving on. The default
stretch setting in the window is labeled “medium” in the drop down menu in the stretch window.
MaxIm DL can also be used to calibrate images, stack images using several algorithms,
and to convert images to color, do astrometric measurements, and differential photometry. Most
of these procedures are of a “black box” variety, and so of limited usefulness in scientific
evaluations. Its ability to calibrate images may prove useful however, as these routines are
simple image arithmetic. Considering how easy it is to enter a set of calibration frames,
establish a script for calibrating images, and then enter a list of files to calibrate, some observers
Figure 3.5: Comparison of two versions of the same image with different settings for the stretch. The “screen stretch” window between the two is showing the binning of the intensity levels for the version on the right. It is a linear “stretch” between the
3.3.2 TheSky 6
Just as MaxIm DL is used to control the camera systems, TheSky 6 by Software Bisque is
used to control the telescope. TheSky 6 is an example of a planetarium program. The working
display is a screen showing the night sky for the observing site. This display can be adjusted to
show stick diagrams of constellations, full pictures of the constellations, horizon or right
ascension and declination based reference lines, other reference lines (galactic equator, ecliptic,
etc.), variable stars, binary stars, and other common objects, including some of their names.
Figure 3.6 is a screen capture of TheSky 6's display. In this image the display is set to show
constellation stick drawings, boundaries, and names, the names of named bright stars, and the
names of notable objects such as Messier objects. The catalogs it uses for its star database
include Bayer, Durchmusterung (DM), Flamsteed, General Catalog of Variable Stars (GCVS),
Guide Star Catalog (GSC), Henry Draper (HD), New Catalog of Suspected Variables (NSV),
Smithsonian Astrophysical Observatory (SAO), Struve Double Star (STRUVE), and Washington
Double Star. TheSky also has the capability for a user to add catalogs or user defined objects to
its database.
When TheSky is connected to the telescope, a cross-hair reticule will appear in the
display, indicating where the telescope is currently pointing. To move the telescope to a different
object requires either moving the cursor to that object and clicking, then telling the telescope to
slew to that object via that button, or by clicking on the binocular icon on the tool bar (the Find
button) and entering the name of the object to be observed. The format TheSky uses for some
catalog designations is different than the format used by SIMBAD. For example SIMBAD gives
the GSC designation for a star as GSC 00246-01238. In TheSky this identifier would be entered
declination coordinates if no cataloged object is in the desired field. The telescope can also be
moved manually. This is done with the Motion Controls menu under the Telescope drop down
on the toolbar (alt+M).
Another feature of TheSky is that field of view indicators can be set so that an
approximate indication of the field of view for the camera and telescope can be seen without
necessarily taking an image. This field of view can also be rotated which can help in identifying
a star field from an image. This is done by going to the Field of View menu under the View drop
4 TELESCOPE-CAMERA SYSTEM ANALYSIS
In this section empirical measurements of characteristics of the camera-telescope system
as configured at HLCO will be discussed. These include the pixel (or plate) scale, the linearity
of the CCD's response to illumination, stability of bias frames, dark current, flat fielding
strategies, gain and read noise, and limiting magnitudes of the system.
4.1 Observations
The analysis is based on data taken on July 22, 2011 and January 5, 2012. For both sets
of observations the camera's temperature set point was -25C. All data were taken with the
camera's pixels unbinned (1x1 binning). The camera's readout bit size was set for 16-bits, giving
a digital range of zero to 65535, analog-to-digital, for pixel values in the output images.
Images of the open cluster Messier 29 (NGC 6913) were used in determining the pixel
scale and limiting magnitudes. All of these images were taken on July 22, 2011 with no clouds
visible. Observations began at 0222 UT (July 23), approximately two hours after sunset for that
date. The Moon was in its waning quarter phase and had not risen by the end of the
observations.
4.2 Pixel Scale
Determining the pixel scale, expressed in arcseconds per pixel, of the Apogee Alta
camera and the 20” RC telescope was done using an image of Messier 29. TheSky 6 was used to
get approximate coordinates for 49 relatively bright stars, spread over the entire field of view,
and none had obvious close companions. The SIMBAD database was then used to obtain more
accurate coordinates for these stars. The coordinates from SIMBAD used were the ICRS J2000
and were referenced to the catalog indicated in the particular star's name – The Tycho-2
All Sky Catalog of Point Sources for 2MASS designations. Proper motions were not taken into
consideration. Table 4.1 gives the name and coordinates for each of the stars and Figure 4.1 is an
annotated image of Messier 29 showing where each of the 49 chosen stars are located in the
field.
Table 4.1: Stars Used for Pixel Scale Determination
Number Designation Right Ascension Declination
1 TYC 3152-1235-1 20h 24m 55.181s 38º 33' 27.280”
2 TYC 3152-1019-1 20h 24m 26.017s 38º 35' 26.017”
3 GSC 03152-02072 20h 24m 20.770s 38º 39' 46.300”
4 GSC 03152-02000 20h 24m 24.833s 38º 40' 25.380”
5 GSC 03152-01089 20h 24m 23.250s 38º 40' 55.600”
6 GSC 03152-01071 20h 24m 39.990s 38º 36' 46.600”
7 GSC 03152-01137 20h 23m 58.950s 38º 33' 36.060”
8 GSC 03152-01309 20h 23m 59.550s 38º 31' 47.960”
9 GSC 03152-02031 20h 24m 3.277s 38º 36' 4.320”
10 GSC 03152-01367 20h 23m 46.243s 38º 31' 16.540”
11 GSC 03152-01453 20h 23m 26.053s 38º 36' 14.410”
12 GSC 03152-2024 20h 23m 46.324s 38º 34' 39.830”
13 GSC 03152-1185 20h 23m 22.776s 38º 33' 5.240”
14 GSC 03152-01341 20h 22m 56.920s 38º 36' 17.580”
15 GSC 03152-01107 20h 23m 0.344s 38º 37' 26.420”
16 GSC 03152-01317 20h 22m 43.890s 38º 38' 11.400”
17 GSC 03152-01401 20h 23m 57.503s 38º 30' 34.760”
18 GSC 03152-00522 20h 23m 55.082s 38º 29' 8.080”
19 GSC 03152-00160 20h 24m 1.610s 38º 29' 14.800”
20 GSC 03152-02047 20h 24m 3.206s 38º 28' 16.240”
21 GSC 03152-01467 20h 24m 17.241s 38º 31' 13.780”
22 GSC 03152-00236 20h 24m 25.227s 38º 29' 6.870”
23 GSC 03152-01239 20h 24m 22.731s 38º 33' 22.770”
24 GSC 03152-00606 20h 24m 36.192s 38º 26' 35.070
26 GSC 03152-00030 20h 24m 13.339s 38º 25' 48.280”
27 GSC 03152-00054 20h 23m 58.726s 38º 25' 57.270”
28 GSC 03152-01873 20h 24m 3.572s 38º 24' 10.050”
29 GSC 03152-00682 20h 24m 20.147s 38º 18' 18.530”
30 TYC 3152-146-1 20h 24m 9.876s 38º 19' 40.000”
31 TYC 3152-1104-1 20h 23m 59.557s 38º 19' 30.610”
32 GSC 03152-01915 20h 23m 50.834s 38º 28' 17.620”
33 GSC 03152-00306 20h 23m 45.440s 38º 28' 34.980”
34 TYC 3152-676-1 20h 23m 42.837s 38º 28' 33.310”
35 TYC 3152-1046-1 20h 23m 51.124s 38º 17' 20.610”
36 TYC 3152-590-1 20h 23m 56.946s 38º 16' 22.960”
37 GSC 03152-00016 20h 23m 49.630s 38º 21' 29.600”
38 GSC 03152-00710 20h 23m 43.070s 38º 20' 20.700”
39 GSC 03152-00974 20h 23m 39.251s 38º 25' 16.480”
40 GSC 03152-01112 20h 23m 33.736s 38º 27' 30.500”
41 2MASS J20230453+3823599 20h 23m 4.540s 38º 24' 0.000”
42 GSC 03152-00832 20h 22m 59.845s 38º 25' 42.230”
43 TYC 3152-450-1 20h 23m 4.700s 38º 26' 57.500”
44 TYC 3152-184-1 20h 23m 27.849s 38º 29' 0.710”
45 2MASS J20231648+3827539 20h 23m 16.490s 38º 27' 54.000”
46 GSC 03152-00866 20h 22m 56.710s 38º 29' 3.200”
47 TYC 3152-1465-1 20h 22m 59.550s 38º 30' 0.000”
48 TYC 3152-1209-1 20h 23m 4.682s 38º 32' 36.480”
The next step was to determine the pixel location of each of the 49 stars. For this reason
care was taken so that none of the 49 stars chosen were saturated or close to saturation. The
IRAF routine daofind was then used to find the location of the centroid of each of the stars,
which was then taken as the x, y coordinates of the star in the image.
Stars were grouped into sets of seven allowing for nn−1
2 =21 comparisons
between stars in each group. These groups were chosen arbitrarily from the list of 49 without
regard to using all 49. The criteria used in choosing stars from the list for the groups of seven
stars is described below. In each case the angular separation between pairs of stars was
determined using the formula:
where a is the angular separation, d1 and d2 are the declinations of the two stars, and R1 and R2
are the right ascensions. A pixel distance was also determined for each pair using the basic
geometric distance formula:
s=
x1−x22y1−y22where s is the distance in pixels between the centroids of the two stars and x and y are the x, y
coordinates of the centroids of the two stars.
To avoid the effects of any edge distortions that might be present, the first five groups of
seven stars were chosen from the central region - a square 800 pixels on a side and centered on
pixel (1024,1024) - of the image. For each group a plot was made of angular separation versus
pixel distance, and a best fit to the linear trend was determined using the method of linear
regression. The slope of the regression line is the pixel scale in arcseconds per pixel. An
example of one such plot is shown in Figure 4.2. With five groups, five independent plots were
( )
( ) ( )
1 2( ) ( ) (
1 2 1 2)
constructed. From these plots the mean value for the pixel scale in the central region of the CCD
is 0.743 arcseconds/pixel with a standard deviation of 0.008 arcseconds/pixel.
This average value can be compared to the theoretical value obtained using the equation
P=206265× 1000×f
where μ is pixel size in microns and f is the focal length of the telescope in millimeters. From
this calculation the pixel scale should be 0.752 arcseconds/pixel. For the central region of the
image then, the pixel scale is within 1.1% of the expected value.
To test for distortions in the image, five groups of seven stars were chosen so that four
stars where again in the central region of the image as designated by the 800x800 pixel block
centered on the center pixel of the image and the remaining three stars in the group were from
stars outside of this central region. Another four groups of seven stars were chosen so that all of
the stars were outside of the designated central region, but still within 600 pixels of each other.
Using the same methods as described above, the mean pixel scale determined for the five
groups where stars came from the center and from more distant stars was found to be 0.697
arcseconds/pixel with a standard deviation of 0.009 arcseconds/pixel. For the four groups where
all of the stars were from the same region on the edge of the field, the mean scale was found to
be 0.686 arcseconds/pixel with a standard deviation of 0.073 arcseconds/pixel. Tables 4.2, 4.3,
Table 4.2: Fit Results for Groups From Central Square of 800 x 800 Pixels
Group Calculated Pixel Scale (arcseconds/pixel)
1 0.749
2 0.751
3 0.741
4 0.745
5 0.730
Table 4.3: Fit Results for Groups With 4 Stars From Center and 3 From Edges
Group Calculated Pixel Scale (arcseconds/pixel)
1 0.704
2 0.704
3 0.699
4 0.682
5 0.696
Table 4.4: Fit Results for Groups With All Stars From Outside Center 800 x 800 Pixels
Group Calculated Pixel Scale (arcseconds/pixel)
1 0.656
2 0.604
3 0.707
4 0.775
From these values it is apparent that the entire field of the image is not flat and does
suffer from some distortion on the edges of the field. The particular type of distortion exhibited
by this system is called “barrel distortion.” Barrel distortion occurs when the pixel scale of an
image decreases away from the center. Visually it causes the center of an image to seem to bulge
out at the observer. Figure 4.3 shows a diagram of what happens to a set of parallel lines under
4.3 Flat Fields
Flat fields are a type of calibration frame used to normalize the sensitivity of the pixels in
a CCD. It is created by evenly illuminating the CCD, thereby testing the response of each pixel
in the array. A raw light image of the celestial object can then be divided by this flat field on a
pixel by pixel basis to normalize the response of all the pixels in the image.
Typically there are two methods of obtaining flat fields at HLCO. These methods are that
of sky flats taken either at dusk or dawn, or dome flats where the interior of the dome is
illuminated by use of either a projector or the dome's own interior lighting. Both methods have
their benefits, and both have their issues. These will be discussed further in Sections 4.3.1 and
4.3.2. An issue common to both however involves the camera's shutter.
Due to the camera's sensitivity, extremely short exposures of bright objects must be used
to avoid saturating the pixels or at least entering the non-linear regime of the CCD. The
difficulty here is the camera body's shutter. The camera body uses a Melles Griot electronic
shutter. From information provided by the manufacturer of the shutter, it has a typical maximum
reaction speed of 0.0333-second. Any exposure, flat field or otherwise, thus shows effects of the
opening and closing of this shutter if their exposure times are not significantly longer than this
shutter speed as illustrated in Figure 4.4.
Because of this issue with the shutter, any source of illumination used in making flat
fields must be of low enough intensity so as to allow for exposures to be at least three to four
seconds in length. This limits the effective time for taking sky flats to a point during dusk or
dawn when the light levels are low enough, but they will also be changing very rapidly.
Conversely, the dome's interior lights must be tuned to a very low level, at which point their
Another issue that was found to be present no matter how flat fields are taken, dome or
sky, was that of a repeating pattern that appeared on the flat fields. Figures 4.5 and 4.6 are two
different flats that show this pattern. The binning in these images is shifted to emphasize the
pattern. There is only a 3% difference in the count level between the brightest parts of the
pattern in each block and the darkest. The effect is most noticeable with the U and B filters, but
is present with all filters. Since the pattern appears in both dome and sky flats, it is not an
artifact of some pattern on the dome. In order to check this though, the telescope position was
changed when making dome flats to verify that the pattern did not change due to some aspect of
the dome itself; the pattern was present regardless of telescope position. Apogee technical
support was consulted on the matter and it was found that the pattern is indeed an artifact of the
CCD's manufacture. A p+ layer is added to the silicon and activated via a raster laser. The
activation process is non-uniform, and so the pattern itself is non-uniform. It is most prominent
at shorter wavelengths where the photons are absorbed in the first micron of the CCD's surface.
4.3.1 Dome Flats
The typical procedure at HLCO for taking dome flats is to use an overhead projector
aimed at a different portion of the dome from where the telescope is pointed. In taking flat fields
with the 20-inch telescope and Alta U230, however, the projector is simply too bright. Even
through the U filter the exposures had to be so short that the effects of the opening and closing of
the shutter are unavoidable. For this reason the dome lights were instead used. With the dimmer
switch dialed down to near its minimum setting, even a flat taken with no filter took 10-seconds
of exposure time, which avoided the shutter effects. The regular pattern mentioned above is also
Figure 4.7: In this flat field taken through the R-band filter, the pattern of "blocks" is barely visible. The exposure time is 7-seconds, and there is also no evidence of the issue of the shutter's opening and closing being a noticeable effect.
Figure 4.6: This flat was taken through the B-band filter using the dome's illumination. It is an 8-second exposure and still shows the same pattern as the image in Figure 4.7. The
[image:59.612.75.316.90.316.2]telescope was also repositioned between the two images, to make sure that the pattern was not due to some patterning from the dome itself that was being captured.
[image:59.612.72.322.425.650.2]With the dome lighting tuned to this low level the lights are noticeably redder. For most
observers, this will likely only create an issue of needing to lengthen the exposure times for the
U, B, and possibly V filters. If precise spectral response in the observations is a concern, this
may be a factor to take into consideration when choosing which method to use in obtaining flat
fields.
The major benefit for taking flat fields using this method is that it produces a stable
intensity level. With the download time for a full frame image (without binning of the pixels)
averaging around 7 – 8 seconds, light levels change significantly with sky flats over the course of
11 flat fields. The uniform intensity also means that flat fields can be setup as a sequence and
then left to run without the need to monitor them constantly.
4.3.2 Sky Flats
The advantage of taking flat fields on the sky is that the spectral distribution of the sky is
going to be closer to that of stars, since it is coming from the Sun. There may also be less to
worry about as far as stray light, reflections off the dome, multiple light sources (computer
monitors, flickering hard drive lights, etc.), and movements of personnel within the dome casting
shadows or even moving between the dome and the light source. For some observers taking flat
fields on the sky may also fit the idea of what a flat field is better, and thus there may be a
preferential inclination. That said, with this system sky flats present a host of problems.
Most of the problems are inherent to the sensitivity of the system. In order not to saturate
the pixels of the CCD, it must be dark enough, and this only occurs at dusk or dawn when the
sky brightness is changing rapidly. As an example, over the course of 3.20-minutes flat fields
taken through the V filter had to have the exposure time lengthened from 40-seconds to
field in the sequence still has an average count level that is one half that of the first flat field
taken through the V filter. These flat fields are therefore definitely not of uniform intensity from
one to the next, much less from the start of the sequence to the last. It also means that an
observer cannot set an exposure length, cue a sequence into MaxIm DL to take the flat fields, and
then walk away. The intensity levels simply must be monitored unless the sequence is only three
or four images.
Not long after the sky is dim enough for sky flats, stars are beginning to be able to be
detected through the solar glare. Figure 4.8 is an example of one of the V band flat fields taken,
and shows the streak of an out-of-focus star going through the field. The length of the exposure
for Figure 4.8 was 40-seconds. The telescope was not tracking at the time the flat fields were
being taken, so the effects of the presence of stars showing through can be removed via median
4.4 Linearity
Another concern when working with a CCD imaging system is the linearity of the
response of the CCD. If a CCD behaves linearly, then there is a simple linear relation between
the number of photo-electrons collected by the CCD and the digital output range of the CCD.
The digital output range for a CCD camera is determined by the bit-size of the analog-digital
converter (ADC) of the camera's electronics. The Apogee Alta U230 camera uses a 16-bit ADC,
which gives an output range of 0 to 65,535, with a count reading of 65,535 indicating that the
referenced pixel is saturated. While CCDs are linear over a portion of their response range, at
some level a CCD will start to respond non-linearly.
To test the linearity of the U230's CCD a series of dome flats were taken with exposures
ranging from 5-seconds to 39-seconds. The interior lights of the dome, tuned to a low setting,
were used as the light source for illuminating the dome in taking these flats. For exposure
lengths of 5-seconds to 38.9-seconds, three exposures of the same length were taken to improve
the statistical significance of each temporal measurement. Only one exposure of 39-seconds
exposure length was taken because it was noticed that only the vignetted pixels at the corners of
the flat field were not saturated.
Analysis of the flat exposures was done using the imstat routine in IRAF. The mean,
median, standard deviation, and skew values were calculated for a central box of 1000 x 1000
pixels for each flat field. The skew is the third moment of a distribution, and was determined as
a check on the Gaussian nature of the pixel value distribution. For a perfectly Gaussian
distribution, the mean should equal the midpoint and the skew should be zero. A positive skew
represents a distribution with a longer tail on the positive-valued side of the distribution, and a
to calculate the skew by the imstat routine uses the following formula:
skew= 1
N−1
i=1N
yi
3
where N is the number of observations, σ is the standard deviation, and yi=xi− , where μ is
the mean and xi is an individual value from the data set. The first three moments of a distribution
[image:64.612.71.542.255.708.2]will be given a more formal treatment in Appendix B. Table 4.5 lists the results of this analysis.
Table 4.5: Data and Analysis of Flat Fields for Testing CCD Linearity
Image Exp. (sec.) Mean Median Std. Dev. Skew
1 5 7539 7527 105.3 0.2923
2 5 8634 8620 118.2 0.4082
3 5 8726 8713 119.5 0.3341
4 7 12095 12077 156.0 0.4728
5 7 11965 11942 154.2 0.4313
6 7 12177 12153 156.7 0.4612
7 9 15750 15723 193.0 0.4435
8 9 15790 15767 193.7 0.5104
9 9 15742 15711 192.9 0.4731
10 11 19764 19734 228.0 0.4097
11 11 19292 19263 223.2 0.4770
12 11 19301 19273 223.0 0.5463
13 13 22782 22743 260.8 0.5807
14 13 22583 22545 258.7 0.4266
15 13 22183 22145 254.2 0.4699
16 15 25623 25570 291.2 0.5762
17 15 25539 25570 290.3 0.5204
18 15 25570 25525 290.8 0.4484
19 20 32951 32889 370.0 0.4633
20 20 33148 33084 372.3 0.4656
21 20 33277 33211 373.7 0.4946
23 25 41369 41292 460.9 0.5641
24 25 41528 41461 463.3 0.5280
25 30 49146 49050 545.4 0.5392
26 30 51589 51485 571.3 0.5752
27 30 50916 50833 564.3 0.6368
28 33 57526 57422 623.8 0.5883
29 33 57823 57705 626.6 0.5660
30 33 57429 57323 622.3 0.4942
31 35 59761 59640 647.6 0.5806
32 35 59968 59866 649.7 0.5806
33 35 60610 60471 656.8 0.5766
34 36 60493 60375 655.2 0.4930
35 36 60001 59869 650.1 0.5316
36 36 60001 59866 649.7 0.5806
37 37 64165 64048 651.6 0.3401
38 37 62089 61946 672.3 0.4982
39 37 61959 61847 671.0 0.5511
40 37.5 62669 62539 678.9 0.5328
41 37.5 62949 62805 681.9 0.5114
42 37.5 62614 62477 678.4 0.5508
43 38 63335 63226 685.8 0.5278
44 38 63261 63142 685.2 0.5840
45 38 65104 65240 360.4 -1.400
46 38.1 65396 65397 20.87 179.3
47 38.1 64237 64149 640.7 0.2122
48 38.1 62329 62207 675.0 0.5712
49 38.2 65396 65396 17.42 -298.4
50 38.2 63592 63487 686.0 0.5505
51 38.2 62106 61970 672.1 0.4944
52 38.3 65359 65392 116.9 -0.9712
53 38.3 63388 63258 686.0 0.5837