RASCH MODEL ANALYSIS ON THE FEASIBILITY TEST OF BASIC
PHYSICS II PRACTICAL GUIDE USING AUGMENTED REALITY
Eko Risdianto, Aris Darmawan, Muhammad Kristiawan, Wachidi and Riyanto
Universitas Bengkulu, Indonesia E-Mail: [email protected]
ABSTRACT
This paper aimed at analyzing the response of the feasibility of guiding principles of Basic Physics II using Augmented Reality (AR) technology on electrical and geometric optical circuit material. This research is a part of research and development with the development model used that is 4D Development, which are Define, Design, Develop and Dissemination adapted. Response questionnaire practicum responses were given to students of the University of Bengkulu Physical Education Study Program in a small group of 20 people. Analysis of the feasibility test used the Rasch model using the Winsteps program. The analysis includes the respondent's ability, the response item's ability, the level of correspondence of the respondent and the suitability of the response item. From the results of the feasibility test analysis of the practicum guide shows that the practicum guide is feasible to use. This is indicated by data from the variable map data which shows the majority of respondents are in the logit value of the respondent is +2.4 and is above the response item. Overall respondent's ability is higher than the difficulty of the item response. It means that almost all respondents agreed on all aspects of the response items provided.
Keywords: augmented reality, rasch model, practical guide.
INTRODUCTION
Along with the development and changing times, changes in human behavior and behavior change from time to time. It also changed the development of the education system in the world and in Indonesia in particular (Maseleno et al, 2019; Sarina et al, 2019; Wandasari et al, 2019; Risdianto, 2019a);. This change can be seen from changes in the education system which consists of learning, teaching, curriculum, student development, ways of learning, learning tools, infrastructure and competence of graduates from time to time. In behaviorist learning theory explains that learning is a change in behavior that can be observed directly, which occurs through the relationship of stimuli and responses according to mechanistic principles (Andriani et al, 2018; Renata et al, 2018; Khasanah et al, 2019; (Izzatur Rusuli, 2014). The education system is a strategy or method used in the teaching and learning process to achieve goals so that students can actively develop their potential (Andran, 2014). Education is a very important human activity. Through education, humans can be educated into human beings who behave nobly (Sasongko & Sahono, 2016). According to (Bpkm.go.id, 2006), Education is a conscious and planned effort to create an atmosphere of learning and learning process so that students actively develop their potential to have spiritual strength, self-control, personality, intelligence, noble character, and the skills needed by themselves, the community, the nation and the state (Apriana et al, 2019; Lian et al, 2018; Tobari et al, 2018; Irmayani et al, 2018; Salwa et al, 2019). According to (Fitria et al, 2019)education is a continuous process on building the character of students better to develop physically and mentally, which is free and conscious to the god, as manifested in the intellectual, emotional and humanity of human nature. Due to the explanation above, it can be implied that education is an active process in maximizing
students’ potential and character values implemented in the classroom and in their environment (Kristiawan & Tobari, 2017; Kristiawan, 2015; Sayer et al, 2018; Wachidiet al, 2019).
In physics learning, it is significantly needed learning media where the use of learning aids or learning media is an inseparable part of the learning process and is a form of integration of the learning methods used (Risdianto, 2008). One of the very interesting and concrete media is learning media based on interactive multimedia(Marianda, Johar, & Risdianto, 2014). In physics learning, one of the activities to realize good education is to conduct practical work. In carrying out good practicum activities, a practical guide or guide is needed. It is expected that the dynamic and interactive practicum guides can provide a better understanding of the practicum activities. Indirect impacts obtained by practicum guides made based on technology can improve the ability of teachers in the field of ICT mastery. It is in line with (Kristiawan, 2014)which explains that computer science does not only include in the curriculum but how teachers acquire good knowledge in teaching ICT skills to students.
(Budiarti & Oka, 2017), practicum guides can help students in practicum activities. Currently, the trend of digital literacy and technology is increasing(Risdianto, 2019).
Currently, students are very familiar with the use of technology so that it brings changes to the learning class. Almost all students now have mobile technology devices.The device can be used to access a lot of learning information in the form of electronic teaching materials. Electronic teaching materials are teaching materials which contents are made in electronic form (made using electronic devices) that can be in the form of audio, audio visual, or in the form of interactive multimedia (Risdianto, 2017)
In research (Eastman, Iyer, & Eastman, 2009) states that the interactive use of technology can improve student attitudes. In the Industrial Revolution 4.0,Agumanted Reality or abbreviated as Augmented Reality is a part that will not be separated from future education. Augmented Reality technology is believed to change and become an increasing trend in learning in the future (Bacca, Baldiris, Fabregat, Graf, & Kinshuk, 2014). Augmanted Reality is an interactive form of technology that combines virtual technology with the real world. According to (Lenurra & Pratiwi, 2017) Augmanted Reality is a merging of 3D projects into a real environment. With Augmanted Reality technology we can realize 2D images into 3D so that they look realistic. Some reasons for the use of Augmented Reality technology is that using Augmanted Reality in learning can help explanation in the concept of learning that is abstract or cannot be present in real learning, Augmanted Reality technology can be accessed through any gadget and at any time. Learning using Augmanted Reality can also be combined in blended learning methods (Risdianto, 2019b). Practicum guides embedded with Augmented Reality technology are also expected to meet important principles in a learning that is attracting attention(Wachidi, 2017). Based on the explanation above, the development of basic physics practicum guides II using Augmented Reality technology is expected to be able to provide guidelines for the implementation of practicum which is interactive, interesting so that it can facilitate students in understanding the process of conducting practicum activities better.
The initial product development guide to Basic Physics II practicum using Augmented reality (AR) technology on geometric electrical and optical circuit material has been conducted and shows that the practical guide is valid to use (Dermawan Siahaan, Medriati, & Risdianto, 2019). Rasch modeling can be used for analyzing the quality of the questions, knowing the level of student ability and the level of difficulty of the problem, to the detection of misconceptions, the existence of bias in the problem, or knowing that there are students cheating (Sumintono & Whidhiarso, 2015). It shows that Rasch modeling can also be used for analysis of questionnaire responses given to respondents about a product that they want to make in this case is a guide to basic physics practicum 2 based on Augmented Reality. By analyzing
using this modeling, it is expected that information about the feasibility of this practicum guide can be known from the quality of the questionnaire responses provided.
RESEARCH METHOD
The research method used in developing basic physics practicum guides II Using Augmented Reality (Ar) on geometric electrical and optical circuit materials is the Research and Development (RND) method. The model used is the 4D development model (Define, Design, Development, and Dissemination). The initial product development of this practical guide has been conductedand has been declared valid by several experts. In this follow-up study, an analysis of the quality of the questionnaire responses was used to test the feasibility of this practicum guide. To test the feasibility of an Augmented Reality-Based Basic Physics Practicum, a limited trial was conducted using a response questionnaire containing 25 indicators and given to 20 respondents. The aspects assessed include aspects of appearance, content, learning, readability and practicality. This type of questionnaire data is a type of political data that is the type of data that not only provides true or false data (dichotomy) but on the level of quality of the answers provided (in this case, the response uses the Likert scale). Further analysis will be conducted by analyzing the item questionnaire response items using Rasch modeling using the Winstep Program.Analysis with Rasch model produces a fit statistical analysis which provides information to the researcher whether the data is ideally illustrated that people who have high ability provide patterns of answers to the items according to their level of difficulty(Sumintono & Whidhiarso, 2015).
RESULTS
Figure-1. Map variable.
DISCUSSIONS
Figure-1 consists of a measure (showing the logit scale), person shows the distribution of students' abilities, items that indicate the spread of the level of difficulty item of items questionnaire answered by respondents. From the above data, it can be seen that almost all respondents have a high level of ability in answering the questionnaire items given. In the item questionnaire, items that have the highest level of difficulty to be answered by respondents is P19 (P19 is question item questionnaire number 19). The average logit person is +2.4 while the average logit item is 0.0. From the variable map data, it can be seen that respondents who have the highest ability in the ability to answer are respondents no.9 and those who have the lowest ability are respondents no. 19. From the variable map data, it can be seen that even though respondent no.9
has the lowest ability, it is still able to answer the most difficult item of response, which is no 19. It means that almost all respondents agreed to all items of the questionnaire responses given, which means that almost all respondents states that practicum guides are declared appropriate(Dermawan Siahaan et al., 2019).
To the right of the Wright map, 25 items of response questionnaires have varying degrees of difficulty varying from P1, P10 and P14, which are the most difficult response questionnaires to P13, P23, P25 and P4 which have the lowest response item ability. If we look at the distribution of these response items, although they are diverse, they are somewhat grouped. It shows that the questionnaire response items made have a slight weakness that can be evaluated on the questionnaire items made in the process of developing the next practical guide. Next, we will analyze the M-S-T distances found on the Wright map above. It can be seen that the respondent's ability is only slightly wider than the distribution in the level of difficulty of the response item. In the context of the level of difficulty, It contained in the response item,itmeans the item response items have diversity that is not too far apart and the respondent's ability is not much different. This is in accordance with (Sumintono & Whidhiarso, 2015) which states that if there is a wider distribution of person ability compared to the distribution of items, it can be concluded that the level of person (respondent) ability is different.
Analysis on the comparison of logit person and logit response item based on map variable maps shows that the logit person is much higher than the logit person response item. It shows that the overall respondent's ability is higher than the difficulty of the item response. It is indicated by almost all respondents agreeing on all aspects of the response items provided.
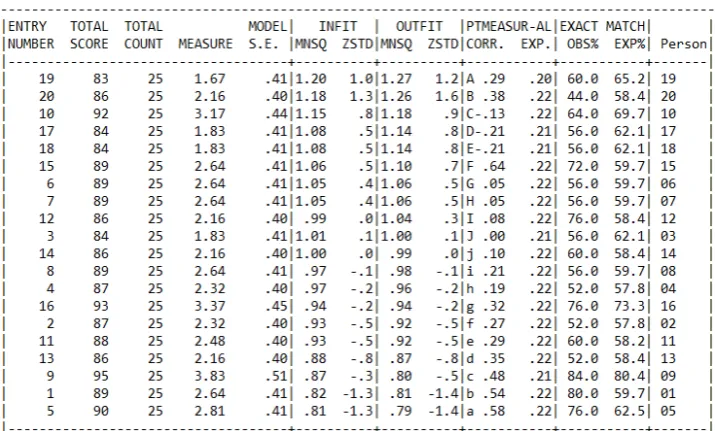
Table-1. Analysis of response items.
From Table-1, Analysis of Response Items above, it can be seen that in the total count all were filled with 20. It shows that all respondents answered all items given. In the picture above, the item column shows the level of difficulty of the item which is the most difficult item of the
questionnaire response that is P19 and the easiest is P25 shown in the measure column. According to (Sumintono & Whidhiarso, 2015), information on the level of difficulty of the item makes it easy for us to identify which questions are difficult and which are easy.
Table-2. Level of suitability of the problem.
In Table-2, the Level of Compliance Problem above contains the item fit table (item conformity). To determine the response item data, it has a good fit if the value of Outfit Mean square (0.5 <MNSQ <1.5),
Table-3. Table criteria misfit or outliers.
Value Interval
Outfit Mean Square value received 0,5<MNSQ<1,5
Z-Standard Outfit Value received -2,0<ZSTD<+2,0
Point Measure Correlation Value 0,4<PT Measure Corr<0,85
If all the values obtained are not in the specified value range, the item needs to be reviewed again. From the data above, it can be seen from all items for the Outfit Mean Square value, only item no.19 has an MNSQ of 2.43 which is outside the specified value interval. Likewise, the ZSTD value of 2.7 is also outside the specified interval. However, the Corr value of 0.06 is still within the limits of acquisition. Therefore, item no.19 can be maintained and does not need to be changed. According to (Sumintono
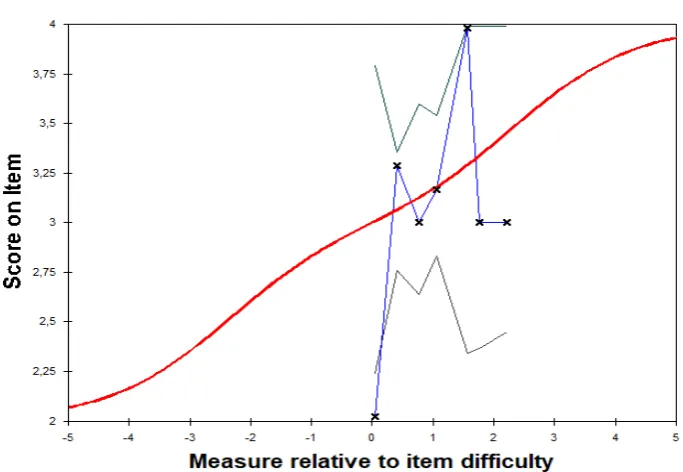
[image:5.595.127.469.320.556.2]&Whidhiarso, 2015) if there is 1 criterion that still meets the required criteria, the item does not need to be replaced or can be maintained. ZSTD value is influenced by sample size. If we use a very large sample, the ZSTD value will always be above the value of 3. The following shows the suitability curve for response item no.19 in the curve figure below.It appears that there are 2 responses that are outside the Outfit trust space limit.
Figure-2. ICC expected score graph.
Table-4. Person measure order table.
Based on Table-4, the Person Measure Order Table in the total score column looks at the total score obtained by each respondent. While the total count column is the number of questionnaire items answered by the respondent. From the data above, it can be seen that all respondents answered all 25 items of the questionnaire responses that were given. In the picture above, the measure column shows the ability of each respondent in logit units. Respondent 9 has the highest value of measure = +3.83 and respondent no19 has the lowest value with measure = 1.67. from the data above, some respondents have the same logit value, it means that the raw score is the same (total score) as well as their ability (Sumintono & Whidhiarso, 2015). To see further which respondents who
have higher ability, it can be seen from the scalogram. A scalogram can be used to see which respondents have higher abilities even though they have the same logit value. The level of ability here is the ability of responses to approve the questionnaire responses given to the practicum guide.
[image:6.595.119.477.544.759.2]Next is analyzing the suitability of the respondents. Besides, we will also analyze the results of the respondents' suitability. It aims to determine the consistency of thinking of the respondents in filling out the questionnaire responses provided. Conformity criteria is the same as those used in Table-3 of the Misfit or Outliers Criteria Tables above
In the Table above, it can be seen that all respondents have at least 1 value of the specified boundary criteria as in Table-3 of the Criteria Table of Misfit or Outliersand to see more complete conformity can be seen in the following Guttmann matrix
Figure-3. Gutmann respondent matrix.
By using the Gutmann Matrix, we can see the pattern of answers from each respondent. From the above data, there are similar answers from respondents no. 6 and 7, as well as 17 and 18. It could be an indication that the respondents cooperated with each other or cheated in the implementation of filling in the questionnaire items so that they needed to be re-evaluated.Furthermore, the response pattern above also shows that there are some inconsistent responses. In certain items, they tend to approve statements (get high/difficult score items) while other items tend to reject (get low/easy score items). It is in line because the respondents lacked motivation in filling out the questionnaire given. It is in line with research(Widhiarso, 2013) which stated that the low motivation causes them to give careless responses. The impact is that their responses vary and are inconsistent, depending on their mood when responding to the items. However, it does not affect the overall response results.
CONCLUSIONS
Based on the analysis of the Rasch model conducted on the results of the response of this practical guide, it can be concluded that the quality of the questionnaire responses to the physics practicum guide is very good. Thus, it can be used to test the feasibility of augmenter reality-based physics practicum guides. Moreover, the results of the analysis of respondents and questionnaire items showed that the majority of respondents agreed with all questionnaires given so that it
showed that the guide to augmented reality physics practice was appropriate to use. Nevertheless, further research needs to be done to test the effectiveness of this practicum guide and also this AR technology can be used for other types of practicum subjects.
REFFERENCES
[1] Andran C. 2014. Sistem Pendidikan [Educational System]. Retrieved February 4, 2019, from https://www.kompasiana.com/andreancan/54f76a90a3 3311b0368b47ea/sistempendidikan
[2] Andriani S., Kesumawati N. & Kristiawan M. 2018. The Influence of the Transformational Leadership and Work Motivation on Teachers Performance. International Journal of Scientific & Technology Research. 7(7).
[3] Apriana D., Kristiawan M. & Wardiah D. 2019. Headmaster’s competency in preparing vocational school students for entrepreneurship. International Journal of Scientific & Technology Research. 8(8).
[4] Arsyad A. 2016. Media Pembelajaran [Intsructional Media]. Jakarta: Rajawali Press. https://doi.org/2002
[5] Bacca J., Baldiris S., Fabregat R., Graf S. & Kinshuk. 2014. Augmented reality trends in education: A systematic review of research and applications. Educational Technology and Society. https://doi.org/ISSN 1436-4522 (online)
[6] Bpkm.go.id. 2006. Indonesia Republic Law Number 20 on 2003 about National Education System. Retrieved February 4, 2019, from https://peraturan.bkpm.go.id/jdih/userfiles/batang/UU _20_2003.pdf
[7] Budiarti W. & Oka A. A. 2017. Pengembangan Petunjuk Praktikum Biologi Berbasis Pendekatan Ilmiah Untuk Siswa Sma Kelas Xi Semester Genap Tahun Pelajaran 2013/2014 [Development of Biology Practicum Guidelines Based on Scientific Approaches for High School Students of Class Xi Even Semester Academic Year 2013/2014]. BIOEDUKASI (Jurnal Pendidikan Biologi), 5(2), 123. https://doi.org/10.24127/bioedukasi.v5i2.791
and Geometric Optical Circuit Material]. Jurnal Kumparan Fisika. 2(2): 91-98.
[9] Eastman J. K., Iyer R. & Eastman K. L. 2009. Interactive Technology in the Classroom: An Exploratory Look at Its Use and Effectiveness. Contemporary Issues in Education Research. https://doi.org/10.1080/19338244.2017.1289890
[10]Fitria H., Rasyid A. & Kristiawan M. 2019. The educational character on instruction. Opcion. 35(Special Issue 21): 964–979.
[11]Irmayani H., Wardiah D. & Kristiawan M. 2018. The Strategy of SD PusriIn Improving Educational Quality. International Journal of Scientific & Technology Research. 7(7).
[12]Izzatur Rusuli. 2014. Refleksi Teori Belajar Behavioristik Dalam Perspektif Islam [Reflections on Behavioristic Learning Theories in Islamic Perspectives]. Jurnal Pencerahan. https://doi.org/10.13170/JP.8.1.2042
[13]Khasanah U., Kristiawan M. & Tobari. 2019. The Implementation of Principals’ Academic Supervision in Improving Teachers’ Professionalism in the State Primary Schools. International Journal of Scientific & Technology Research. 8(8).
[14]Kristiawan M. 2014. A Model for Upgrading Teachers’ Competence on Operating Computer as Assistant of Instruction. Global Journal of Human-Social Science, (April).
[15]Kristiawan M. 2015. A Model of Educational Character in High School Al-Istiqamah Simpang Empat, West Pasaman, West Sumatera. Research Journal of Education. 1(2): 15-20.
[16]Kristiawan M. & Tobari. 2017. The Characteristics of the Full Day School Based Elementary School. Transylvanian Review. 1(1).
[17]Lenurra F. & Pratiwi D. 2017. Penerapan Teknologi Augmented Reality Sebagai Media Promosi Apartemen Dengan Metode Markerless [Application of Augmented Reality Technology as a Media for Apartment Promotion Using the Markerless Method]. In Seminar Nasional Cendikiawan. Retrieved from https://www.trijurnal.lemlit.trisakti.ac.id/semnas/articl e/view/2167/1849
[18]Lian B., Kristiawan M. & Fitriya R. 2018. Giving Creativity Room to Students through the Friendly School’s Program. International Journal of Scientific & Technology Research. 7(7).
[19]Marianda G., Johar A. & Risdianto E. 2014. Rancang Bangun Media Pembelajaran Berbasis Multimedia Interaktif Konsep Gaya pada Mata Pelajaran Fisika SMP Kelas VIII [Design of Learning Media Based on Interactive Multimedia Style Concepts in Physics Subjects of Class VIII Middle School]. JurnalRekursif. 2(2): 112-120.
[20]Maseleno A., Ayshwary B., Ivanova T. N., Hashim W., Nguyen P. T., Shankar K., Kristiawan M., Huda M. 2019. General Theoretical and Philosophical Aspects of Modern Education. Aspectos Teóricos y Filosóficos Generales de la Educación Moderna. Revista San Gregorio 2019, No. 32 Special Issues August.
[21]Nurussaniah N. & Nurhayati N. 2016. Pembelajaran Berbasis Guided Inquiry Untuk Meningkatkan Kemampuan [Guided Inquiry Based Learning To Improve Ability]. In Prosiding Seminar Nasional Fisika. V: 63-68.
[22]Renata R., Wardiah D. & Kristiawan M. 2018. The Influence of Headmaster’s Supervision and Achievement Motivation on Effective Teachers. International Journal of Scientific & Technology Research. 7(4).
[23]Risdianto E. 2008. Pengembangan Multimedia Interaktif (MPI) pada Praktikum Fisika Dasar I [Development of Interactive Multimedia (MPI) in Basic Physics Practicum I]. Exacta. 6(2): 9-16.
[24]Risdianto E. 2017. Pembuatan Bahan Ajar Elektronik [Manufacture of Electronic Teaching Materials]. Bengkulu: Vanda.
[25]Risdianto E. 2019a. Analisis Pendidikan Indonesia di Era Revolusi Industri 4.0 [Analysis of Indonesian Education in the Era of the Industrial Revolution 4.0].
Retrieved from
https://www.academia.edu/38353914/Analisis_Pendid ikan_Indonesia_di_Era_Revolusi_Industri_4.0.pdf
[27]Salwa., Kristiawan M. & Lian B. 2019. The Effect of Academic Qualification, Work Experience and Work Motivation towards Primary School Principal Performance. International Journal of Scientific & Technology Research. 8(8).
[28]Sarina., Kristiawan M. & Wardiah D. 2019. Module Development the Utilization of Patchwork Fabric As Teaching Materials Crafts on the Subjects of Craft and Entrepreneurship For High School Students. International Journal of Scientific & Technology Research. 8(5).
[29]Sasongko R. N. & Sahono B. 2016. DesainInovasi Manajemen Sekolah (1sted.) [School Management Innovation Design]. Jakarta: Shany Publiser.
[30]Sayer I. M., Kristiawan M. & Agustina M. 2018. Fairy Tale as a Medium for Children’s Character Cooperation Building. Al-Talim Journal. 25(2): 108-116.
[31]Sumintono B. & Whidhiarso W. 2015. Aplikasi Pemodelan Rasch Pada Assesment Pendidikan (1st ed.) [Rasch Modeling application on Educational Assessment]. Cimahi: Trim Komunikata.
[32]Tobari., Kristiawan M. & Asvio N. 2018. The Strategy of Headmaster on Upgrading Educational Quality inAsean Economic Community (AEC) Era. International Journal of Scientific & Technology Research. 7(4).
[33]Wachidi. 2017. Kurikulumdan Pembelajaran [Curriculum and Instruction]. Bengkulu: Unib Press.
[34]Wachidi Nguyen, P. T., Lydia, E. L. & Shankar K. 2019. Value based Teaching, Character building. Restaurant Business. 118(10): 11-21. https://doi.org/10.26643/rb.v118i10.8778
[35]Wandasari Y., Kristiawan M. & Arafat Y. 2019. Policy Evaluation of School’s Literacy Movement on Improving Discipline of State High School Students. International Journal of Scientific & Technology Research. 8(4).