Universal Journal of Geoscience 6(1): 1-7, 2018 http://www.hrpub.org DOI: 10.13189/ujg.2018.060101
Application of Statics Correction in the Processing of
3D Seismic Data from Onshore Niger Delta
Opara, C., Adizua, O. F.*, Ebeniro, J. O.
Applied Geophysics Group, Department of Physics, University of Port-Harcourt, Nigeria
Copyright©2018 by authors, all rights reserved. Authors agree that this article remains permanently open access under the terms of the Creative Commons Attribution License 4.0 International License
Abstract
Statics correction was applied to a 3D seismic data acquired from an onshore Niger- delta field. The objective of the study was to derive a statics solution, which will correct for time shifts caused by topographic undulations, velocity anomalies in the near-surface and delayed travel times of the reflection signal through the weathered layer. In a previous study by authors, a near-surface seismic velocity and depth model, consisting of the weathering layer and three consolidated (sub-weathering) layers were first estimated. The first-arrivals were picked and used as input for this study. Statics correction consisting of elevation statics, long-wavelength refraction statics, and short-wavelength (residual statics) refraction statics was applied to the data. Interpretation of results show like differences such as a stronger alignment and coherence of reflection events, as well as an upward time shift of the reflection signals when compared with the input data (no statics applied) and the output data (statics applied).Keywords
Statics Solution, Topographic Undulations, Velocity Anomalies, Near-Surface Velocity Model, Depth Model, Coherence of Reflection Events1. Introduction
The ultimate goal in reflection seismic data processing is to obtain an accurate image of the subsurface, which is
critical for interpretation during exploration for hydrocarbons and other geological targets. Errors in static correction estimation are the sources of serious structural and stratigraphic interpretation errors. To avoid these effects we must define and introduce static corrections to the seismic records. Refraction statics methods represent techniques are based on constructing a realistic model of the shallow subsurface by inverting the refracted (first break) arrivals. For refraction arrivals recorded as part of a reflection survey, several refraction-statics methods are in broad use, such as the Plus-Minus method, Generalized Reciprocal method [1]; both which are spin-offs from the delay-time, the Generalized Linear Inverse [2] and Tomographic technique as documented by Chon and Dillon.
In this study, our principal objective is to carry out static corrections to remove distortions due to near-surface velocity variations from the onshore 3D seismic data set using the Delay-Time approach.
1.1. Location of the Study Area
Figure 1. Generalized geologic map of Nigeria showing the study area; Odeyemi et al., 1999 [4]
2. Theory
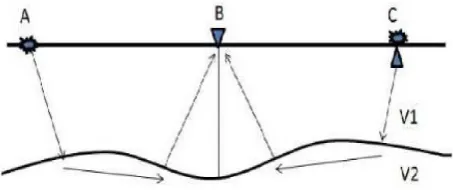
[image:2.595.75.521.79.288.2]Delay-time method is a refraction static corrections technique that uses the travel-times of critically refracted seismic energy to compute the depth and velocity structure of near- surface layers [5]. For a two-layer model with one layer over half a space, the first layer can be considered as the weathering layer with an undulating base. It shows three ray-paths associated with shot-receiver pairs AB, BC, and AC (Figure 2).
Figure 2. Theoretical ray paths for two-layer refraction delay-time model (Cox, 1999).
Assuming that the delay times for a shot point and receiver at a common location are equal, we can easily derive the following equations as shown below:
𝑻𝑻𝑨𝑨𝑨𝑨 = 𝑻𝑻𝑨𝑨 + 𝑨𝑨𝑨𝑨
𝑽𝑽𝟐𝟐 + 𝑻𝑻𝑨𝑨 (1)
𝑻𝑻𝑨𝑨𝑩𝑩 = 𝑻𝑻𝑩𝑩 + 𝑨𝑨𝑩𝑩 𝑽𝑽𝟐𝟐 + 𝑻𝑻𝑨𝑨 (2)
𝑻𝑻𝑨𝑨𝑩𝑩= 𝑻𝑻𝑨𝑨 + 𝑨𝑨𝑩𝑩𝑽𝑽𝟐𝟐 + 𝑻𝑻𝑩𝑩 (3)
𝑻𝑻𝑨𝑨𝑩𝑩− 𝑻𝑻𝑨𝑨𝑩𝑩= 𝑻𝑻𝑨𝑨− 𝑻𝑻𝑨𝑨+𝑨𝑨𝑨𝑨𝑽𝑽𝟐𝟐 (4)
𝑻𝑻𝑨𝑨𝑨𝑨− (𝑻𝑻𝑨𝑨𝑩𝑩− 𝑻𝑻𝑨𝑨𝑩𝑩) = 𝟐𝟐𝑻𝑻𝑨𝑨 (5)
𝑻𝑻𝑨𝑨 = 𝟏𝟏 𝟐𝟐(𝑻𝑻𝑨𝑨𝑨𝑨+ 𝑻𝑻𝑨𝑨𝑩𝑩 − 𝑻𝑻𝑨𝑨𝑩𝑩) (6)
𝑻𝑻𝑨𝑨= 𝒁𝒁𝑽𝑽𝑨𝑨𝟏𝟏𝐜𝐜𝐜𝐜𝐜𝐜 𝜽𝜽 (7)
𝑻𝑻𝑨𝑨 = 𝒁𝒁𝑽𝑽𝑨𝑨𝟏𝟏𝐜𝐜𝐜𝐜𝐜𝐜𝜽𝜽 (8)
𝑻𝑻𝑩𝑩 = 𝒁𝒁𝑽𝑽𝑩𝑩𝟏𝟏𝐜𝐜𝐜𝐜𝐜𝐜 𝜽𝜽 (9)
𝜽𝜽𝟏𝟏 = 𝒂𝒂𝒂𝒂𝒂𝒂 𝐜𝐜𝐬𝐬𝐬𝐬𝑽𝑽𝑽𝑽𝟏𝟏𝟐𝟐 (10)
where TAB, TAC, and TBC represent first-arrival travel times from source to receiver. TA, TB and TC are delayed travel times for shots and receiver points A, B, and C respectively. Ɵ is incident angle. ZA, ZB and ZC are the depth from shot/receiver to the refractor, and velocities in the two layers are V1 and V2. Delay times for deeper refractors can be computed in an identical manner by using further offset from the shot points. In the general case for refraction, the delayed time can be expressed as: 𝑻𝑻𝑨𝑨𝑨𝑨𝑨𝑨= 𝑻𝑻𝑨𝑨𝑨𝑨+ 𝑽𝑽𝑨𝑨𝑨𝑨𝑨𝑨+𝟏𝟏 + 𝑻𝑻𝑨𝑨𝑨𝑨 (11)
𝑻𝑻𝑨𝑨𝑨𝑨= ∑𝑨𝑨𝑨𝑨 =𝟏𝟏𝒁𝒁𝑽𝑽𝑨𝑨𝑨𝑨𝑨𝑨 𝐜𝐜𝐜𝐜𝐜𝐜𝜽𝜽 (12)
𝜽𝜽𝑨𝑨= 𝒂𝒂𝒂𝒂𝒂𝒂 𝐜𝐜𝐬𝐬𝐬𝐬𝒗𝒗𝒗𝒗𝑨𝑨+𝟏𝟏𝑨𝑨 (13)
[image:2.595.63.290.450.545.2]Universal Journal of Geoscience 6(1): 1-7, 2018 3
3. Materials, Method and Data
Processing
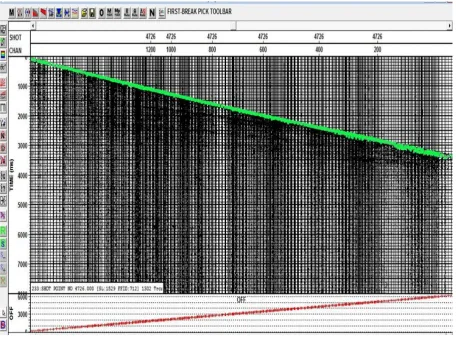
The data used in this investigation was a 3D prestack onshore seismic data with the accompanying geometry/SPS files. It had several Receiver and Source Lines. The receiver lines (6) which were trending in the North-South direction include In-lines 48, 62, 76, 90, 104, 118. The cross-lines or source lines (6) which were trending in the East-West direction include cross-lines 608, 624, 640, 656, 672, 688. First arrival travel- times from the seismic data were extracted (F i gu re 3 ) and used as input in this study. The GEDCO-VISTA software tool was used in carrying out all seismic processing steps implemented during the study.
The first step involved in the study was data binning. The data was binned using the Geometry or SPS files and each bin-grid had a dimension of 24.9m×24.9m. The Linear-moveout (LMO) velocity was used to identify geometry errors and check for departures from the location of the receivers or shot point. Linear-moveout analysis was carried out on the full data spread by the implementation of appropriate Vista flow commands.
The first break – picking was first done manually for a few shots and then automated using the automatic picker with the LMO function to pick the entire dataset and correct the results interactively by visual inspection and by performing quality control analysis on them. There were 483first-break picks with a maximum standard deviation error varying from 2 to 12. For the data, a fold value of 44 was obtained.
[image:3.595.71.528.297.636.2]Figure 4. Control point in geometry window (left) and corresponding first-break picks in offset window (right)
Calculating Elevation and Refraction Statics
[image:4.595.71.525.80.358.2]The Elevation/Refraction statics utilizes the relationship between the seismic data and first-break picks which had already been picked and saved. The procedure consists of picking a control point (either source or receiver point) across the survey area, and checking the corresponding picks for any scattering and deviations from the gather. Secondly, control points were generated all over the survey area based on the initially picked control points (Figure 4).
A control point in the geometry window is typically a collection of many shots (10-20) or groups of receivers. The control points attempt to get a reasonably accurate long wavelength picture of the near surface layer changes. An increment in the number of shots inside the circle does have a smoothing effect on the solution. A total of 1253 control points were automatically created. For this investigation, three types of refractions statics were computed: elevation statics, long wave and short wave refraction statics that were used to compute the final statics using the relation below.
FINAL STATICS = ELEVATION STATICS + LONG WAVE STATICS + SHORT WAVE STATICS. Elevation statics involves the computation and removal of the effects of different source and receiver elevations. This brings the sources and receivers to a common datum. For this, we need a replacement velocity. The replacement velocity of 1750m/s was obtained from an up-hole survey carried out in the area.
Long-wavelength refraction statics was computed by least square fitting of the first breaks of the shots inside a control point in Vista processing suite. The velocity of the layers was estimated from the slope of the first breaks and the layer thicknesses from their intercepts on the time axis. This corrects for relatively large near-surface structural anomalies.
Short-wavelength (residual) statics processing step serves to eliminate small variations of reflection travel-time caused by rapid changes in elevation, the base of weathering layer, and weathering velocity. It corrects for small near-surface structural effects. To achieve surface consistency, residual static correction techniques provide one exclusive time shift for every source or receiver location. Appropriate Vista flow commands were adapted to apply all three aforementioned types of statics to the data.
4. Statics Correction Implementation
and Results
Universal Journal of Geoscience 6(1): 1-7, 2018 5
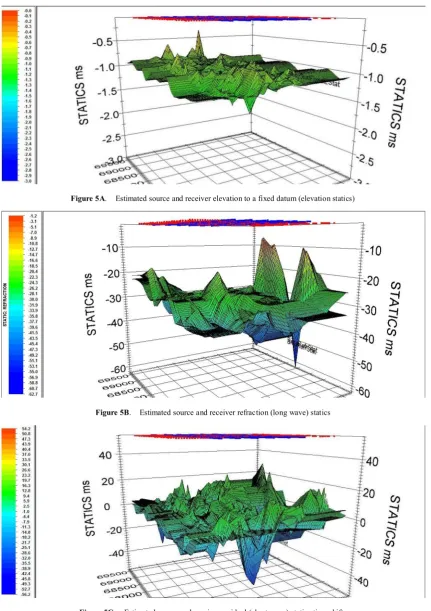
residual statics had values of +20ms to -20ms.
There were few high amplitude deviations where the estimated static time shifts do not follow the average distribution mostly at the edges where receivers were absent but most of the estimated time shifts however were
equal or close to zero. Elevation statics correction and Refraction statics were applied as well. Additional application of the residual statics correction to the data produced an enormous and remarkable improvement to the section quality.
Figure 5A. Estimated source and receiver elevation to a fixed datum (elevation statics)
[image:5.595.84.516.142.753.2]Figure 5B. Estimated source and receiver refraction (long wave) statics
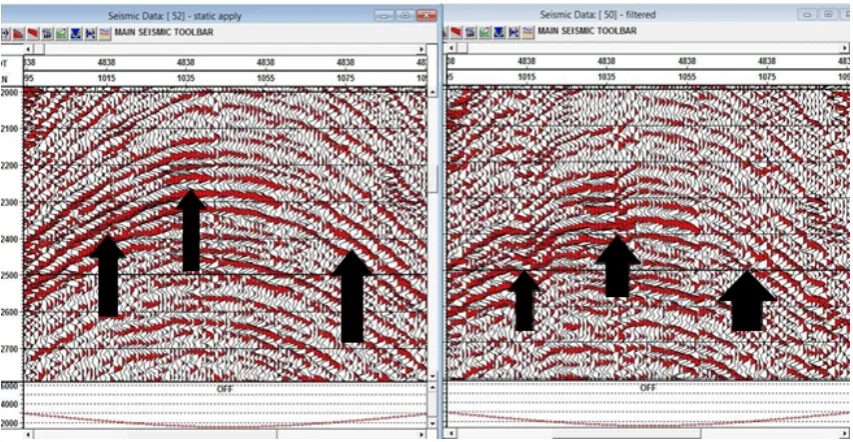
Figures 6A and 6B shows a sample shot record (shot number 4838 and 4712 respectively). The results of statics calculation, illustrates the effects of the procedure on the shot record and the resulting statics solution was of high quality. Application of static corrections removes irregularities from the seismic reflection records and makes them nearly hyperbolic. The parts of the output
[image:6.595.85.512.170.391.2]data with visible influence of statics (black arrows), show the areas with greater improvements of the reflectors on the shot gather after the application of the statics solutions. The reflection events are stronger and more continuous. As a result of the application of the static corrections, the seismic traces have been moved to earlier times on the vertical axis Figures 6A and 6B.
[image:6.595.86.513.412.620.2]Figure 6A. Juxtaposed view of corrected shot (left) and uncorrected shot (right) for Shot gather 4838
Universal Journal of Geoscience 6(1): 1-7, 2018 7
5. Conclusions
The importance of the application of static correction has been demonstrated. Its importance is evident by the final appearance of the reflection events on shot gathers on which the statics solution were applied. Pseudo reflection times were successfully removed; reflection events were better enhanced and aligned which provided a better energy focus. The present study has equally shown that the delay-time refraction static solution approach is efficient and provides an accurate statics solution.
Acknowledgements
We thank the Shell Petroleum Development Company (SPDC) Nigeria for providing the datasets used in the study and for the permission to publish this research paper. We would also like to thank GEDCO Company of Canada for granting the license to use the VISTA software for the entire data processing carried out in the course of the study.
REFERENCES
[1] Palmer, D., 1986, Refraction Seismics; Handbook of
geophysical exploration, Vol.13: Geophysical Press.
[2] Hampsell, D. and Russell, B., 1984, First break
interpretation using Generalized Linear Inversion. Journal of the Canadian Society of Exploration Geophysicist. Vol. 20, No. 1 40-54
[3] Doust, H. and Omatsola, E. 1990. Niger Delta, in, Edwards,
J.D. and Santogrossi, P.A., eds., Divergent/passive Margin Basins, AAPG Memoir 48:pp. 239-248.
[4] Odeyemi I. B., Anifowose A. Y. B. and Asiwaju-Bello Y.A.
1999. Remote sensing fracture characteristics of Pan African granite batholiths in the Basement Complex of parts of south western Nigeria. The Journal of Technoscience. 3: 56-60.
[5] Cox, M., 1999. Static Corrections for Seismic Reflection
Surveys: Society of Exploration Geophysicists Publ., Tulsa, Oklahoma. 1–5
[6] Barry, K.M., 1967. Delay time and its application to
refraction profile Interpretation, in Seismic Refraction Prospecting: A. W. Musgrave, Ed., SEG.
[7] Bridle, R., and Aramco, S., 2009. Delay-Time Refraction
Methods Applied to a 3D Seismic Block. The Leading Edge,28(2): 228–237
[8] Hao, J.,Yang, R.J.,and Wu, J.,2011.Processing of Static
Correction Problems of Seismic Data in the Complex Surface.
[9] Hatherly, P.J., Urosevic,M., and Lambourne, A., 1994. A
Simple Approach to Calculating Refraction Statics Corrections. Geophysics, 59 (1):156–160
[10]Khan, K. A., 1994, An intelligent and efficient approach to
picking first breaks: 56th Mtg., Eur. Assn. Expl. Geophys,
Paper P155.
[11]Lawton, D.C., 1989, Computation of refraction static
corrections using first-break Travel-time differences: Geophysics, 54, 1289 -1296.
[12]Luo, Y.W., Yang, J., and Duan,W.X., 2010. Comparing
between several static corrections methods. Petroleum Instruments,24(5): 41–43
[13]Marsden, D., 1993, Static corrections—A review, Part II,
and The Leading Edge, 12, 115-120.
[14]Steeples, D.W., Miller, R.D., and Black, R.A.,1990, Static
corrections from shallow reflection surveys: Geophysics, 55,769– 775
[15]Zhu, X.S., Gao, R. and Li, Q.S., 2014. Static corrections