POWER QUALITY EVENTS ANALYSIS USING WAVELET TRANSFORM
SHIRLEY ANAK RUFUS
A project report submitted in partial fulfillment of the requirement for the award of the
Degree of Master of Electrical Engineering
Faculty of Electrical and Electronic Engineering Universiti Tun Hussein Onn Malaysia
ABSTRACT
vi
ABSTRAK
Dengan meningkatnya penggunaan peralatan elektronik yang sensitif, kajian tentang kualiti kuasa telah berkembang untuk menganalisa data kualiti kuasa. Teknik Wavelet Transformasi (WT) merupakan teknik yang sesuai untuk menganalisa pelbagai gangguan kualiti kuasa. Projek ini membandingkan penggunaan dan keupayaan berbagai jenis wavelet pada skala dan tingkat yang berbeza untuk menganalisa gangguan kualiti kuasa yang telah direkod pada 22kV sistem pengagihan di Skudai. Data gangguan kualiti kuasa seperti voltage sag, voltage swell
dan transientdiperolehi dengan penggunaan RPM Power Analysis Software yang
berdasarkan standard CBEMA curve dimana gangguan kualiti kuasa dapat dikenalpasti dan dianalisa. Projek ini juga menggunapakai 1-D WPT dan 1-D SWTD yang terdapat dalam Matlab wavelet toolbox untuk menganalisa dengan lebih lanjut gangguan kualiti kuasa. Dalam 1-D WPT, empat (4) jenis wavelet dengan aplikasi
Shannon entropy diterapkan ke dalam gangguan kualiti kuasa dan ini bertujuan untuk
menentukan mother wavelet yang paling sesuai supaya gelombang gangguan kualiti kuasa bagi voltage sag dan voltage swell dapat dianalisa dan mendapat compression yang lebih baik iaitu dengan mengambilkira kehilangan tenaga yang rendah supaya data dan bentuk gelombang yang asli dikekalkan dan boleh dianalisa dengan lebih lanjut. Kebolehan 1-D WPT untuk compression adalah berdasarkan peratusan energy
retained dan number of zero untuk semua wavelet pada skala dan tingkat yang
berbeza. Compression menggunakan WT juga dilakukan untuk perbandingan. Noise yang terdapat dalam ganguan kualiti kuasa dikaji dengan menggunakan mother
wavelet dari tingkat yang berbeza dan disertai dengan aplikasi noise structures.
Penggunaan 1-D SWTD untuk menganalisa Voltage sag, voltage swell dan transient dengan 3 noise structures yang berbeza dibuktikan dengan membandingkan nilai
dispersion dan distribution yang boleh didapati selepas proses de-noising.
CONTENTS
TITLE i
DECLARATION ii
DEDICATION iii
ACKNOWLEDGEMENT iv
ABSTRACT v
CONTENTS vii
LISTOFTABLE xi
LISTOFFIGURES xiii
LIST OF SYMBOLS ANDABBREVIATIONS xvi
LIST OF APPENDICES xvii
CHAPTER 1 INTRODUCTION
1.1 Projectbackground 1
1.2 Objectives 3
1.3 Background of study 3
1.4 ProblemStatements 4
1.5 Scope of study 5
1.6 Project report structure 6
CHAPTER 2 LITERATURE REVIEW
2.1 Introduction 7
2.2 Power quality 7
2.2.1 Voltage sag 9
2.2.2 Voltage swell 10
2.3 CBEMA curve 11
viii
2.4 Review of Wavelet Transform 15
2.4.1 Wavelet Transform (WT) 17
2.4.2 Discrete Wavelet Transform (DWT) 18
2.4.3 Wavelet Packet Transform (WPT) 21
2.4.3.1 Percent of energy retained and percent
number of zero 22
2.4.3.2 Ratio of energy loss per percentage
number of zero 23
2.4.3.3 Shannon entropy 24
2.4.4 Type of mother wavelet 25
2.4.4.1 Haar wavelet 25
2.4.4.2 Daubechies wavelet 26
2.4.4.3 Symlet wavelet 27
2.4.4.4 Dmey wavelet 28
2.4.4.5 Coiflet wavelet 28
2.5 Conclusion 29
CHAPTER 3 METHODOLOGY
3.1 Introduction 30
3.2 Overview of RPM Power Analysis Software (PAS) 30 3.2.1 Exporting PQ events data to RPM PAS 31
3.2.2 Step of using RPM PAS 37
3.2.3 Stepstoconverted PQ events waveformtoExcel
(*.xls) format 37
3.3 Overview of Matlab Software 40
3.3.1 One- dimensional Wavelet Packet Transform (1-D
WPT) 41
3.3.2 One- dimensional Wavelet Transform De-noising
(1-D SWTD) 42
3.4 Conclusion 42
CHAPTER 4 RESULT AND DATA ANALYSIS
4.1 Introduction 43
4.3 Analysis of PQ events using One- dimensional Wavelet
Packet Transform (1-D WPT) 48
4.3.1 Analysis based on percent of energy retained 51 4.3.2 Analysis based on percent number of zero 55 4.3.3 Analysis based on Minimum ratio of energy loss
per percentage zero 56
4.4 Analysis of PQ events using One- dimensional Wavelet
Transform De-noising (1-D SWTD) 64
4.4.1 Analysis of PQ events using scaled white noise
using 1-D SWTD and WT 64
4.4.2 Analysis of PQ events using non white noise
using 1-D SWTD and WT 71
4.4.3 Analysis of PQ events using un-scaled white
noise using 1-D SWTD and WT 73
CHAPTER 5 DISCUSSION AND CONCLUSION
5.1 Discussion 74
5.2 Conclusion 78
5.3 Future works 79
REFERENCES 81
CHAPTER1
INTRODUCTION
1.1 Project Background
Power system is a complex interconnected network that can be divided into three (3) major components namely as generation, transmission and distribution. In order to transfer the electric energy produced by the generating units to customers, an inter-connected transmission system is required. Transmission system consists of transmission line which used to interconnect neighbouring utilities either by transferring power within regions during normal conditions or between regions during emergencies. Distribution system is a part whereby, the substations feed the power to the customers’ service entrance equipment that may be connected through overhead or underground cable. Industrial, commercial and residential is a category of power system load which consists of large number of lighting, heating and cooling equipments.
example, electric power provider in Malaysia such as TNB, SEB and SESB is designed to provide a sine wave with 50-cycle per second of alternating current at a designated voltage , for example, 240 volts for residential customers or 132 volts for many commercial or industrial customers. It is very important to supply a clean sinusoidal waveform without any deviation to the customers. However, power quality is difficult to quantify. The ultimate measure of power quality is measured by the ability to maintain voltage and current signal in power systems at constant amplitude, a nearly sinusoidal shape, and constant fundamental frequency at all times. Power quality comes with different meaning and the following is the widely accepted definition of power quality [1].
In reality, there are various kinds of power quality events exist in electrical distribution systems. Power quality events have mentioned a lot in most research paper that relates with power quality issues [2]. Some power quality events come from the supply network, whereas others are produced by the load itself. Power quality events also concerning voltage magnitude deviations can be in the form of voltage fluctuations, especially those causing flicker. Other voltage problems are the voltage sags, short interruptions and transient over-voltages. Since there are many types of power quality events that all the users may face, it is necessary to perform analysis in order to determine the types of power quality events and also the effect of power quality events.
3 1.2 Objectives
This project is aimed at investigating the electrical power quality at 22kV distribution system Skudai, Johor. There are a few objectives for this project that includes:
i. To study several power quality events in electrical system and study general causes and effect of power quality events according IEEE 1159 ii. To convert and analyze the recorded data taken by Reliable Power Meter
(RPM) at 22kV Distribution System in Skudai, Johor using RPM Power Analysis Software.
iii. To analyze and determine the best mother wavelet by using 1-D Wavelet Packet Transform (WPT) analysis and Shannon entropy for real power quality data.
iv. To determine and differentiate waveforms before and after simulate using 1-D Stationary Wavelet Transform De-noising (SWTD) analysis and various noise structures using the real power quality data.
1.3 Backgroundofstudy
Modern industrial processes are based a large amount of electronic devices such as programmable logic controllers and adjustable speed drives. The electronic devices are very sensitive to disturbances and thus industrial loads become less tolerant to power quality events such as voltage dips, voltage swells, and harmonics and transients. In order to improve power quality problem, an effective monitoring system must be developed to detect and classify all kinds of power quality disturbance. Therefore, a basic knowledge of the different power system disturbances is important in order to determine the events and causes of equipment failure, classification of the event occurred as well as to apply mitigation measures more effectively.
There are several methods in extracting features and data compressing for power quality events waveforms [3, 4]. Fourier Transform (FT), Discreet Fourier Transform (DFT), Fast Fourier Transform (FFT), Wavelet Transform (WT), Discreet Wavelet Transform (DWT), Discreet Wavelet Transform with Multiresolution Analysis (DWT with MRA), S-Transform, Welch Transform Analysis of Variance (ANOVA) and etc are some methods that are frequently used to identify power quality events waveforms.
1.4 Problem St at eme nt s
Power quality is among the main things that is emphasized and is taken into consideration by utilities in order to meet the demands of their customer. In the past several years, the demand on power quality has been increasing due to the grow application of microelectronic processors in various types of equipments and increased usage of sensitive loads [5, 6].
5 This project was done to observe, analyze and identify the data of PQ events such as transient, voltage sags and voltage swell that collected from 22kV distribution system Skudai, Johor using power quality analyzer device. Recorded PQ events data can be observed by using RPM Power Analysis Software then the power quality events data are applied in Matlab R2008a version software.1-D WPTis a analysis toolthat available in Matlab and used to observe the percent of energy retained and percent of number of zero for the PQ events. 1-D SWTD also an analysis tool and it is used to detect any changes in the PQ event waveform by de-noised the waveform. Both tools are able to analyze the loaded PQ event waveform and have their own unique properties. Analysis of PQ events is done by comparing the performance of different mother wavelet at different levels thus suggesting the better wavelet to compress and de-noising the of power quality events by identify the patterns and record the simulation data.
1.5 Scope of Study
The scopes and limitation for this project are:
1. For this study, three (3) major power quality events such as transient, voltage sags and voltage swell that usually occurred and identified.
2. Data is taken from 22 kV Distribution Systems in Skudai, Johor and the data of PQ events is observed and analyzed using RPM Power Analysis Software. 3. Data processing is using wavelet transformation technique and simulation is
1.6 Project report structures
This thesis consists of 5 chapters followed by the references and appendices.Based on problem statement, objectives and scopes, the project was done step by step from the literature review and methodology until the final results and conclusion.
Chapter 1 introduces an overview of PQ, project background, the objectives of this project, the problem statement and scope that involved in this project.
Chapter 2 describes a signal processing technique using wavelet in PQ. A clear understanding, method and application of this software used by researcher are highlighted in this chapter. This chapter also brings the recent advances of techniques in PQ events waveform compression and de-noised. The theoretical aspects are explained and applications are stated in this chapter. The importance of wavelet approach as a signal processing and the available wavelet families have also been explored. Theoretical background on WT, DWT and WPT are also included. The advantageous of WPT and SWTD in accordance to the PQ field are also clarified.
Chapter 3 introduces the procedures applied in this project. Techniques in extracting PQ events data using CBEMA curve was explained. Application of Matlabtools in PQ events analysis was described.Steps in gathering the data obtainedalso shown in this chapter.
Chapter 4 presents the finding from CBEMA, 1-D WPT and 1-D SWTDtogether with the analysis.
Finally, Chapter 5 gives overall conclusion of the project. Several future works also recommended based on the contribution of this study for further interesting research topics.
CHAPTER 2
LITERATURE REVIEW
2.1 Introduction
This chapter will highlight what is PQ is, the problem that related to PQ events and existing method to analyzed the PQ events. This chapter also will elaborate about the software that used in this project such as CBEMA curve and MATLAB. Theory of wavelet includes type of mother wavelet, comparison between wavelet transform and wavelet packet transform are explain in this chapter as all this information are important to complete this thesis.
2.2 Power quality
is the ability of an equipment or system to function satisfactorily in its electromagnetic environment without introducing intolerable electromagnetic disturbances to anything in that environment’ [9]. Since power quality is very much of a customer-driven issue and the customer’s point of reference take precedence, one can define power quality as ‘Any power problem manifested in voltage, current, or frequency deviations that result in failure or disoperation of customer equipment’ [1, 2].
Power system may consists of transient, short duration variations, long duration variations, voltage unbalance, waveform distortion, voltage fluctuation and power frequency variations as defined in [8]. [8]serves as an important reference for the research and development activities in the field of power quality. Power system events can be classified into categories according to their characteristics. At Table 2.1 shows the different characteristic of power quality phenomena which can be divided into two (2) main classes, namely; the steady state phenomena and the non-steady state phenomena [1, 8]:
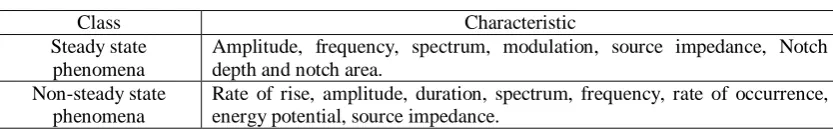
Table 2.1: Class of power quality phenomena [1]
Class Characteristic
Steady state phenomena
Amplitude, frequency, spectrum, modulation, source impedance, Notch depth and notch area.
Non-steady state phenomena
Rate of rise, amplitude, duration, spectrum, frequency, rate of occurrence, energy potential, source impedance.
Power quality events, on the other hand is defined as any deviation in term of magnitude or frequency in current or voltage that cause any problem relating to the malfunctioning of the system and equipment to the consumers. Voltage magnitude deviations is refer to the form of the voltage fluctuations, that can caused voltage sag, voltage swell, flicker, short interruption in voltage and transient over voltage in the system. Any frequency deviation from the supply, it can cause harmonics.
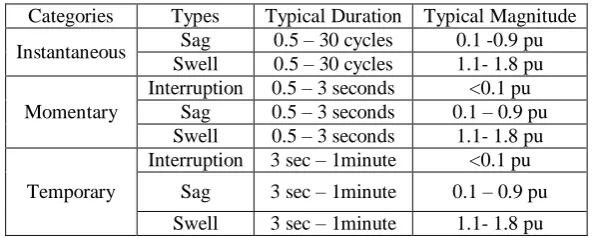
9 Table 2.2 Summary of voltage sag and voltage swell in
[8]
Categories Types Typical Duration Typical Magnitude Instantaneous Sag 0.5 – 30 cycles 0.1 -0.9 pu
Swell 0.5 – 30 cycles 1.1- 1.8 pu Momentary
Interruption 0.5 – 3 seconds <0.1 pu Sag 0.5 – 3 seconds 0.1 – 0.9 pu Swell 0.5 – 3 seconds 1.1- 1.8 pu
Temporary
Interruption 3 sec – 1minute <0.1 pu Sag 3 sec – 1minute 0.1 – 0.9 pu Swell 3 sec – 1minute 1.1- 1.8 pu
The characterization for PQ phenomena is applicable for the utilities, manufacturers and consumers side to guide them for proper mitigation purposes. This project focussed on two (2) power quality events that become major concern to the customers that are voltage sag and voltage swell.
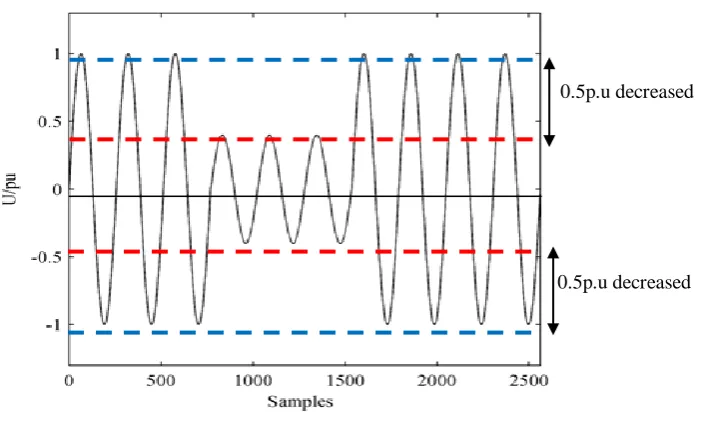
2.2.1 Voltage sag
Voltage sag or dip is a short duration decrease between 10% - 90% of the RMS voltage, lasting from 0.5 cycles to 1 minute in duration. A 10% sag is considered an event during which the RMS voltage decreased by 0.1 pu to 0.9 pu. If the voltage decreases longer than 1 minute, the undervoltage is used.
sag has occurred at the 4th cycle until the 6th cycle by decreased 0.5p.u from nominal value 1.0p.u.
Figure 2.1: Voltage sag
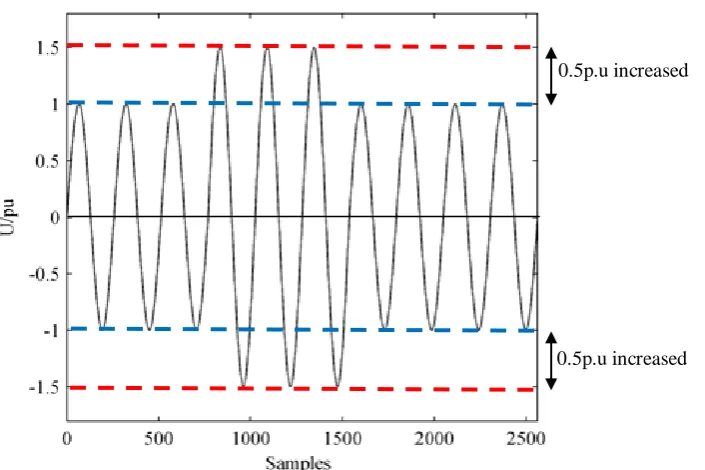
2.2.2 Voltage swell
Voltage swell is defined as the increment of the RMS voltage between 1.1p.u to 1.8p.u. The frequency of the voltage swell occurrences is low compared to the voltage sag and the duration of voltage swell is the same as voltage sag, which is between 0.5 cycles to 1 minute.
The factor that caused voltage swell is the starting of large motor, SLG fault at unfaulted phase, light system loading and incorrect taps setting of the transformer. The swell is also divided into three (3) main classes namely, instantaneous swell, momentary swell and temporary swell. The overvoltage term is used if the duration of increasing voltage exceed more than 1 minute. Voltage swell are caused by system faults and it can also be caused by switching off large load or energized of large capacitor bank. [8]. Figure 2.2 show the voltage swell occurred in 3 cycles that starting from the 4th cycle until the 6th cycle by increased 0.5p.u from nominal value 1.0p.u.
11
Figure 2.2: Voltage Swell
2.3 CBEMA Curve
Voltage tolerance (voltage sensitivity or voltage vulnerability) curves, or also known as power acceptability curves [11], is a graphic metric of the voltage deviation plotted versus time duration for acceptable operation. One of the most widely used voltage tolerance curve is Computer Business Equipment Manufacturers Association (CBEMA) curve which has been existence since the 1970s’ [12]. Its primary intent is to provide a measure of vulnerability of mainframe computers to disturbances in the electric supply. However its use has been extended to give a measure of power quality for electric drives and solid state loads as well as a host of wide-ranging residential, commercial, and industrial loads [11]. Analysis through CBEMAcurve has an evident that power acceptability curves have frailty in design andapplication.
of the event. Apart from the knowledge of type of disturbance using CBEMA, the interpretation of power quality events also needs a good understanding based on the position, length, duration and shape of disturbances from CBEMA information.
2.3.1 Type of Disturbance in CBEMA curve
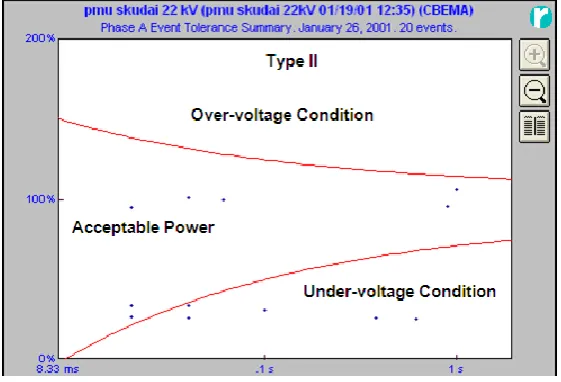
[image:18.595.171.470.380.584.2]The dotted signals on the CBEMA graph in Figure 2.3 shows the disturbances that encountered during monitoring period of Phase A at 22kV distribution system Skudai, Johor. CBEMA curve is divided into three (3) main portions to define the type of disturbance based on duration of occurrences. Typical duration of the disturbance could be defined into three (3) classes that are Type I, Type II and Type III.
Figure 2.3: Events recorded by RPM
13 hundred MHz as compared to the 50 Hz or 60 Hz experienced in the normal electrical frequency.
Type II loosely represents surges, swells, sags, or dips. The time period is from one half-cycle to a few hours. This type of disturbance is known as magnitude deviation disturbance. The frequency of the system voltage is unchanged as it does operate at normal electrical frequency (50 or 60Hz). However, the magnitude of the voltage is deviated from the voltage magnitude rating.
[image:19.595.171.470.318.526.2]Type III, represents the harmonic distortion, flicker, long interruption, under-voltage and overunder-voltage. The curve in this section has been transformed slowly into straight line. The upper line of the curve could attain at 110% of the normal voltage and the lower line approximately 90% of the normal voltage.
Figure 2.4: Division of Type I, II, and III of the disturbances
A dotted signal in the area outside the envelope depicts an event associated with power quality deviation. For dotted signals enveloped by the curve show that the load is still able to withstand those disturbances. The dotted signals that are located beyond the curve give indication that the disturbance can cause severe drawback impact to the load. During the monitoring period, voltage deviations that points outside of the CBEMA were recorded at some locations was indicated the disturbances was occurred during under-voltage condition.
disturbance is divided in accordance to the time duration.From Figure 2.5, it is clearly shows that there were 12 events recorded fall into Type II while in Figure 2.6, 5 events were recorded by RPM categorised as Type III events. It is known that Type I events is falls between 1µs to8.333ms, Type II events occurred starting from 8.333ms to 2s while Type III events occurred between 2s to 1 day. Start and end duration of each type of recorded events can be observed from tolerance summary table and also the number, amplitude and duration of the event.
Figure 2.5: Types II category events
Figure 2.6: Type III category events
15 be evaluate that the longest Type II event is number 180 event with amplitude 13.40kV at.1s and the largest Type II event is number 320 event with amplitude 3.240kV at 620ms respectively. While, the longest Type III event is number 220 event with amplitude 13.47kV at.16.521 hours and largest Type III event is the number 40 event with amplitude 13.64kV and 5.89hours. All these events are considered as voltage sag events since the normal voltage of the distribution system is 22kV.
2.4 Reviews of Wavelet Transform (WT)
PQ events have been defined into several categories and wide number of novel approach techniques for detection of PQ events by time and frequency analysis with WT and WPT are proposed in most research papers [13]. The author in [14] used WT in detecting PQ events such as sag, swell, interruption, DC offset, frequency variation and harmonics. WT is used to identify the power quality events at its instance of occurrence, fast, sensitive and practical for detection and identification PQ events and it is suitable for stationary signal analysis where frequency component doesn’t vary with time.
37]. After the original PQ signal is transformed into the wavelet coefficients, many coefficients are so small so that these coefficients can be omitted without losing significant information after the signal is reconstructed. Choice of the appropriate mother wavelet is very important for all the wavelet based PQ analyses [19, 20, 23].
There are various techniques to obtain suitable mother wavelet function. It is well known that the choice of the appropriate mother wavelet function is very important for all the wavelet based PQ analyses [20]. The most widely used mother wavelet function in detecting and analyzing voltage sag and voltage swell is Daubechies (Db) family. However, some papers are used to show the performance of the other different mother wavelet function. [21, 22, 23] proposed the use of detail coefficients of the level of the wavelet decomposition, using Daubechies with 6 coefficients (Db6) as the mother wavelet to detect the beginning and the end of a voltage sag. The entropy of wavelet coefficients at different resolution levels is used for feature extraction that proved in[24] where the authors proposed an automated feature extraction method using an entropy-based best basis algorithm in order to select the most suitable WT and most significant coefficients in each decomposition level of Multi-resolution Analysis(MRA) to compose the feature vector. In [25] the author proposed the Shannon entropy based method to extract the features from transient signals. Feature extraction from the wavelet coefficient is considered in detection and analyzing the voltage sag and swell events since the wavelet coefficients represents the information in different resolution levels. The information includes the peak magnitude, square magnitude, mean value and standard deviation, energy distribution pattern and entropy [26, 27] proposed the wavelet coefficients obtained are used for detection and estimation of magnitude and duration of voltage sag. [28] also proposed the wavelet coefficients for short duration events detection, quantification and classification.
17 wavelet analysis as a function of the sampling frequency to reduce the computational cost and to locate the energy of the reference in the centre of the scales.
The WPT and an entropy based criterion are proposed in [30] to select the most suitable decomposition of a signal where the mean, standard deviation of coefficients, energy, entropy and other statistical parameters are used to form the feature vector. Comparison based on the calculation of the energy of the reconstructed signals from the wavelet coefficients using the wavelet packet transform is proposed in [15, 16] where various types of mother wavelets is applied on the analysis of real PQ signals which obtained experimentally. Few papers [19, 31, 32] proposed using WT denoising for data compression of power quality waveform. [14] proposed the noise corrupted PQ signals is denoised using five (5) different mother wavelets and the effectiveness of the wavelets in denoising methods is shown by the presence of noise increases the energy distribution at lower levels.
2.4.1 Wavelet Transform
Wavelets provide efficient and fast algorithms to represent a signal split in its distinct frequency bands using multi resolution analysis. Wavelets can be defined as a class of functions used to localize a given signal in both time and frequency domains. This set of wavelets would be constructed from a mother wavelet, which dilated or expanded to change the size of the window. This implies that a dilated wavelet gives more of the time information and an expanded version of it looks into the frequency information. Thus wavelets adapt to both high frequency and low frequency components automatically by using various window sizes. Wavelets are generated from a mother wavelet (wavelet family) , using dilations (stretched) and translation (shifted in time) as shown in equation (2.1),
(2.1)
where must satisfy , =dillation and b= translation
DWT is used to decompose a discrete signal into different resolution levels and it maps a sequence of numbers into a different sequence of numbers DWT is a special case of the WT that provides basic tool for feature extraction of discreet-time signals and give a compact representation of that signal in time and frequency. DWT employs two (2) fundamental equations: scaling function, and wavelet function,
which shows in the equation (2.2) and (2.3),
(2.2)
(2.3)
where is normalized . and represent discrete filters. The scaling and wavelet function are the prototype of a class of orthonormal basis functions in form of equation (2.4) and (2.5),
; (2.4)
; (2.5)
where parameter controls the dilation or compression function in time scale and amplitude while parameter controls the translation of the function in time. is the set of integers. Both and are the element of ,( ). Once a wavelet system is created, it can be used to expand a function, in term of both scaling and wavelet functions as in equation (2.6):
(2.6)
where the DWT expansion coefficients represent the Approximation of the original signal with a resolution of one point per every 2J points of the original signal while represent Details of the original signal at different levels of resolution. Both are calculated by inner product as in equation (2.7) and (2.8),
(2.7)
19
[image:25.595.127.512.266.425.2]The MRA is a tool that utilizes the DWT to represent the time domain signal can be mapped into the wavelet domain and represented at different resolution levels. DWT and MRA employ two filters in each level which are low-pass and high-pass filter, followed by an arrow stands for down sampling process of two. The DWT employs two sets of functions called scaling functions and wavelet functions which are associated with low-pass and high-pass filters, respectively. Figure 2.8 shows the tree structure of a one-dimensional (1-D) Multi-resolution DWT for a discrete signal.
Figure 2.8: Tree structure of a one-dimensional Multi-resolution Discrete Wavelet Transform (1-D DWT)
In MRA analysis, the low frequency content (LP Filter output) is called Approximation (A) coefficient, and high frequency content (HP Filter output) is called Detail (D) coefficient, . The resulting coefficients from the low-pass filtering process that is approximation can be processed again as entrance data for a subsequent bank of filters, generating another group of Approximation and Detail coefficients. In a practical approach, a DWT depends on the original signal , low-pass filter, and high-pass filter, used. The implementation of MRA and DWT can be shows in the Figure 2.9.
D1 Signal
A1
A2
D2
A3
D3
A4
D4
A5
Figure 2.9: Implementation of decomposition original signal into 2 levels of MRA based on DWT
WT is a mathematical tool that very useful in detecting and extracting disturbance features of various types of electric PQ events because it is sensitive to signal irregularities but insensitive to the regular-like signal behaviour. Wavelet analysis transforms the disturbance signals into different time-frequency scales detecting the disturbances present in the power signal and this analysis of the disturbance signal at different frequencies with different resolution is called MRA.
21 2.4.3 Wavelet Packet Transform (WPT)
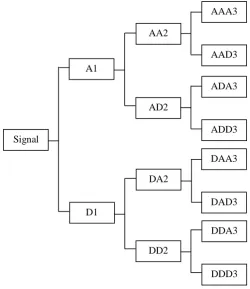
[image:27.595.147.398.306.596.2]WPT is a generalization of wavelet decomposition that offers a wider range of possibilities for signal analysis. WPT is an expansion of classical wavelet decomposition that presents more complex and flexible analysis because in WPT analysis the Details (D) as well as the Approximations (A) are separated like complete binary tree. For each level of decomposition, the signal is filtered into approximation information of the signal which contain lower frequency component and detail information which contain lower frequency component. Figure 2.10 shows the wavelet packet decomposition tree obtained up to 3 level of decomposition
Figure 2.10: Tree structure of the wavelet packet decomposition at level 4
The top level of WPT is the time representation whereas the bottom level is the better frequency resolution. Hence with use of WPT a better frequency resolution can be obtained for the decomposed signal. At first level, both algorithms are using low –pass filter, g(n) and a high-pass filter, h(n), to generate two sets of coefficients (approximation coefficients and detail coefficients). Here, the convolution process is applied between disturbance signal with a low-pass filter, g(n) and a high-pass filter,
Signal
DDA3
DDD3 DAA3
DAD3 ADA3
ADD3
DA2
DD2 D1
A1
AAA3
AAD3 AA2
h(n), respectively, which followed by down sampling by 2. With MRA based on WPT the reconstructed output signals will have equal frequency bands, because both outputs from the high pass and low pass filters are further decomposed. Both processes can be repeated multiple times to obtain more detailed signals at higher levels.Implementation of decomposition a signal into 2-levels of MRA based on WPT is shown in Figure 2.11,
Figure 2.11: Decomposition of original signal into 2nd levels of MRA based on WPT
In view of the fact that WPT generates large number of nodes it increases the computational burden. In DWT only approximations are further decomposed thus reducing the level of decomposition and thereby computational attempts.Because of the criterions, WPT is chosen since it may be efficiently searched for best basis as the PQ events waveform is analyzed [19, 32]. There various data such as energy of entropy, thresholding coefficients value, size of the data, statistic data of the compressed signal, percent of energy retained, percent number of zero and etc could be obtained through analysis using 1-D WPT tool.
2.4.3.1 Percent of energy retained and percent of number of zero
23 decomposition level is increased. For a very small details sub-signal (coefficients), the detail coefficients can be set to zero without significantly changing the original waveform or signal. The greater the number of zeros the greater the compression can be achieved. In change the number of zero and retained energy, threshold is required. Threshold is a value that below the detail coefficient to be set to zero. Thresholding can be done globally or locally [39]. Global thresholding involves thresholding every sub-signal with the same threshold value. Local thresholding involves uses a different threshold value for each sub-band. In this project, global thresholding is applied to each event where the value of threshold has been chosen automatically to balance the number of zero with the amount of energy retained in the compressed PQ event waveform.
Percent of energy retained means the amount of information retained by a waveform or signal after compression. It is enable increased the compression rate without compromising the information required to characterize the PQ events. If the energy retained is 100% then the compression is known as lossless as the waveform can be reconstructed exactly as original waveform. This occurs when the threshold value is set to zero, meaning that the detail has not been changed. If the threshold value is changed then energy will be lost. The higher percent of energy retained is indicates the best energy retained and the best signal can be reconstructed.Percent number of zero is indicates the compression quality of a signal. The higher percent number of zero mean represents the best compression where all the smallest value of zero value in the signal is being compressed. Ideally, percent of energy retained and number of zero are maintained higher as possible in order to ensure the signal can be reconstructed exactly as original signal. However, it is possible for analyzing PQ events [36- 38].
2.4.3.2 Ratio of Energy Loss per percentage Zero
(2.9)
The smaller value of the ratio means the compression is less loss and therefore the signal is compressed better.
2.4.3.3 Shannon entropy
To evaluate the importance of the wavelet packet components to a signal, the concept of entropy is often applied in signal processing. Entropy is a common concept in many fields and there are various definitions of entropy in the literatures. In thermodynamics, entropy is a measure of quantifying the imbalance degree of thermo-state. In mathematics, entropy is used to measure the uncertainty of problems. While in information science, entropy is the average uncertainty of information source. In other word, entropy is a measure of irregularities of states such as imbalance, uncertainty and non-stationary.
As PQ disturbance signals have the imbalance, the non-stationary, the different frequency component and the different energy distribution, the Shannon entropy is proposed to compress and extract features from different PQ disturbance signals as a measurement of these irregularities. The value for detail and approximation coefficients in each decomposition level can be extracted from WT and MRA of difference disturbances. The extracted features help to distinguish a disturbance of power quality events from another. It is demonstrated that the WP energy has more potential for use in signal classification as compared to the WP coefficients alone. The wavelet packet energy represents energy stored in a particular frequency band and is mainly used in this study to extract the dominant frequency components of the signal. The Shannon energy entropy is defined respectively in equation (2.10).
REFERENCES
1. Dugan R.C., McGranaghan M.F., Beaty H.W., IEEE Standard 1159, , Electric Power Quality, McGraw Hill, New York, 1996.
2. SudiptaNath, ArindamDey and AbhijitChakrabarti, (2009). “Detection of Power Quality Disturbances using Wavelet Transform”, World Academy of Science, Engineering and Technology 49.
3. Gustavo Peres B. De Castro, Sigmar M. Deckmann and André A. Ferreira .Compression Criteria for Voltage Sags Analysis using Wavelets, , Department of Energy Control and Systems, State University of Campinas Electrical and Computer Engineering School Brazil, [email protected] , http//www.dsce.fee.unicamp.br
4. H. M. S. C.Herath, Victor J. Gosbelland SarathPerera,„Power Quality (PQ) Survey Reporting: Discrete Disturbance Limits, IEEE transaction on power delivery, Vol. 20, No. 2, April 2005
5. Sharmeela, C., Mohan, M. R., Uma, G. &Baskaran, J.(2006). A Novel Detection and Classification Algorithm for Power Quality Disturbances Using Wavelets. American Journal of Applied Sciences, Vol. 3 (No. 10), pp. 2049205.
6. D. Saxena, K.S. Verma and S.N. Singh. “Power quality event classification: an overview and key issues”, International Journal of Engineering, Science and Technology, Vol. 2, No. 3, pp. 186-199, 2010
7. Voltage sag solution for industrial customers, Power Quality Guidebook, TNB, 2007
8. IEEE Recommended Practice for monitoring Electric Power Quality, IEEE Inc., New York, USA, 1995
disturbances and signaling in public power supply system
10. Haibo He, Xiaoping Shen, Janusz A. Strazyk (2009). Power quality
disturbances analysis based on EDMRA method. Electr. Power Energy Syst.
31. pp. 258-268.
11. J. Kyei, R. Ayyanyar, G. T. Heydt, R. S. Thallam, and J. Tang (2002). The
design of power acceptability curves.IEEE Trans. Power Delivery, vol. 17,
pp. 828–833.
12. T. Key (1979). Diagnosing power quality related computer problems,” IEEE
Trans. Industrial Applications. Vol.15, pp. 389–393.
13. G. S. Hu, F. F. Zhu, and Ren, Power Quality Disturbance Identification Using Wavelet Packet Energy Entropy and Weighted Support Vector
Machines, Expert System with Applications
14. D. Saxena, S.N. Singh and K.S. Verma (2011). Wavelet based denoising of power quality events for characterization. International Journal of engineering, Science and Technology Vol. 3 (No. 3) , pp.119-132.
15. A.M. Gargoom, N. Ertugrul, and W.L. Soong, Comparative Study of Using Different Mother Wavelets on Power Quality Monitoring, Autralasian Universities Power Engineering Conferencce (AUPEC 2004), 26-29 September 2004, Brisbane Australia
16. T. Lachman, A.P. Memon, T.R. Mohamad, Z. A. Memon, International Journal for The Advancement of Science & Arts, Vol. 1 No. 1, 2010, Detection of Power Quality Wavelet Transform Technique
17. A. Sengur, I. Turkoglu, M.C. Ince, Wavelet packet neural networks for texture classification, Expert System Application 32 (2007) 527–533.
18. Dash PK, Panigrahi BK, Sahoo DK, Panda G. (2003).Power quality disturbance data compression, detection, and classification using integrated
spline wavelet and S-transform. IEEE Trans Power Delivery, vol.18(no.2),
pp.595–600.
19. Hamid E. Y. and Kawasaki Z.-I (2002).Wavelet-based data compression of
power system disturbances using the minimum description length criterion.
IEEE Trans. Power Delivery, vol. 17 (no.2), pp. 460-466.
20. Santoso S, Powers EJ, Grady WM, Hofmann P.(1996). Power quality
assessment via wavelet transform analysis. IEEE Trans Power Delivery,
83 21. A.C. Parsons, W.M. Grady, E.J. Powers, A wavelet-based procedure for automatically determining the beginning and end of transmission system voltage sags, IEEE PES Winter Meet. 2 (1999) 1310-1315.
22. J.Barros, E.Perez, „A combined wavelet-Kalman filtering scheme for automatic detection and analysis of voltage dips in power systems, IEEE PowerTech. (2005).
23. M.F. Faisal, A. Mohamed, Comparison of effectiveness of various mother wavelet functions in the detection of actual 3-phase voltage sags, in: 20th International Conference on Electricity Distribution, 2009.
24. X Xu, M.Kezunovic, Automated feature extraction from power system transient using wavelet transform, Int. Conf. Power System Technol. (2002) 1994-1998.
25. T. Jayasree, D. Devaraj, R. Sukanesh, „Classification of transients using wavelet based entropy and radial basis Neural Networks‟, International Journal of Computer and Electrical Engineering, Vol. 1, No. 5 December, 2009, 1793-8163.
26. M.B.I. Reaz, F. Choong, M.S. Sulaiman, F.M.-Yasin, M.Kamada, Expert system for power quality disturbance classifier, IEEE Trans. Power Deliv. 22 (2007) 1979-1988.
27. O. Gencer, S. Ozturk, T.Erfidan, A new approach to voltage sag detection based on wavelet transform, Electr. Power Energy Syst. 32 (2010) 133-140. 28. C. Xiangxun (2002).Wavelet-based detection, localization, quantification
and classification of short duration power quality disturbances. IEEE PES
Winter Meet, 2, pp.931-936.
29. A.M. Gaouda, M.M. Salama, M.R. Sultan and A.y. Chikhani (Oct. 1999). Power quality detection and classification using wavelet-multi-resolution
signal decomposition. IEEE Transactions on Power Delivery, vol. 14, pp.
1469-1476.
30. B.K. Panagrahi, V.R. Pandi (2009).Optimal feature selection for classification of power quality disturbances using wavelet packet-based
fuzzy k-nearest neighbor algorithm, IET Gener. Trans. Distrib. 3, pp.
296-306.
31. Mallat S. (1989). A theory for multiresolution signal decomposition .The
(no.7), pp. 674-693.
32. Ribeiro V., Seop H. P., Romano J. M. T., and Mitra S. K. (2007).A novel
MDL-based compression method for power quality applications. IEEE
Trans. Power Delivery, vol. 22, (no.1), pp. 27-36.
33. M. Sushama, G. Tulasi Ram (2005-2008). Detection and classification of
voltage swell using adaptive decomposition & wavelet transforms. Journal
of the Theoretical and Applied Information technology.www.jatit.org. 34. Misiti, M. Misiti, Y. Oppenheim, G. Poggi, and J-M, (2000), “Wavelet
Toolbox User.s Guide”, Version 2.1.The Mathworks, Inc. 35. Wavelet Toolbox users Guide, www.mathworks.com
36. Shyh-Jier Huangand Ming-Jong Jou (August 2004). Application of Arithmetic Coding for Electric Power Disturbance Data Compression with Wavelet Packet Enhancement.IEEE Transactions On Power Systems, Vol. 19 (No. 3) pp. 1334-1341.
37. JagannathSethi, SibaramMisha, Prajnaarimita Dash, Sudhansu Kumar Mishra and SukadevMeher, “Image Compression Using Wavelet Packet Tree”, International J. of Recent Trends in Engineering and Technology, Vol. 3, No. 1, May 2011
38. L. Shang, J. Jaeger, R. Krebs, “Efficiency Analysis of Data Compression of Power System Transients using Wavelet Transform”, IEEE Bologna Power Tech Conference, June 23th – 26th, 2003 Bologna, Italy.