Journal of Chemical and Pharmaceutical Research, 2014, 6(1):115-121
Research Article
CODEN(USA) : JCPRC5
ISSN : 0975-7384
Cluster analysis of players category classification in 2013 NBA all-star game
based on SPSS
Dawei Shi
Department of Physical Education, Hebei University of Technology, Tianjin, China
_____________________________________________________________________________________________
ABSTRACT
NBA all-star game is a game that attracts tremendous attentions. The competitiveness that starts show in the game leads the development of world basketball techniques, while the key factor indicates competitiveness is sport technical index features and so more scientific analysis of techniques and tactics level in all-star game is a researchable topic. This paper adopts cluster analysis from SPSS and Fisher discriminate analysis method to make category classification to 24 players in 2013 NBA all-star game, and analysis of techniques and tactics index after quantization so as to explore the key for getting victory in competition and basis of techniques and tactics level playing through data concentration effect. At first, this paper makes research on technical index data that offered by officials in NBA game , and carries out standardization handling with such data, then discusses application range of cluster analysis and rationality that basketball techniques and tactics level reflect in detail, finally utilize cluster analysis method to analyze index level that stars respectively in eastern and western conference show in the game, gets NBA stars classification result according to index level to provide data basis for selecting targeted players’ tracking on NBA key players techniques research.
Key words:Cluster analysis, techniques and tactics index, data standardization, SPSS mathematical statistics _____________________________________________________________________________________________
INTRODUCTION
In the rapid and comprehensive development of modern basketball, outcome of basketball game is up to many factors, but the decisive factor reflects in the balance of power between two parties including techniques, tactics, willpower, players’ physical conditions as well as psychological quality and competition experiences so on. Make classification of players is needed to extract different categories of players and implement technical motions tracking on them, therefore classification according to data features of technical index can get comprehensive and scientific category.
There are many methods for classification according to technical index data for players. For cluster analysis and Fisher discriminant analysis researching, lots of people have made efforts and applied that into category classification fields. Among them, Zhang Dan Utilize SPSS software to do research on basketball qualitative data and extend qualitative analysis method in physical education field application [1]; Xiong Feng-Mei Make cluster analysis of NBA players’ cost performance, firstly divide them into 4 categories then classify them with their compensation level, divide them into the most efficiency, higher efficiency, normal efficiency , low efficiency players and suggest team to mine for value players and exclude deficient players when renewal of a contract with players [2]; Yuan Li-Huang Apply linear probability model to analyze then influence factors for NBA games outcome, get that positive factors that effect on NBA game result including defensive rebound numbers, assist times, steal times and so on. Main negative influence factor is fault times [3].
rational classification to players through cluster analysis and Fisher discriminant analysis method ,and provide data basis and theoretical foundation for targeted players tracking.
NBA OFFICIAL INDEX DATA STANDARDIZATION AND ANALYSIS METHOD THEORETICAL BASIS NBA official index quantification and data standardization
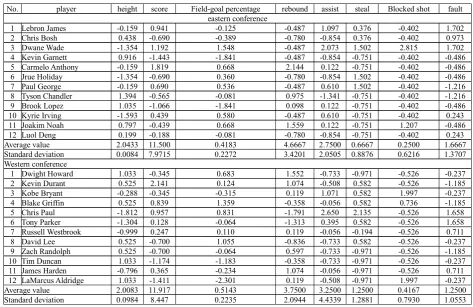
NBA official statistics technical indexes including players’ height, score, field-goal percentage, rebound, assist, steal, blocked shot and fault, players indexes statistics in eastern conference and western conference as Table 1 shows.
Table1: Eastern conference and western conference technical index statistics in 2013
No. player height score Field-goal percentage rebound assist steal Blocked shot fault eastern conference
1 Lebron James 2.03 19 38.89% 3 5 1 0 4
2 Chris Bosh 2.08 6 33.33% 2 1 1 0 3
3 Dwane Wade 1.93 21 76.92% 3 7 2 2 4
4 Kevin Garnett 2.12 0 0.00% 3 1 0 0 1
5 Carmelo Anthony 2.03 26 57.14% 12 3 0 0 1
6 Jrue Holiday 1.93 6 50.00% 2 1 2 0 1
7 Paul George 2.03 17 53.85% 3 4 2 0 0
8 Tyson Chandler 2.16 7 40.00% 8 0 0 0 0
9 Brook Lopez 2.13 3 0.00% 5 3 0 0 1
10 Kyrie Irving 1.91 15 54.55% 3 4 0 0 2
11 Joakim Noah 2.11 8 57.14% 10 3 0 1 1
12 Luol Deng 2.06 10 40.00% 2 1 0 0 2
western conference
1 Dwight Howard 2.11 9 66.67% 7 0 0 0 1
2 Kevin Durant 2.06 30 54.17% 6 1 2 0 0
3 Kobe Bryant 1.98 9 44.44% 4 8 2 2 1
4 Blake Griffin 2.06 19 81.82% 3 3 2 1 0
5 Chris Paul 1.83 20 70.00% 0 15 4 0 3
6 Tony Parker 1.88 13 50.00% 1 5 2 0 3
7 Russell Westbrook 1.91 14 53.85% 4 3 1 0 2
8 David Lee 2.06 6 75.00% 2 0 2 0 1
9 Zach Randolph 2.06 6 50.00% 5 0 0 0 0
10 Tim Duncan 2.11 2 25.00% 3 0 0 0 1
11 James Harden 1.93 15 46.15% 6 3 0 0 2
12 LaMarcus Aldridge 2.11 0 0.00% 4 1 0 2 1
Due to measurement of index selection would direct effect on the result of cluster analysis, normally the smaller the measurement unit chosen, the bigger the variable value would be, the larger influence on cluster result would be. In order to avoid dependency to variable unit selection, data should be done standardization. When data dimension is different, standardization should be implemented, but data dimension is same while order of magnitude has great difference, standardization should also be done. Data standardization method adopted in this paper is standard deviation standardization method, average value of data after standardization is 0, and standard deviation is 1 so as to eliminate dimension influence [4,5]. When samples change, their data after standardization still keep relative stability. Data standardization formula is as formula (1) shows.
m
j
n
i
s
s
s
x
x
x
j j j
j ij
ij
1
,
2
,
,
,
,
2
,
1
,
0
0
0
*
(1) In formula(1),
*
ij
x
represents sample value after standardization,
x
ij represents sample value,x
j representsaverage value of one selected index sample,
s
j represents sample data standard deviation.Cluster analysis method theoretical basis
Cluster analysis is also called group analysis, is a multivariate statistics method to classify samples or indexes, which makes category classification of similar elements, it can divide into two kinds as sample cluster and variable cluster according to difference of classification objects [6].
things, normally is difficult to find typical variables that independent from each other so that affect problems’ further recognition and research. Therefore, it usually starts with variable cluster, and then finds out independent variable which is independent and typical so as to achieve effect without losing most information.
In order to make scientific classification of samples or indexes, relationship among samples should be researched. By far the most widely used two methods are similarity factor and spatial distance. From which the bigger similarity factor is, its nature more closely to samples, then classify the similar sample into one category; while bigger spatial distance means its nature quite further from samples, it can classify it into one category which distance becomes smaller. Common distances are like Ming distance as formula (2) shows, mahalanobis distance as formula (3) shows and lance distance as formula (4) shows, and common similarity factors are like included angle cosine as formula(5) shows and correlation index as formula(6)shows.
p q aq ja ia
ij
q
x
x
d
1
1
(2)
1 2 j i j iij
M
X
X
X
X
d
(3) In formula(3),∑represents index covariance matrix.
i
j
n
x
x
x
x
p
L
d
pa ia ja ja ia
ij
,
,
1
,
2
,
,
1
1
(4)1
cos
1
,
cos
1 2 1 21
ij p a ja p a ia p a i ja ia ijx
x
X
x
x
(5)
1
1
,
1 2 1 21
ij p a j ja p a i ia p a j ja i ia ijr
x
x
x
x
x
x
x
x
r
(6) This paper mainly adopts the special condition thatq
2
in Ming distance, that is square Euclidean distance, as formula (7) shows.
i i iy
x
y
x
d
,
2(7)
Discriminant analysis method theoretical basis
Discriminant analysis is a statistics method that discriminate samples category, it is different from cluster analysis that establishes discriminant with some criterion based on some categories that research objects already being divided and acquired each category one batch known samples observed data, and then make discriminant classification to unknown samples.
Discriminant analysis is rich in content and multiple in method. Classify according to discriminant groups, it can be divided into two groups discriminant analysis and multiple groups discriminant analysis; according to mathematical models distinguish different total, it can be divided into linear discriminant and non linear discriminant; according to different variable handling methods in discriminant, it can be divided into step discrimination and discriminant tree etc. Among them, distance discriminant analysis is a common discriminant method, its basic idea is first respectively calculate each category gravity center according to classification data, the discriminant criterion is judge one as it comes from
i
category when it arrives the nearest toi
category gravity center distance by one observation; Given two totals to beG
1,
G
2 ,taken
1 samples fromG
1, taken
2 samples fromG
2 ,and measurep
indexes of each sample, acquire one sample actual measurement index value as
x
x
x
pX
1,
2,
,
calculated, and respectively mark them as
D
X
,
G
1
,D
X
,
G
2
,make discriminant classification according tonearest distance criterion and write it down as formula (8) shows.
2 1
2 1
2
2 1
1
,
,
,
discrim
be
To
,
,
,
,
,
,
G
X
D
G
X
D
D
X
G
G
X
D
G
X
G
D
X
G
D
X
G
X
(8) In formula(8),To be disc rim represents To be discriminant that is the meaning of waiting to be discriminated. This paper adopts Fisher discriminant method, this method is select discriminant function with the standard of Fisher criterion, which refers to relative good discriminant function can make distinguish its own category from others according to be discriminant objects n indexes to the largest extent.
Fisher discriminant method is first integrate multiple dimensional variable
X
each index into one dimensional indexY
and establish linear discriminant function, then make distance discriminant to one dimensional variableY
, which actually is a dimensionality reduction. Normal form of linear discriminant function is as formula (9) shows.n n
X
a
X
a
X
a
a
Y
0
1 1
2 2
(9)In formula(9),
Y
represents discriminant fraction,X
i represents variable that reflects research objectscharacteristics,
a
i represents characteristic variables discriminant index.EMPIRICAL RESULT ANALYSIS
Result after data standardization
[image:4.595.68.542.450.757.2]NBA all-star game official technical index statistics data in 2013 after standardization is as Table 2 shows.
Table 2: Technical index data standardization of eastern conference and western conference in 2013
No. player height score Field-goal percentage rebound assist steal Blocked shot fault eastern conference
1 Lebron James -0.159 0.941 -0.125 -0.487 1.097 0.376 -0.402 1.702 2 Chris Bosh 0.438 -0.690 -0.389 -0.780 -0.854 0.376 -0.402 0.973 3 Dwane Wade -1.354 1.192 1.548 -0.487 2.073 1.502 2.815 1.702 4 Kevin Garnett 0.916 -1.443 -1.841 -0.487 -0.854 -0.751 -0.402 -0.486 5 Carmelo Anthony -0.159 1.819 0.668 2.144 0.122 -0.751 -0.402 -0.486 6 Jrue Holiday -1.354 -0.690 0.360 -0.780 -0.854 1.502 -0.402 -0.486 7 Paul George -0.159 0.690 0.536 -0.487 0.610 1.502 -0.402 -1.216 8 Tyson Chandler 1.394 -0.565 -0.081 0.975 -1.341 -0.751 -0.402 -1.216 9 Brook Lopez 1.035 -1.066 -1.841 0.098 0.122 -0.751 -0.402 -0.486 10 Kyrie Irving -1.593 0.439 0.580 -0.487 0.610 -0.751 -0.402 0.243 11 Joakim Noah 0.797 -0.439 0.668 1.559 0.122 -0.751 1.207 -0.486 12 Luol Deng 0.199 -0.188 -0.081 -0.780 -0.854 -0.751 -0.402 0.243 Average value 2.0433 11.500 0.4183 4.6667 2.7500 0.6667 0.2500 1.6667 Standard deviation 0.0084 7.9715 0.2272 3.4201 2.0505 0.8876 0.6216 1.3707 Western conference
Cluster analysis result
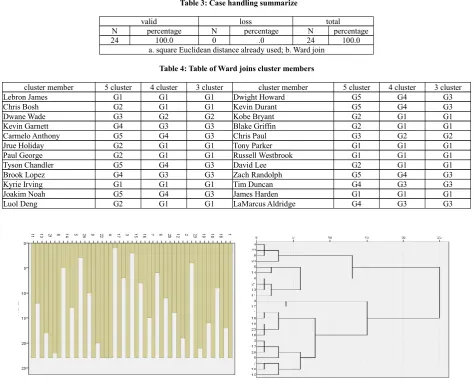
[image:5.595.69.545.120.507.2]Apply SPSS19.0 to cluster analysis of eastern conference 12 players and western conference 12 players, get results as Table 3, Table 4 and Figure 1 show.
Table 3: Case handling summarize
valid loss total
N percentage N percentage N percentage
24 100.0 0 .0 24 100.0
a. square Euclidean distance already used; b. Ward join
Table 4: Table of Ward joins cluster members
cluster member 5 cluster 4 cluster 3 cluster cluster member 5 cluster 4 cluster 3 cluster
Lebron James G1 G1 G1 Dwight Howard G5 G4 G3
Chris Bosh G2 G1 G1 Kevin Durant G5 G4 G3
Dwane Wade G3 G2 G2 Kobe Bryant G2 G1 G1
Kevin Garnett G4 G3 G3 Blake Griffin G2 G1 G1
Carmelo Anthony G5 G4 G3 Chris Paul G3 G2 G2
Jrue Holiday G2 G1 G1 Tony Parker G1 G1 G1
Paul George G2 G1 G1 Russell Westbrook G1 G1 G1
Tyson Chandler G5 G4 G3 David Lee G2 G1 G1
Brook Lopez G4 G3 G3 Zach Randolph G5 G4 G3
Kyrie Irving G1 G1 G1 Tim Duncan G4 G3 G3
Joakim Noah G5 G4 G3 James Harden G1 G1 G1
Luol Deng G2 G1 G1 LaMarcus Aldridge G4 G3 G3
Figure 1: Cluster numbers vertical dendrogram and Ward joins tree diagram
According to SPSS19.0 operation result, it can be known that total 24 players from eastern and western conference can be divided into 4 categories according to official offered index data as following.
First category, eastern conference’s Lebron James, Chris Bosh, Jrue Holiday, Paul George, Luol Deng and Kyrie Irving; Western conference’s Kobe Bryant, Tony Parker, Blake Griffin, Russell Westbrook, David Lee and James Harden;
Second category, eastern conference’s Dwane Wade and western conference’s Chris Paul;
Third category, eastern conference’s Kevin Garnett and Brook Lopez, western conference’s Tim Duncan and LaMarcus Aldridge;
Fourth category, eastern conference’s Carmelo Anthony, Tyson Chandler and Joakim Noah, western conference’s Dwight Howard, Kevin Durant and Zach Randolph.
Fisher criterion discriminant result
According to preliminary classification result got in 2.2, then based on 4 categories results vectors by cluster analysis, defined new variable “grouping category” choose SPSS-->analysis-->classification-->discriminant, adopts independent variable fully entering model to implement discriminant analysis, therefore variable value range is from 1 to 4. According to operation result, it can get each index Fisher linear index and constant in 4 categories grouping as Table 5 shows.
Table 5: Table of classification function index
statistical index group1 index Group 2 index Group 3 index Group 4 index height -3.959 13.292 -19.052 10.444 score 1.363 -1.896 -0.049 0.540 Field-goal percentage -1.489 3.399 -3.179 1.410 rebound -3.371 6.372 -8.417 6.381 assist -2.578 0.988 3.440 -1.464 Steal -.0470 2.081 -3.232 1.067 blocked shot -.0830 0.815 2.304 -3.650 fault 2.420 -5.838 7.315 -4.380 constant -3.965 -14.814 -25.282 -10.146
[image:6.595.71.543.307.438.2]Cluster result of NBA eastern and western conference players belong as Table 6 show.
Table 6: Table of Fisher criterion discriminant result
Cluster member Cluster1 Cluster2 Cluster 3 Cluster 4 affiliation Cluster member Cluster1 Cluster2 Cluster 3 Cluster 4 affiliation Lebron James 1.0813 -30.637 -3.7200 -21.775 G1 Dwight Howard -13.368 9.9917 -62.509 14.3177 G4 Chris Bosh 1.1411 -20.046 -23.753 -12.613 G1 Kevin Durant -8.4722 2.5685 -58.332 11.9962 G4 Dwane Wade 0.8273 -35.381 20.8465 -43.730 G3 Kobe Bryant -6.7548 -13.019 -15.107 -20.222 G1 Kevin Garnett -4.0812 -9.1603 -37.703 -3.0170 G4 Blake Griffin -8.5284 1.5853 -45.678 -1.3712 G2 Carmelo Anthony -10.500 -3.3768 -44.146 6.4145 G4 Chris Paul 6.4372 -52.348 34.7585 -45.754 G3 Jrue Holiday 3.5366 -30.458 -6.3045 -22.681 G1 Tony Parker 8.9038 -49.480 21.2047 -37.463 G3 Paul George -6.1040 -9.0172 -32.469 -6.2828 G1 Russell Westbrook 1.6795 -32.467 -3.1890 -20.851 G1 Tyson Chandler -12.837 14.6073 -71.769 18.1704 G4 David Lee -4.4179 -6.8077 -38.915 -4.2358 G4 Brook Lopez -8.5266 -3.6014 -41.555 0.7335 G4 Zach Randolph -9.8035 0.8225 -49.334 5.8256 G4 Kyrie Irving 2.8022 -40.659 12.6786 -30.127 G3 Tim Duncan -5.2811 -6.9496 -40.460 -0.9487 G4 Joakim Noah -15.524 11.1952 -53.618 5.5739 G2 James Harden -1.6339 -26.693 -11.495 -13.887 G1 Luol Deng 0.5992 -21.211 -21.901 -12.409 G1 LaMarcus Aldridge -6.3368 -4.9823 -34.322 -9.1477 G2
CONCLUSION
[image:6.595.71.544.528.669.2]Through Table 2 and Table 6, it can be known the NBA stars index classification contrast condition by 2 methods, as Table 7 shows.
Table 7: Result of NBA stars index classification by different methods
Cluster member Clusterresult Discriminantresult comparisonResult memberCluster Clusterresult Discriminantresult comparisonResult
Lebron James G1 G1 √ Dwight Howard G4 G4 √
Chris Bosh G1 G1 √ Kevin Durant G4 G4 √
Dwane Wade G2 G3 × Kobe Bryant G1 G1 √
Kevin Garnett G3 G4 × Blake Griffin G1 G2 ×
Carmelo Anthony G4 G4 √ Chris Paul G2 G3 ×
Jrue Holiday G1 G1 √ Tony Parker G1 G3 ×
Paul George G1 G1 √ Russell Westbrook G1 G1 √
Tyson Chandler G4 G4 √ David Lee G1 G4 ×
Brook Lopez G3 G4 × Zach Randolph G4 G4 √
Kyrie Irving G1 G3 × Tim Duncan G3 G4 ×
Joakim Noah G4 G2 × James Harden G1 G1 √
Luol Deng G1 G1 √ LaMarcus Aldridge G3 G2 ×
According to discriminant result comparison, it can be known that total 13 players affiliated cluster result is the same as their discriminant result, which indicates the directivity of discriminant classification result is correct to some extent, so final classification result should follow result in Table 6.
REFERENCES
[3] Deng Wei-ming, Sun Xue-chuan.Journal of Physical Education,2006, 13(4), 63-65. [4] Zheng Qi.Journal of Physical Education,1998, (1).
[5] Zhang Li,MA Wei-min.Journal of Physical Education,2006, 13(1), 68-71.