Journal of Chemical and Pharmaceutical Research, 2013, 5(12):570-578
Research Article
CODEN(USA) : JCPRC5
ISSN : 0975-7384
LNG spill and diffusion from transport and storage system
He Shouhui*
a, Zhu Hanhua
a, Fan Shidong
a, Huang Haofei
aand Zhang Hong
ba
Wuhan University of Technology, Wuhan, China
b
Huazhong University of Science and Technology, China
_____________________________________________________________________________________________
ABSTRACT
In order to discuss the spills from LNG carriers and accident consequences, this article builds LNG discharge rate model. A double-hull membrane-type LNG ship as one spill example case is considered, which has five tanks, each averaging 35000m3 of LNG. The two conditions are researched as follows, in the event of underwater penetration of a double-hull ship with only the outer wall, both outer hull and LNG tank breached. LNG development in initial response period and LNG evaporation adding to hull pressure are analyzed. The range of ice is also researched in this paper, forecasting the accident consequences in the end.
Key words: LNG, spill, diffusion, transport and storage
_____________________________________________________________________________________________
INTRODUCTION
Natural gas is not toxic, but LNG(Liquefied Natural Gas) is hazardous because of its temperature, the possibility of asphyxiation and of course the fire risk[1]. If people come in direct contact with the liquid or its containment material, cryogenic burns resembling frostbite can occur. Vapor or cold gas inhalation for a prolonged period can damage lungs. The viscosity of cryogenic liquids is low, this means that they penetrate through porous materials of clothing more quickly than liquids such as water. LNG is also able to cause the embrittlement of materials, such as carbon steel and rubber, and thus contribute to cracking failures[2].
While a release is often initially visible as a cloud due to the formation of frost from the atmosphere, as the gas warms up it becomes colorless and odorless and thus undetectable to human senses. It is thus easy to enter a region where the oxygen concentration is so low as to cause almost immediate unconsciousness. Obviously, as a fuel gas, it is highly flammable with a lower flammable limit (LFL) of 4-5% by volume in air and an upper flammable limit (UFL) of about 15%, depending on temperature[3-5].
LNG PROPERTIES AND HAZARDS
The properties of LNG vary with composition, which depends on the location of the original gas as shown in Table1[6].
Table 1: Typical hydrocarbon composition of LNG from various locations
Component Mole%, Source Location Trinidad Algeriaa Nigeria Oman
Methane(CH4) 96.60 87.93 91.692 87.876
Ethane(C2H6) 2.70 7.73 4.605 7.515
Propane(C3H8) 0.30 2.51 2.402 3.006
iso-Butane 0.10 0.50 1.301 1.603 n-Butane(C4H10) --- 0.72 --- ---
C5+ --- 0.61 --- ---
Total 100.00 100.00 100.00 100.00
The original gas may contain many other materials including water vapor, carbon dioxide, nitrogen, and helium, some of which must be removed for liquefaction. The critical point of methane is 190.4K, meaning methane cannot be liquefied by pressure alone at ambient temperature[7]. Rather, it must be cooled to liquefy[8]. At atmospheric pressure, it must be cooled to the boiling point in Table 2. This is quite different from liquefied petroleum gas(LPG) that is liquefied at ambient temperature with several bars of pressure.
Table 2: Some properties of LNG
Property Methane Trinidad Nigeria Oman Algeria Molecular weight 16.043 16.55 17.91 18.615 18.77 Boiling point, K
(℃)(bubble point)
111.66 (-161.5)
112.1 (-161.05)
112.7 (-160.4)
113.3 (-159.9)
113.25 (-159.9) Liquid density(kg·m-3
) (at boiling point) 422.5 430.9 452.8 463.6 452.9 Vapor density (kg·m-3 at boiling point) 1.810 1.799 1.776 1.763 1.783
Vapor density (kg·m-3 at 20℃) 0.6685 0.6894 0.7459 0.7751 0.7829
Temperature at liftoff, k(293K air) 170.1 175.1 185.9 192.4 199.0 Heat of combustion (higher, MJ·kg-1
) 50.04 49.86 49.43 49.24 49.20 Carbon footprint (gCO2·(MJ)-1) 54.8 55.3 56.3 56.8 56.9
Flammable range for vapor(mole %) 5-15 4.9-14.9 4.6-14.6 4.4-14.4 4.4-14.4 Vapor reactivity classification for explosions Low Low Low Low Low
TYPICAL LNG RECEIVING TERMINAL AND DISCHARGE RATE
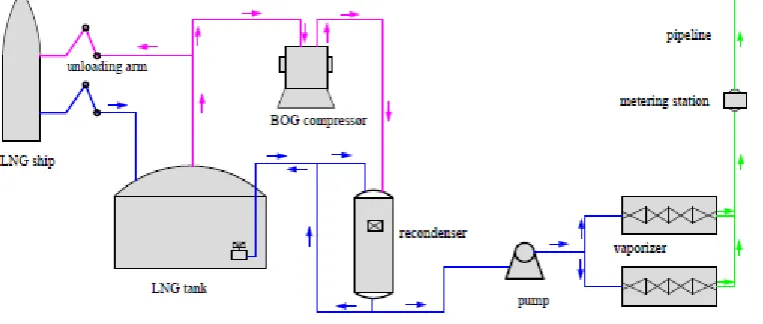
A typical LNG receiving terminal consists of four areas[9-12]: (1) the dock and storage tank area, connected by the LNG transfer line loop; (2) the LNG process area for regasification; (3) the utilities area; (4) the supporting area. The overall flow diagram is illustrated in the flowing figure.
Fig.1: Flow diagram of an LNG receiving terminal[13]
A transfer line loop delivers liquid from the docked LNG ship to the storage tank and returns displaced vapor to the carrier tanks to avoid drawing a vacuum in the ship or building pressure in the terminal tank. The transfer line loop recirculates at other times. A boil-off compressor recovers vapors evaporated during the transfer. Liquid is pumped to the pipeline pressure and is then vaporized.
In general for liquids or vapors discharge, the discharge rate is given in terms of w:
AG
C
w
D(1)
where: w--discharge rate, kg/s; CD--discharge coefficient, 0.61CD0.975[14]; A--effective cross-sectional area of breach, m2; G--mass flux, kg·(m2s)-1;
The simplest discharge formula has proved to be adequate to predict LNG discharge rates, the Bernoulli equation for subcooled liquids:
120
0
2
LP
P
backu
is not underwater; P0--pressure of liquid at the breach, Pa;
L L head
gh
P
P
0
(3)
Where: Phead---the head pressure above the LNG level, pa; hL---length between the liquid level and the breach, m;
The discharge velocity at the breach, υ, is from Equations (1) and (2):
L D L
C
A
w
G
(4)LNG SPILL AND CONSEQUENCE FORECAST
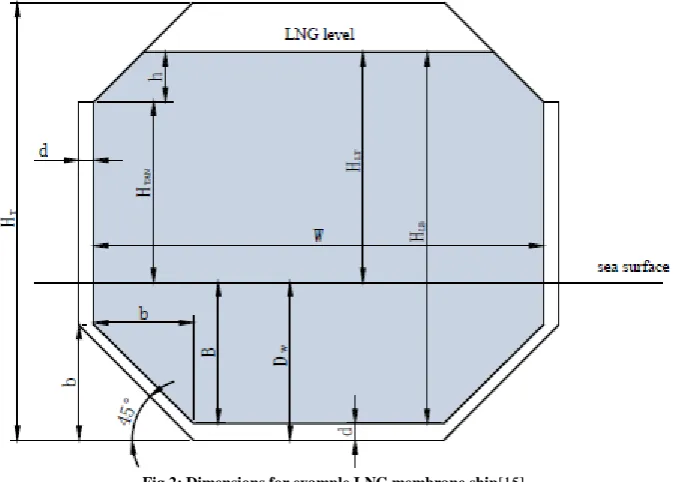
As example cases, consider a double-hull membrane-type LNG ship with five tanks averaging 35000m3 of LNG each. Typically, 25000m3 is above the water level, giving a liquid level of about 17m above the water level. The dimensions of a typical double-hull LNG carrier are shown in figure 2 and are listed in table 3.
[image:3.595.139.476.271.512.2]Fig.2: Dimensions for example LNG membrane ship[15]
Table 3: Assumed dimensions for LNG membrane ship
name symbol Value(m) name symbol Value(m)
Ship length Lship 270 Number of tanks Ntanks 5
Tank length L 50 Ship draft DW 8.8
Tank height HT 30.58 LNG level above water level HLT 17.05
Interior tank width W 30 LNG level from inner tank bottom HLB 23.65
Interior bevel height B 6.6 LNG level in upper bevel h 3.34 Double-hull separation d 2.2
Fig.3: A sketch of LNG outflow and sea water inflow
Hydraulic head differences between seawater, Pw and LNG, PL, affect in flow rates.
gz
P
w
w (5)L L L
gH
P
(6)
Where: w---density of seawater, kg·m-3; L---density of LNG, kg·m-3; z---water depth, m; HL---LNG level above the
water, m;
The total pressure at depth z, Pt, depends also on the head pressure above the liquid, Ph:
f h Tf
P
P
P
(7)Where: Pf--- pressure, for water(f=w) and LNG(f=L).
In the event of underwater penetration of only the outer wall of a double-hull ship, water inflow will displace the air in the double-hull space and will raise the pressure in this space by compression. The density of gas in the compressed volume is
w h
air air
air V
V
V
m
V
m
0 02
(8)Where: mair0---initial mass of air, kg; Vair---air volume in the hull space, m3; Vw---volume of water intrusion, m3;
Vh---volume of hull space, m3;
The head pressure in the hull, Ph, assuming there is no air leakage, can be found by assuming isothermal
compression:
2 2 2
V V h
M
RT
P
(9)Where: MV2---mole weight of the air and LNG vapor; R---gas constant; T2---temperature after compression(ambient
temperature);
Table 4: Water depth in double hull at initial and final pressure equilibrium
Top of hole below water level(m)
Hydraulic pressure of sea at hole(kPa)
Water level in hull at initial pressure equilibrium(m)
Final water level in hull(m)
Initial water intrusion volume(m3)
Final water intrusion volume(m3)
-1 9.8 0.4 9.32 187 1812
-3 29.4 1.12 7.32 525 1594
-5 49.1 1.74 5.32 818 1376
-7 68.7 2.27 4.26 1070 1260
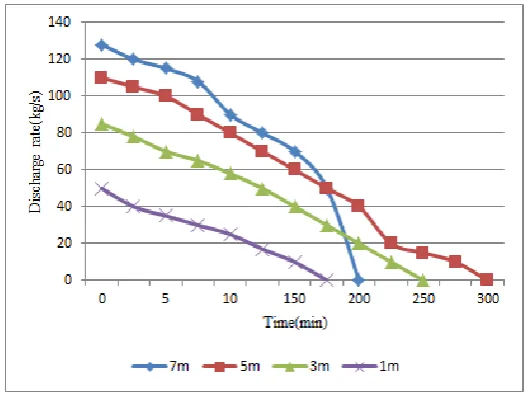
[image:5.595.174.438.208.416.2]The pressure buildup in the hull affects the rate of water inflow. Assume that the hole is 0.15m at depths of 1, 3, 5, 7m. As is shown in the flowing figure.
Fig.4: Time-dependent water inflow rates for outer hull penetration
Longer term, the predicted water inflow rate is shown in the flowing figure for a hole diameter of 0.15m at a 1m depth.
Fig.5: Water inflow rate in the outer hull of ship
If the inner hull is also breached at the same time as the outer hull, then LNG and water enter the hull space. Generally, all of the LNG would very quickly vaporize. Water in the hull space will be chilled and some fraction could freeze.
[image:5.595.160.453.462.642.2]
NBP CV
eq CV
NBP CvapwFus w eq wL amb
wL L
w
T
H
T
H
T
H
H
f
T
H
T
H
m
m
(10)
Where: mw---a mass of water, kg; mL--- a mass of LNG, kg; HwL---enthalpy of liquid water, kJ·kg-1; HwFus---heat of
fusion of water, 333.68 kJ·kg-1
; fw---mass fraction of the mass mw that freezes; Hcvp---heat of vaporization of LNG,
516.2 kJ·kg-1 at TNBP of LNG; Tamb---ambient temperature, initial temperature of liquid water, 283.15k;
TNBP---normal boiling point of LNG, K; Teq---equilibrium temperature of mixture, 273.2K if ice is present;
The flowing figure plots the ratio of the mass ratio of LNG vaporized to water against the mass ratio of water that freezes.
Fig.6: Mass fraction of LNG vaporized by freezing water
We can see that the mass ratio of LNG vapor/water is close to linear variation approximately. This is because the existence of thermal transmission. The surrounding water is cooling as the temperature of LNG rises. As a result that some of the LNG become vapor and some water turn into freeze. The quantity of LNG vapor rises as the scope of freezing water increases. The flowing figure plots the same LNG vapor/water ratio against the degrees of ice subcooling.
Fig.7: Mass fraction of LNG vaporized by subcooling ice
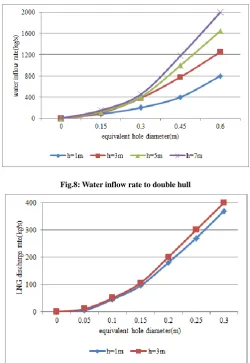
hole size and penetration depth. These rates are plotted in figure 8 and 9.
[image:7.595.180.431.94.458.2]Fig.8: Water inflow rate to double hull
Fig.9 LNG inflow rate to double hull
For the same hole size, the inflow rates for LNG are less by a factor of two to five than the inflow rate of water and are less sensitive to penetration depth[16-18]. With these inflow rates at various hole size ratios(outer hull to inner hull), table 5 gives the mass ratio of LNG to water.
Table 5: Initial LNG to water inflow ratios in the hull and mass fraction of ice formed
Hole diameter ratio(DOH/DIH)
Mass ratio mixing(mLNG/mw)
1m hole depth 3m hole depth 5m hole depth 7m hole depth
m
m
m
m
m
m
15
.
0
45
.
0
10
.
0
30
.
0
05
.
0
15
.
0
1
:
3
0.222 0.135 0.110 0.097
0
.
60
m
0
.
30
m
1
:
2
0.495 0.312 0.250 0.218Mass ratio ice/water(mIce/mwater)
m
m
m
m
m
m
15
.
0
45
.
0
10
.
0
30
.
0
05
.
0
15
.
0
1
:
3
0.46 0.24 0.175 0.142
0
.
60
m
0
.
30
m
1
:
2
1.0 0.695 0.536 0.455 [image:7.595.121.492.550.748.2]diameter ratios, the LNG/water ratio is higher and ice/water ratios range up to 100%; that is, under some conditions, all of the water is estimated to freeze. This does not account for salt water composition or for heat conduction through the hull[19].
LNG EVAPORATION ADDS TO HULL PRESSURE
An LNG leak contributes additional vapor and cooling and strongly changes the dynamics. In the early response period, there is likely to be sufficient water to vaporize all LNG in the hull space. The vapor density in the hull space changes by the added mass of LNG vapor:
W h
CV air V
V
V
m
m
(11)Where: mcv---added mass of LNG vapor, kg;
[image:8.595.189.427.319.462.2]Using an adiabatic mixing curve developed by solving the mass and enthalpy balance gives the change in temperature and pressure.
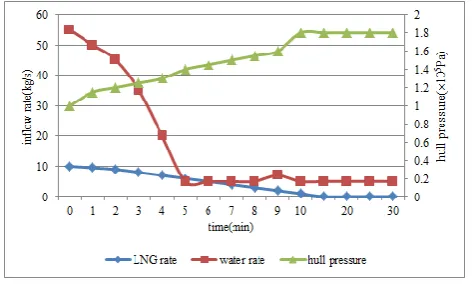
Figure 10 illustrates predicted water and LNG inflow curves for an example 1m deep, 0.15m outer hole, 0.05m inner hole.
Fig.10: Response of penetration of outer and inner hull
The water inflow rate drops to 5kg·s-1 at 3.7min as the period of equal volume exchange begins for water inflow and vapor outflow. The LNG inflow rate begins at 10 kg·s-1 and goes to near zero after 12min as the equal volume
[image:8.595.182.431.583.728.2]exchange begins for LNG. There is little effect on the LNG tank head pressure during this period.
Figure 11 provides the change in vapor composition over time for the same example case. The composition reaches concentrations with about 50% natural gas, well above the UFL, so nonflammable. When the LNG outflow is essentially choked off, these values remain nearly constant.
CONCLUSION
This article discusses the spills from LNG transport and storage system, the following conclusions can be easily drawn:
(1) The discharge rate model has the adaptability in forecasting the rate of LNG spill under the given conditions. (2) A breach under the water line can occur from grounding or collisions. In the event of underwater penetration of only the outer wall of a double-hull ship, water inflow will displace the air in the double-hull space and will raise the pressure in this space by compression. If the hull water level is below the top of the hull penetration, there will be an unstable interface of air on one side and water on the other. Air in the inner hull will escape by buoyancy. An equal volume exchange of air and water can occur at constant hull pressure. Eventually, the water level in the hull space covers the hole. If the inner hull is also breached at the same time as the outer hull, then LNG and water enter the hull space. Generally, all of the LNG would very quickly vaporize. Water in the hull space will be chilled and some fraction could freeze.
(3)Under the given conditions, the mass ratio of LNG vapor/water is close to linear variation approximately. The quantity of LNG vapor rises as the scope of freezing water increases. 0.045kg of LNG is vaporized by cooling 1kg of liquid water from 10℃ to the freezing point. The water inflow rate drops to 5 kg·s-1 at 3.7min as the period of equal volume exchange begins for water inflow and vapor outflow. The LNG inflow rate begins at 10 kg·s-1
and goes to near zero after 12min as the equal volume exchange begins for LNG. There is little effect on the LNG tank head pressure during this period.
(4)With a 3:1 hole size ratio, the mass ratio of LNG to water is in the low range. With 2:1 hole diameter ratios, the LNG/water ratio is higher and ice/water ratios range up to 100%; that is, under some conditions, all of the water is estimated to freeze. This does not account for salt water composition or for heat conduction through the hull.
REFERENCES
[1]Vallejo. LNG Health and Safety Committee of the Disaster Council City of Vallejo, CA, LNG in Vallejo: Health and safety issues, January 26, 2003.
[2]FERC. Notice of availability of staff’s responses to comments on the consequence assessment methods for incidents involving releases from liquefied natural gas carriers, Federal Energy Regulatory Commission, Docket No. AD04-6-000, June 18, 2004.
[3]Anay L H. Luketa-Hanlin, Anay. Journal of Hazardous Materials, 2006,132(2):119-140. [4]Ronald P K, Donald L E. Journal of Hazardous Materials,2007,140(3):412-428.
[5]Lvings M J, Jagger S F, Lee C J. Evaluating Vapor Dispersion Models for Safety Analysis of LNG Facilities Research Project. The Fire Protection Research Foundation, Quincy, Massachusetts,2007.
[6]U.S. Department of Energy[DOE], 2008.
[7]BAI Feifei and ZHANG Zaoxiao. Chinese Journal of Chemical Engineering, 2008,16(1):95-99.
[8]BIAN Haijun, XU Wendong, LI Xiuxi and QIAN Yu. Chinese Journal of Chemical Engineering,
2011,19(3):452-461.
[9]Anay Luketa-Hanlin. Journal of Hazardous Materials A132,2006,119-140.
[10]Hartmut Tworuschka. Planumg und Bau eines Wellenbrechers mit integrierter Hafenanlange für den LNG-Terminal in Swinemünde. Beton-und Stahlbetonbau Spezial 2012-Häfen und Kaianlagen.
[11]Ronald P. Koopman, Donald L. Ermak. Journal of Hazardous Materials ,2007,140,412-428. [12]J.A.Fay. Journal of Hazardous Materials,2007,140,541-551.
[13]Durr C. The fundamentals of base load-LNG: Design and construction of LNG terminals. Training presentation, Feb 14,2004.
[14]Kneebone A, Prew LR. Shipboard jettison tests on LNG on to the sea. Proceedings of the 4th International Conference on LNG, Gastech’74, Algiers, November13-14,1974.
[15]Woodward JL. Process Safety Progress.2008,27(4):336-344.
[16]Jerry Havens and Tom Spicer. Process Safety Progress, 2005,24(3):181-185. [17]Huo R, Chow W K, J in X H, et al. Building and Environment, 2005,40(9):186-191. [18]Fay JA. J. Hazard. Mater. 2003, B96,171-183.