On the Consistency of Slacks-based Measure-max Model
and Super-slacks-based Measure Model
Kaoru Tone
National Graduate Institute for Policy Studies, Japan
Copyright©2017 by authors, all rights reserved. Authors agree that this article remains permanently open access under the terms of the Creative Commons Attribution License 4.0 International License
Abstract
Slacks-based measure (SBM) (Tone [1]), Pastor et al. [2]) has been widely utilized as a representative non-radial DEA model. However, this model, called SBM-Min here, evaluates the efficiency of an inefficient DMU referring to the furthest frontier point within a range. In contrast, the SBM-Max model looks for the nearest frontier point and hence its score is generally greater than the SBM-Min score. The Super-SBM model (Tone [3]) evaluates the efficiency of an efficient DMU referring to the nearest point on the frontier except itself. We can foresee a close connection between SBM-Max and Super-SBM models, because the motivations behind the two models are same. In this paper we demonstrate this consistency using a real dataset.
Keywords
Data Envelopment Analysis, Slacks-based Measure, SBM-Max, Super-SBM1. Introduction
There are two types of models in DEA (Data Envelopment Analysis); radial and non-radial. Radial models are represented by the CCR (Charnes-Cooper-Rhodes) model (Charnes et al. [4]). Basically they deal with proportional changes of inputs or outputs. As such, the CCR score reflects the proportional maximum input (output) reduction
(expansion) rate which is common to all inputs (outputs). However, in real world businesses, not all inputs (outputs) behave in the proportional way. For example, if we employ labor, materials and capital as inputs, some of them are substitutional and do not change proportionally. Another shortcoming of the radial models is the neglect of slacks in reporting the efficiency score. In many cases, we find a lot of remaining non-radial slacks. So, if these slacks have an important role in evaluating managerial efficiency, the radial approaches may mislead the decision when we utilize the efficiency score as the only index for evaluating performance of DMUs.
In contrast, the non-radial SBM models put aside the assumption of proportionate changes in inputs and outputs, and deal with slacks directly. This may discard varying proportions of original inputs and outputs. The SBM models are designed to meet the following two conditions.
(1) Units invariant: The measure should be invariant with respect to the units of data
(2) Monotone: The measure should be monotone decreasing in each slack in input and output.
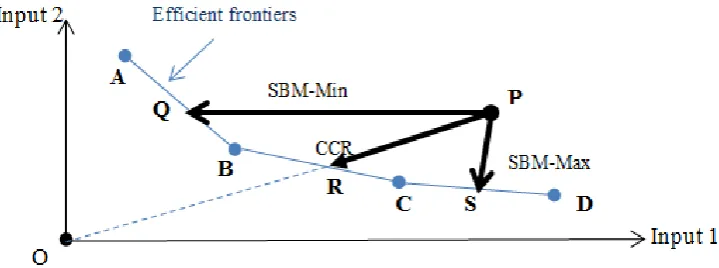
[image:1.595.126.486.604.738.2]The original SBM (SBM-Min) model evaluates efficiency of DMUs referring to the furthest frontier point within a range. These results in the worst score for the objective DMU and the projection may go to a remote point on the efficient frontier which may be inappropriate as the reference.
We depict the relationship among the ordinary SBM (SBM-Min), CCR and SBM-Max models by Fig. 1. Inefficient DMU P’s projections are Q, R and S respectively by SBM-Min, CCR and SBM-Max. Mathematically, finding S belongs to a NP-hard problem, because it is a maximization problem of a convex function over a non-convex region. However, the projected point S indicates that we can attain an efficient status with less input reductions and less output expansions than the ordinary SBM (Min) models. We can say that the projection by the SBM-Max model represents a practical “Kaizen” (improvement) by DEA.
Since the epoch-making paper by Charnes, Cooper and Rhodes [4] was published, DEA has been applied in many fields of production. However, so far, its main objective is the measurement of productive efficiency, but improvement (Kaizen) of production processes was not discussed in depth. The SBM-Max model [5] proposed by Tone aims directly Kaizen. For an inefficient DMU, this model projects the DMU to the minimum distance point on the frontiers, where the distance is measured by the amount of slacks in inputs and outputs.
The rest of this paper is organized as follows. Section 2 introduces the ordinary SBM-Min model briefly. Section 3 presents the SBM-Max model, while Section 4 describes the Super-SBM model. A numerical example is reported in Section 5. Section 6 concludes this paper. Although we present the model in non-oriented model, we can treat input- and output-oriented model as well. As to returns-to-scale characteristics, we present the constant returns-to-scale (CRS) case. However we can deal with the variable returns-to-scale (VRS) model as well.
2. The SBM-Min Model
The SBM model was introduced by Tone [1] (see also Pastor et al. [2]). It has three variations, i.e. input-, output- and non-oriented. The non-oriented model indicates both input- and output-oriented.
Let the set of DMUs be J=
{
1,2, , n}
, each DMU having m inputs and s outputs. We denote the vectors of inputs and outputs for DMUj by xj=( ,x x1j 2j, , xmj)T and1 2
( , , , )T
j= y yj j ysj
y , respectively. We define input and output matrices X and Y by
1 2 1 2
( , , , )n Rm n× and ( , , , )n Rs n×
= ∈ = ∈
X x x x Y y y y . (1) We assume that all data are positive i.e.X 0> and .Y 0>
2.1. Production Possibility Set
The production possibility set is defined using the non-negative combination of the DMUs in the set J as:
1 1
( , ) n j j, n j j, .
j j
P λ λ
= =
= ≥ ≤ ≤ ≥
x y x
∑
x 0 y∑
y λ 0 (2)(
λ λ1 2, , ,λn)
T =λ is called the intensity vector.
The inequalities in (2) can be transformed into equalities by introducing slacks as follows:
1 1 , , n j j j n j j j λ λ − = + = − + = + = − ≥ ≥
∑
∑
x x s
y y s
s 0 s 0
(3)
where s−=( , , , )s s1 2− −sm− T∈Rmand ( , , , )s+= s s1 2+ +s+s T∈Rs are respectively called input and output slacks.
2.2. Non-oriented SBM
Non-oriented or both-oriented SBM efficiency min
( , )
o o
ρ
x y
is defined by1 min , , 1 1 1
1
1
[SBM-Min]
( , ) min
1
1
subject to
( 1, , )
(
1, , )
m i i
io
o o o
s r r
ro
n
io j ij j i n
ro j rj j r
s
m
x
s
s
y
x
x
s i
m
y
y
s r
s
ρ
λ
λ
− + − = + = − = + =−
=
+
=
+
=
=
−
=
∑
∑
∑
∑
λ s s
x y
λ
j≥
0 ( ),
∀
j s
i−≥ ∀
0( ),
i s
r+≥ ∀
0( ).
r
(4)
[Definition 1] (SBM-efficient) A DMUo
=
( , )
x y
o o is called SBM-efficient ifρ
min( , ) 1
x y
o o=
holds.This means
s
−=
0
ands
+*=
0
, i.e. all input and output slacks are zero.[SBM-Min] can be transformed into a linear program using the Charnes-Cooper transformation as follows:
* 1 , , , 1 1 1 [SBM-Min-LP] min subject to
1 1
( 1, , ) m i i t io s r r ro n
io j ij j i
S t m x S t s y
tx x S i m
t − + = −
+ = − = = − = +
= L + =
∑
∑
∑
Λ S S
1
( 1, , )
0 ( ), 0( ), 0( ), 0.
n
ro j rj j r
j i r
ty y S r s
j S i S r t
+ =
− +
= L − =
L ≥ ∀ ≥ ∀ ≥ ∀ >
∑
min( , ) *, * */ ,* * */ ,* * */ .*
o o t t t
ρ
x y =t
λ =Λ s− =S− s+ =S+(6)
3. The Frontier of Production Possibility
Set and the SBM-Max Model
We define the frontier F of the production possibility set P as follows:
(
)
{
}
min
,
such that
( , ) 1
,
,
.
f f f f f fF
θ
=
=
≥
≤
≥
x y
x y
x
Xλ y
Yλ λ 0
(7)
In Figure 1, the set of line segments (AB, BC and CD) is the frontier which is non-convex.
For an inefficient DMU
( , )
x y
o o , we define the SBM-Max score as follows:(
)
1 max 11
1
( , ) max
1
1
subject to
,
.
m i i io o o s r r ro o os
m
x
s
s
y
F
θ
− = + = − +−
=
+
−
+
∈
∑
∑
x y
x s y
s
(8)
Referring these variations, several authors published new solution methods. Among them, we introduce three papers.
Fukuyama et al. [6] developed a least distance efficiency measure with the strong/weak monotonicity of the ratio form measure under several norms including 1-norm, 2-norm and ∞-norm. This model utilizes mixed-integer linear programming (MILP) to identify efficiency frontiers and hence a computational difficulty arises for large-scale problems.
Hadi-Vencheh et al. [7] developed a new SBM model to find the nearest point on the efficient frontiers. They utilize the multiplier form model to find all supporting hyperplanes. It also utilizes software which uses fractional coefficients (high precision arithmetic) to avoid loss data. Hence, computational time increases for large-scale problems.
Tone [5] proposed a scheme for solving the SBM-Max problem. This method requires a limited number of additional linear program solutions for each inefficient DMU and needs no mixed-integer linear program code. Although the point thus obtained is not always the nearest point and does not always satisfy Pareto-Koopmans efficiency condition, it is acceptable for practical purpose for solving large scale problems and from the point of computational loads. We utilized this model for solving the numerical data in Section 5.
4. The Super-SBM Model
The SBM-Max model aims at getting to the nearest point on the efficient frontiers. This concept is in line with the super-efficiency SBM model (Tone [3]) which solves the following program for an efficient DMU
(
x y
o,
o)
to mesure the minimum ratio-scale distance from the efficient frontier excluding the DMU(
x y
o,
o)
.1 * , , 1 1, 1,
1
1
[Super-SBM]
min
1
1
subject to
m i i io s r r ro n
o j j o j j n
o j j o j j
s
m
x
s
s
y
δ
λ
λ
− + − = + = − = ≠ + = ≠+
=
−
=
−
=
+
∑
∑
∑
∑
λ s s
x
x
s
y
y
s
,
−,
+.
≥
≥
≥
λ 0 s
0 s
0
(9)
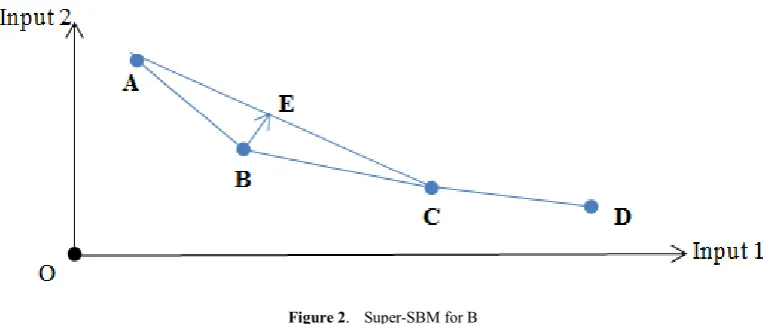
We can solve the super-efficiency SBM model by applying LP code just once, because this problem belongs to a convex programming, i.e., minimization of a convex function over a convex region. However, SBM-Max problem cannot be solved in this manner, because it is a maximization of the objective function over a non-convex region. See Fig. 2 where the efficient B is projected to E on the frontier AC with the minimum distance.
5. A Numerical Example
We compare the two approaches, i.e. (SBM-Min + Super-SBM) and (SBM-Max + Super-SBM), using the data of Japanese municipal hospitals.
5.1. Data
The data were collected from the Annual Databook of Local Public Enterprise published by the Ministry of Internal Affairs and Communications Japanese Government, 2005.
Number of DMUs: 700 hospitals (n = 700).
Number of inputs: 5. (1) No. of beds (Bed), (2) Expenses for outsourcing (Outsource), (3) No. of doctors (Doctor), (4) No. of nurses (Nurse) and (5) Expenses for other medical materials (Material). (m = 5)
[image:3.595.311.546.193.342.2] Number of outputs: 4. (1) Revenue from operation per day (Operation), (2) Revenue from first consultation per day (1st time), (3) Revenue from return to clinic per day (Follow-up) and (4) Revenue from hospitalization per day (Hotel). (s = 4)
Figure 2. Super-SBM for B
Table 1. Statistics of dataset (n = 700)
Bed Outsource Doctor Nurse Material Operation 1st time Follow-up Hotel Max 1025 2231247 215.562 955.464 2842350 17341140 1432079 3359160 15445104
Min 25 7767 0.98 11 9197 8979 2706 13636 109650 Average 249.407 300585 32.0519 170.352 469790 2029403 206916 405837 3155864
SD 181.11 310373 31.967 140.106 557030 2322876 206375 306298 2824856
5.2. Model and Method
We applied SBM-Max and SBM-Min models coupled with Super-SBM model, in non-oriented case under the constant-returns-to-scale assumption. For SBM-Max, we employed the method developed in Tone [5].
5.3. SBM Scores
The SBM model found that 66 hospitals among 700 are efficient. Table 2 compares two scores, one SBM-Max coupled with Super-SBM and the other SBM-Min coupled with Super-SBM.
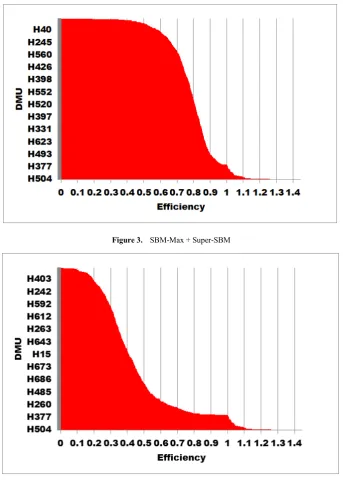
Fig. 3 (SBM-Max + Super-SBM) and Fig. 4 (SBM-Min + Super-SBM) exhibit respectively scores of 700 hospitals in ascending order where we can observe big differences. The
former shows a smooth transit from inefficient to efficient, while the latter exhibits a non-smooth transit. We can foresee a close connection between SBM-Max and Super-SBM models, because the motivations behind the two models are same.
Table 2. Comparisons of two scores SBM-Max
+ Super-SBM + Super-SBM SBM-Min Average 0.7935 0.4572
Max 1.4468 1.4468
Min 0.1023 0.0118
Figure 3. SBM-Max + Super-SBM
Figure 4. SBM-Min + Super-SBM
6. Conclusions
In this paper, we have compared the SBM-Max and SBM-Min models connected with the Super-SBM model. The finding indicates that the SBM-Max model is smoothly connected with the Super-SBM model, although the former needs 13 times of computation time than the latter in our case (we utilized DEA-Solver Pro: Saitech-Inc).
If one wishes the worst case analysis, the SBM-Min model is the choice. In contrast, if improvement to efficient status is the main concern, the SBM-Max model is qualified better. Inefficient DMUs can be improved to the efficient status with less input- reductions and less output-enlargement. Thus, the SBM-Max model proposes an efficient Kaizen
(improvement) tool by DEA.
REFERENCES
[1] Tone, K., 2001. A slacks-based measure of efficiency in data envelopment analysis. European Journal of Operational Research 130, 498-509.
[2] Pastor, J.T., Ruiz, J.L., Sirvent, I., 1999. An enhanced DEA Russell graph efficiency measure. European Journal of Operational Research 115, 596-607.
in data envelopment analysis. European Journal of Operational Research 143, 32-41.
[4] Charnes, A., Cooper, W.W., Rhodes, E., 1978. Measuring the efficiency of decision making units. European Journal of Operational Research 2, 429-444.
[5] Tone, K., 2016. Data Envelopment Analysis as a Kaizen Tool: SBM Variations revisited. Bulletin of Mathematical Sciences and Applications, 16, 49-61. DOI:
10.18052/www.scipress.com/BMSA.16.49
[6] Fukuyama, H., Masaki, H., Sekitani, K., Shi, J., 2014. Distance optimization approach to ratio-form efficiency measures in data envelopment analysis. Journal of Productivity Analysis 42, 175-186.
[7] Hadi-Vencheh, A., Jablonsky, J., Esmaeilzadeh, A., 2015. The slack-based measure model based on supporting hyperplanes of production possibility set. Expert Systems with Applications,