Journal of Chemical and Pharmaceutical Research
ISSN No: 0975-7384 CODEN(USA): JCPRC5
J. Chem. Pharm. Res., 2011, 3(4): 797-803
Influence of interfering ions as a key parameter on response of a
fabricated Tm
3+solvent polymeric membrane ion-selective electrode
Hassan Ali Zamani,* Mohammad Reza Abedi
Department of Applied Chemistry, Quchan branch, Islamic Azad University, Quchan, Iran _____________________________________________________________________________
ABSTRACT
A new Tm(III) ion-selective liquid polymeric membrane sensor based on N-[(E)-1-(2-thienyl)methylidene]-N-(4-{[(Z)-1-(2-thienyl)methylidene]amino}phenyl)amine (TTPA) has been developed. When optimized, it displays a linear Nernstian response over the range of 1.0×10⁻⁷ -1×10⁻² M of Tm(III) ion, with a slope of 20.1 mV per decade and detection limit was 8.6 ×10⁻⁸ M. The effect of several parameters, such as: a) content of the ionophore in the membrane, b) kind of the plasticizer in the membrane, c) content of additive in the membrane, d) pH of the sample solution, e) response time of the sensor and f) potentiometric selectivity coefficient were investigated. The potentiometric selectivity coefficients of thulium sensor was evaluated using the matched potential method. The sensor displayed a good selectivity for thulium with respect to number of common foreign metal ions. In order to investigate the sensors analytical applicability, it was tested as an indicator electrode in potentiometric titration of thulium against EDTA and to the determination of fluoride ions in mouth wash samples.
Keywords: Sensor, PVC membrane, Ion selective electrode, Potentiometry.
_____________________________________________________________________________
INTRODUCTION
properties of its environment. An ideal chemical sensor provides a certain type of response that is directly related to the quantity of a specific chemical species [3]. In the field of ion-selective electrode development, the formation of new electrodes and research into new ionophores are currently active areas. Additionally, miniaturization has been recognized for many years as an important area of research [4]. One important application of thulium, relatively independent of its high cost, is the use of a (0.1–0.2)-g pellet of the metal or oxide as a portable source of diagnostic X-radiation. ICP-MS and ICP-AES, spectrophotometry, and spectrofluorimetry, are the available methods for the low-level monitoring of thulium ions in solutions. These methods are either time consuming, involving multiple sample manipulations, or too expensive. There are only some reports in the literature concerning the design of highly selective ionophores for thulium [5-8]. Recently, we have reported a number of selective sensors based on different ion carriers containing nitrogen or sulfur, or both donating atoms, for some metal ions [9-30].
EXPERIMENTAL SECTION
Reagent grade oleic acid (OA), dibutyl phthalate (DBP), nitrobenzene (NB), o-nitrophenyloctyl ether (NPOE), acetophenone (AP), sodium tetraphenyl borate (NaTPB), tetrahydrofuran (THF) and high relative molecular weight poly(vinyl chloride) (PVC) were purchased from Merck chemical company and used as received. The nitrate and chloride salts of the cations used (from Merck or Aldrich) were of the highest purity available and used without any further purification except for vacuum drying over P2O5. Doubly distilled de-ionized water was used throughout.
The PVC membranes were prepared according to the following general procedure. The required amounts of the membrane ingredients (30 mg PVC, 55 mg NPOE, 1 mg NaTPB, 10 mg OA and 4 mg TTPA) were mixed and dissolved in 3 mL of dry THF. The resulting mixture was transferred into a glass dish of 2 cm in diameter. The solvent was then evaporated slowly up to the point that an oily concentrated mixture was created. A Pyrex tube (3–5mmin top) was dipped into the oily mixture for about 10 s, so that a transparent film of about 0.3mm in thickness was formed [31–35]. The tube was then removed from the mixture and kept at the room temperature for about 12 h. Eventually, the tube was filled with the internal filling solution (1.0×10⁻³ M thulium chloride). The electrode was finally conditioned for 24 h by soaking in a (1.0×10⁻² M) solution of TmCl3. A silver–silver chloride electrode was used as an internal reference electrode. The ionophore N-[(E)-1-(2-thienyl) methylidene]-N-(4-{[(Z)-1-(2-thienyl) methylidene] amino}phenyl) amine (TTPA) was synthesized in the usual manner by reaction of thiophene-2-carbaldehyde with diamine in a 2:1 molar ratio in methanol as follows. Thiophene-2-carbaldehyde (0.01 mol, 1.12 g) and diamine (0.005 mol, 0.54 g) were placed in 100 mL round-bottom flask equipped with a condenser and a magnetic bar. Methanol (50 mL) was then added to the mixture and the mixture was refluxed far 3 h while stirring, and then cooled to room temperature. The solid product was filtered, and the product was recrystallized from chloroform [36-38].
All emf measurements were carried out with the following assembly:
Ag–AgCl| 1.0 × 10⁻³ M TmCl3 | PVC membrane: test solution| Hg–Hg2Cl2, KCl (satd).
RESULTS AND DISCUSSION
The high Tm(III) ion extraction into the liquid membrane was a result of the elevated ionophore tendency to form a selective complex with the Tm(III) ions. Because the degree of sensitivity and selectivity for a certain ionophore is greatly related to the membrane ingredients, the membrane composition influence on the potential responses of the Tm(III) sensor was inspected [39-42]. In this study, different membrane compositions were tested. The membrane with the composition of 30% PVC, 4% TTPA, 1% NaTPB, 10% OA and 55% NPOE was the optimum one in the development of this sensor. This membrane composition was selected after many considerations. The pH dependence of the sensor potential response was tested and the potential response of the proposed sensor is pH independent in the range of 3.0–8.7.
The critical response characteristics of the recommended sensor were assessed according to the IUPAC recommendations [43]. The emf response of the polymeric membrane indicated a Nernstian slope of 20.1±0.3 mV per decade across an extended thulium concentration range from 1.0×10⁻⁷ to 1.0×10⁻² M. The detection limit, defined as the thulium concentration obtained when extrapolating the linear region of the calibration graph to the base line potential, was 8.6×10⁻⁸ M.
[image:3.595.188.409.426.702.2]In this study, the practical response time was recorded by changing the Tm3+ concentration in solution, over a concentration range 1.0 × 10⁻⁷-1.0 × 10⁻² M. The results showed that in whole concentration range the electrode reaches its equilibrium response in a very short time (<10 s).
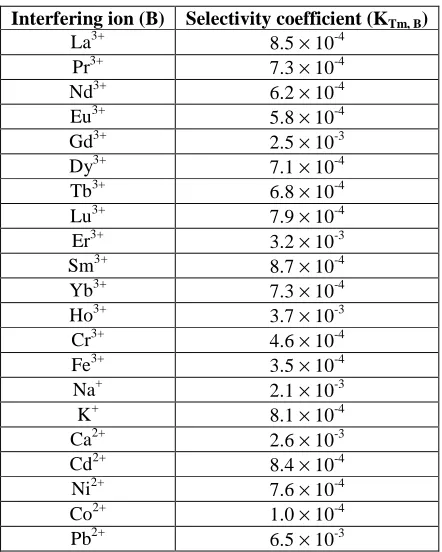
Table 1: Selectivity coefficients of various interfering ions
Interfering ion (B) Selectivity coefficient (KTm, B)
La3+ 8.5 × 10⁻⁴
Pr3+ 7.3 × 10⁻⁴
Nd3+ 6.2 × 10⁻⁴
Eu3+ 5.8 × 10⁻⁴
Gd3+ 2.5 × 10⁻³
Dy3+ 7.1 × 10⁻⁴
Tb3+ 6.8 × 10⁻⁴
Lu3+ 7.9 × 10⁻⁴
Er3+ 3.2 × 10⁻³
Sm3+ 8.7 × 10⁻⁴
Yb3+ 7.3 × 10⁻⁴
Ho3+ 3.7 × 10⁻³
Cr3+ 4.6 × 10⁻⁴
Fe3+ 3.5 × 10⁻⁴
Na+ 2.1 × 10⁻³
K+ 8.1 × 10⁻⁴
Ca2+ 2.6 × 10⁻³
Cd2+ 8.4 × 10⁻⁴
Ni2+ 7.6 × 10⁻⁴
Co2+ 1.0 × 10⁻⁴
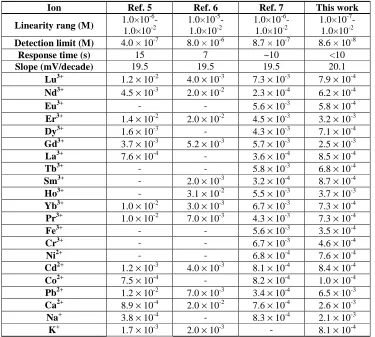
Table 2: Comparison of selectivity coefficients ( 3
MPM
Tm ,B
K
+ ), linearity range, detection limit, response time andslope of proposed Tm3+ sensor and the previously reported Tm3+ ion-selective electrodes.
Ion Ref. 5 Ref. 6 Ref. 7 This work
Linearity rang (M) 1.0×10
-6 -1.0×10⁻²
1.0×10⁻⁵ -1.0×10⁻²
1.0×10⁻⁶ -1.0×10⁻²
1.0×10⁻⁷ -1.0×10⁻²
Detection limit (M) 4.0 × 10⁻⁷ 8.0 × 10⁻⁶ 8.7 × 10⁻⁷ 8.6 × 10⁻⁸
Response time (s) 15 7 ~10 <10
Slope (mV/decade) 19.5 19.5 19.5 20.1
Lu3+ 1.2 × 10⁻² 4.0 × 10⁻³ 7.3 × 10⁻³ 7.9 × 10⁻⁴
Nd3+ 4.5 × 10⁻³ 2.0 × 10⁻² 2.3 × 10⁻⁴ 6.2 × 10⁻⁴
Eu3+ - - 5.6 × 10⁻³ 5.8 × 10⁻⁴
Er3+ 1.4 × 10⁻² 2.0 × 10⁻² 4.5 × 10⁻³ 3.2 × 10⁻³
Dy3+ 1.6 × 10⁻³ - 4.3 × 10⁻³ 7.1 × 10⁻⁴
Gd3+ 3.7 × 10⁻³ 5.2 × 10⁻³ 5.7 × 10⁻³ 2.5 × 10⁻³
La3+ 7.6 × 10⁻⁴ - 3.6 × 10⁻⁴ 8.5 × 10⁻⁴
Tb3+ - - 5.8 × 10⁻³ 6.8 × 10⁻⁴
Sm3+ - 2.0 × 10⁻³ 3.2 × 10⁻⁴ 8.7 × 10⁻⁴
Ho3+ - 3.1 × 10⁻² 5.5 × 10⁻³ 3.7 × 10⁻³
Yb3+ 1.0 × 10⁻² 3.0 × 10⁻³ 6.7 × 10⁻³ 7.3 × 10⁻⁴
Pr3+ 1.0 × 10⁻² 7.0 × 10⁻³ 4.3 × 10⁻³ 7.3 × 10⁻⁴
Fe3+ - - 5.6 × 10⁻³ 3.5 × 10⁻⁴
Cr3+ - - 6.7 × 10⁻³ 4.6 × 10⁻⁴
Ni2+ - - 6.8 × 10⁻⁴ 7.6 × 10⁻⁴
Cd2+ 1.2 × 10⁻³ 4.0 × 10⁻³ 8.1 × 10⁻⁴ 8.4 × 10⁻⁴
Co2+ 7.5 × 10⁻⁴ - 8.2 × 10⁻⁴ 1.0 × 10⁻⁴
Pb2+ 1.2 × 10⁻² 7.0 × 10⁻³ 3.4 × 10⁻⁴ 6.5 × 10⁻³
Ca2+ 8.9 × 10⁻⁴ 2.0 × 10⁻² 7.6 × 10⁻⁴ 2.6 × 10⁻³
Na+ 3.8 × 10⁻⁴ - 8.3 × 10⁻⁴ 2.1 × 10⁻³
K+ 1.7 × 10⁻³ 2.0 × 10⁻³ - 8.1 × 10⁻⁴
electrodes previously reported in the literature by other researchers [5-7]. Table 2 reveals that the proposed sensor is superior to the formerly published Tm3+ sensor.
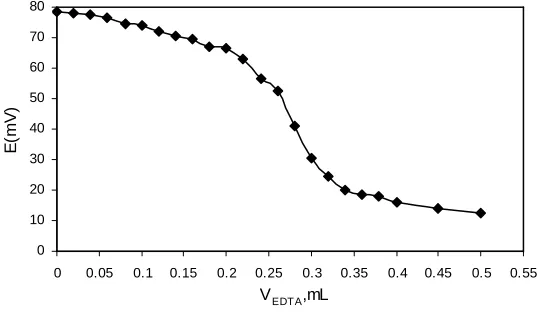
The proposed membrane electrode was used as an indicator electrode in the potentiometric titration of a 1.0×10⁻⁴ M Tm3+ ion solution with a standard 1.0×10⁻² M of EDTA. The resulting titration curve is shown in Figure 1. As seen, the sensor is capable of monitoring of the amount of Tm3+ ions.
The membrane sensor was also used for the fluoride ion determination in two mouth wash samples. 1.0 g of each sample was taken and diluted with distilled water in a 100 mL flask and titrated with a Tm3+ solution (1.0 × 10⁻³ M) and the results of triplicate measurements are summarized in Table 3. It is clear that there is a satisfactory agreement between the declared fluoride content and the values determined by the proposed electrode.
Table 3: Determination of fluoride ions in mouth wash solutions
Sample Labeled (ppm) Found ISEa (ppm) Sodium fluoride mouth wash solution
(Aquafresh, Brentford, U.K.)
1350 (1383b± 22)
Sodium fluoride mouth wash solution (Eurodont, DuroDont GmbH)
1450 (1485b± 17)
a. Proposed Tm3+ sensor
b. Results are based on three measurements
0 10 20 30 40 50 60 70 80
0 0.05 0.1 0.15 0.2 0.25 0.3 0.35 0.4 0.45 0.5 0.55
VEDTA,mL
E
(m
V
[image:5.595.168.437.423.579.2])
Figure 1. Potential titration curve of 25.0 mL from a 1.0×10⁻⁴ M Tm3+ solution with 1.0×10⁻² M of EDTA.
Acknowledgements
The authors acknowledge the financial support kindly offered by the Research Council of Quchan Islamic Azad University for the preparation of this study.
REFERENCES
[3] MR Ganjali; P Norouzi; M Rezapour. Encyclopedia of Sensors 2006, 8, 197. [4] B Csoka; Z Mekhalif. Electrochim. Acta 2009, 54, 3225.
[5] MR Ganjali; P Nourozi; A Tamaddon; S Waqif Husain. Bull. Korean. Chem. Soc. 2006, 27, 1418.
[6] MR Ganjali; S Rasoolipour; M Rezapour; P Norouzi; M Adib. Electrochem. Comimun. 2005, 7, 989.
[7] HA Zamani; M Nekoei; M Mohammadhosseini; MR Ganjali. Mater. Sci. Eng. C 2010, 30, 480.
[9] HA Zamani; MR Ganjali; P Norouzi; M Adib. Sensor Lett., 2007, 5, 522. [10] HA Zamani. Anal. Lett., 2009, 42, 615.
[11] HA Zamani; H Ghahremani; H Behmadi. J. Chem. Pharm. Res. 2010, 2, 328. [12] HA Zamani; G Rajabzadeh; MR Ganjali; Sensor Lett., 2009, 7, 114.
[13] MR Abedi; HA Zamani; MR Ganjali; P Norouzi. Sensor Lett., 2007, 5, 516.
[14] HA Zamani; A Arvinfar; F Rahimi; A Imani; MR Ganjali; S Meghdadi. Mater. Sci. Eng. C
2011, 31, 307.
[15] HA Zamani; MR Ganjali; P Norouzi; M Adib; M Aceedy. Anal. Sci., 2006, 22, 943. [16] HA Zamani; G Rajabzadeh; MR Ganjali; P Norouzi. Anal. Chim. Acta 2007, 598, 51. [17] HA Zamani; G Rajabzadeh; MR Ganjali. Bull. Chem. Soc. Japan 2007, 80, 172.
[18] M Masrournia; HA Zamani; HA Mirrashid; MR Ganjali; F Faridbod. Mater. Sci. Eng. C
2011, 31, 574.
[19] HA Zamani; MT Hamed-Mosavian; E Aminzadeh; MR Ganjali; M Ghaemy; H Behmadi; F Faridbod. Desalination 2010, 250, 56.
[20] HA Zamani; M Mohammadhosseini; M Nekoei; MR Ganjali. Sensor Lett., 2010, 8, 303. [21] HA Zamani; MR Ganjali; P Norouzi; M Adib. Mater. Sci. Eng. C 2008, 28, 157.
[22] H Behmadi; HA Zamani; MR Ganjali; P Norouzi. Electrochim. Acta 2007, 53, 1870. [23] HA Zamani; MR Ganjali; M Salavati-Niasari. Transition. Met. Chem., 2008, 33, 995. [24] HA Zamani; MS Zabihi; M Rohani; A Zangeneh-Asadabadi; MR Ganjali; F Faridbod; S Meghdadi. Mater. Sci. Eng. C 2011, 31, 409.
[25] MR Abedi; HA Zamani. Anal. Lett., 2008, 41, 2251.
[26] HA Zamani; A Imani; A Arvinfar; F Rahimi; MR Ganjali; F Faridbod; S Meghdadi. Mater. Sci. Eng. C 2011, 31, 588.
[27] HA Zamani; G Rajabzadeh; M Masrornia; A Dejbord; MR Ganjali; N Seifi. Desalination
2009, 249, 560.
[28] HA Zamani; MR Ganjali; P Norouzi; A Tadjarodi; E Shahsavani. Mater. Sci. Eng. C 2008, 28, 1489.
[29] HA Zamani; M Rohani; A Zangeneh-Asadabadi; MS Zabihi; MR Ganjali; M Salavati-Niasari. Mater. Sci. Eng. C 2010, 30, 917.
[30] HA Zamani; G Rajabzadeh; MR Ganjali. Talanta 2007, 72, 1093.
[31] MR Ganjali; F Faridbod; P Norouzi; M Adib. Sens. Actuators B 2006, 120, 119.
[32] HA Zamani; MT Hamed-Mosavian; E Hamidfar; MR Ganjali; P Norouzi. Mater. Sci. Eng. C 2008, 28, 1551.
[33] MR Ganjali; P Norouzi; A Atrian; F Faridbod; S Meghdadi; M. Giahi. Mater. Sci. Eng. C
2009, 29, 205.
[34] MR Ganjali; P Norouzi; A Atrian; F Faridbod; S Meghdadi; M. Giahi. Mater. Sci. Eng. C
2009, 29, 205.
[36] S Chandra; BN Ghogare; LK Gupta; CP Shinde. J. Chem. Pharm. Res. 2010, 2, 240. [37] CK Patel; CS Rami; B Panigrahi; CN Patel. J. Chem. Pharm. Res. 2010, 2, 73. [38] SK Srivastava; S Verma; SD Srivastava. J. Chem. Pharm. Res. 2010, 2, 270.
[39] E Ammann; E Pretsch; W Simon; E Lindner; A Bezegh; E Pungor. Anal. Chim. Acta 1985, 171, 119.
[40] MR Ganjali; P Norouzi; T Alizadeh; A Tajarodi; Y Hanifehpour. Sens. Actuators B 2007, 120, 487.
[41] MR Ganjali; M Rahimi; B Maddah; A Moghimi; S Borhany. Anal. Sci. 2004, 20, 1427. [42] E Bakker; P Buhlmann; E Pretsch. Electroanalysis 1999, 11, 915.
[43] IUPAC Analytical Chemistry Division, Commission on Analytical Nomenclature, Recommended for nomenclature of ion-selective electrodes, Pure Appl. Chem. 1976, 48, 127. [44] VK Gupta; RN Goyal; RA Sharma. Int. J. Electrochem. Sci., 2009, 4, 156.
[45] MR Ganjali; P Norouzi; A Daftari; F Faridbod; M Salavati-Niasari. Sens Actuators B 2007, 120, 673.
[46] MR Ganjali; N Davarkhah; H Ganjali; B Larijani; P Norouzi; M Hosseini. Int. J. Electrochem. Sci. 2009, 4, 762.