Till, K and Cobley, S and O’Hara, J and Brightmore, A and Cooke, CB and Chapman, C (2011) Using anthropometric and performance characteristics to predict selection in junior UK Rugby League players. Journal of science and medicine in sport / Sports Medicine Australia, 14 (3). 264 - 269. ISSN 1440-2440 DOI: https://doi.org/10.1016/j.jsams.2011.01.006
Link to Leeds Beckett Repository record: http://eprints.leedsbeckett.ac.uk/312/
Document Version: Article
The aim of the Leeds Beckett Repository is to provide open access to our research, as required by funder policies and permitted by publishers and copyright law.
The Leeds Beckett repository holds a wide range of publications, each of which has been checked for copyright and the relevant embargo period has been applied by the Research Services team.
We operate on a standard take-down policy. If you are the author or publisher of an output and you would like it removed from the repository, please contact us and we will investigate on a case-by-case basis.
Running head: Selection in UK Junior Rugby League 1
2
3
4
Using Anthropometric and Performance Characteristics to Predict Selection in Junior UK 5
Rugby League Players 6
7
8
Kevin Tilla, Steve Cobleya, John O’Haraa, Amy Brightmorea, Carlton Cookea and Chris 9
Chapmanb 10
Abstract 1
Objectives. Research examining the factors influencing selection within talented junior 2
Rugby League players is limited. The aims of this study were firstly to determine whether 3
differences existed for anthropometric and performance characteristics between regional and 4
national selection in high performance UK junior Rugby League players, and secondly to 5
identify variables that discriminated between these selection levels. Method. Regional 6
representative (n=1,172) selected junior players (aged 13-16 years) undertook an 7
anthropometric and fitness testing battery with players split according to selection level (i.e., 8
national, regional). Results. MANCOVA analyses, with age and maturation controlled, 9
identified national players as having lower sum of 4 skinfolds scores compared to regional 10
players, and also performed significantly better on all physical tests. Stepwise discriminant 11
analysis identified that estimated maximum oxygen uptake (VO2max), chronological age, body 12
mass, 20m sprint, height, sum of 4 skinfolds and sitting height discriminated between 13
selection levels, accounting for 28.7% of the variance. This discriminant analysis 14
corresponded to an overall predictive accuracy of 63.3% for all players. Conclusions. These 15
results indicate that performance characteristics differed between selection levels in junior 16
Rugby League players. However, the small magnitude of difference between selection levels 17
suggests that physical qualities only partially explain higher representative selection. The 18
monitoring and evaluation of such variables, alongside game related performance 19
characteristics, provides greater knowledge and understanding about the processes and 20
consequences of selection, training and performance in youth sport. 21
22
23
24
Introduction 1
Rugby League is a collision sport played at junior and senior levels around the world 2
with game popularity most established in Great Britain, France, Australia and New Zealand1,2. 3
The game involves frequent periods of high-intensity activities (e.g. tackling, ball carrying) 4
separated by bouts of low intensity activity (e.g. jogging; 3,4). Due to the physically 5
demanding nature of the game, players are required to have highly developed physiological 6
capacities of muscular strength, power, speed, agility and aerobic power 2,5,6. 7
In the UK, the Rugby Football League (RFL) used a player performance pathway for 8
the selection of high performance junior players (See Till et al., 7 for a more detailed 9
description of the pathway). The major purpose of the pathway was to assist in the 10
development of the most talented junior players with regional and national representative 11
selection key components of this development model. Regional selection (i.e., County 12
standard – Yorkshire, North-West, Cumbria in the UK) resulted in 100 players being selected 13
at under 13, 14 and 15 annual-age categories each year in which players attended a week long 14
training camp to undertake specialised coaching and training. Following performances at 15
regional level, players were then selected for national level (n=40 at Under 13s; n=24 at under 16
14 and 15 each year) where they received further support and development from the RFL. 17
Therefore, the RFL identified 100 talented players at each annual-age group each year to 18
regional level with the best of this group of players selected to respective national squads. 19
Previous research in junior Rugby League players 3,8-11 has shown that anthropometric 20
and physiological characteristics increase and develop across annual-age groups and playing 21
level. For instance, Gabbett 8 showed improved capacities as age increased from under 13 to 22
senior aged players, while further studies 10,11 found body mass, vertical jump, speed, agility 23
and estimated aerobic power to differentiate between elite (Australian National Rugby League 24
youth sports contexts, such as field hockey 12 and volleyball 13 has begun to assess whether 1
anthropometric, physiological and skill data also discriminate between junior players within a 2
similar age and stage of development. For example, in volleyball 13, no differences in 3
anthropometric and physiological characteristics were found between selected (n=19) and 4
non-selected (n=9) players to a Queensland Academy of Sport Talent Search Program. 5
Instead results found that passing accuracy, passing technique and spiking technique were the 6
discriminating factors. However, in junior handball players 14, findings identified that body 7
mass, arm length, standing long jump, vertical jump and shuttle speed were able to distinguish 8
between elite and non-elite players. 9
Unlike heterogeneous samples (i.e., different ages, stages of development and skill 10
levels) where anthropometric and physiological differences may be more striking, it is 11
difficult based on research to date, to consistently assume which variables are able to 12
discriminate between more homogenous (i.e., similar age and skill levels) samples in a given 13
sport context. Although studies have compared characteristics across age-categories and skill 14
levels in youth sport, no study has directly examined how anthropometric and performance 15
characteristics contribute to regional or national selection within a developmental and 16
representative group of junior Rugby League players. Thus using a large sample with data 17
collected over a number of years from the RFL player performance pathway, the initial 18
purpose of this study was to determine if differences existed for anthropometric and 19
performance characteristics between regional and nationally selected players, whilst 20
controlling for chronological age and maturation. The secondary purpose was to identify 21
potential variables which discriminated between the selection levels and were able predict the 22
likelihood of being a national compared to regional representative junior player. 23
24
Participants: A total of 1,172 regional representative selected junior rugby league 1
players participated in the study. The data were separated by selection level (regional n=870; 2
national n= 302) and by annual-age category (Under 13 regional n=255, national n=130; 3
Under 14 regional n=309, national n=86; Under 15 regional n=306, national n=86). All 4
players undertook an anthropometric and fitness assessment, in which all protocols received 5
institutional ethics approval with parental and/or guardian consent provided. 6
Procedures: Fitness testing results from the 2005 to 2008 RFL’s Regional 7
representative squads were collected in July each year. All assessments were carried out by 8
Leeds Metropolitan Sport Science Support Team, however all tests were decided by the RFL. 9
Standard anthropometry (height, sitting height, body mass, sum of 4 skinfolds), maturation 10
(age at peak height velocity; PHV) and performance characteristics (lower and upper body 11
power, speed, agility, estimated maximum oxygen uptake) were collected for each participant 12
during the regional camp. 13
Anthropometry: Height and sitting height were measured using a Seca Alpha stand, to 14
the nearest 0.1cm. Body mass, was measured using calibrated Seca alpha (model 770) scales, 15
to the nearest 0.1kg. The sum of four skinfold thickness was determined using calibrated 16
Harpenden skinfold callipers (British Indicators, UK) with procedures in accordance with 17
Hawes and Martin [15]. Intraclass correlation coefficients and typical error measurements for 18
reliability of skinfold measurements were r=0.954 (p<0.001) and 3.2% respectively, 19
indicating acceptable reliability based on established criteria (i.e., > .80; 16). 20
Maturation (Age at PHV): To measure maturity status, an age at PHV prediction 21
equation was used 17. The 95% confidence interval associated with this equation for boys is 22
±1.18 years 17. Years from PHV was calculated by subtracting age at PHV from chronological 23
Performance Characteristics: To assess lower body power a vertical jump was 1
measured using a Takei vertical jump metre (Takei Scientific Instruments Co. Ltd, Japan). A 2
countermovement jump with hands positioned on hips was used, with jump height measured 3
to the nearest cm. The vertical jump score was the highest value recorded during three trials 4
18
. The intraclass correlation coefficient and typical error measurement for the vertical jump 5
was r=0.903 (p<0.001) and 2.9%, respectively. 6
The 2kg medicine ball (Max Grip, China) chest throw was used to measure upper 7
body power 19. Participants were seated with their backs against a wall and were instructed to 8
throw the ball horizontally as far as possible. Distance was measured to the nearest 0.1cm 9
from the wall to where the ball landed with the furthest of three trials used as the score. The 10
intraclass correlation coefficient and typical error measurement for the medicine ball chest 11
throw was r=0.965 (p<0.001) and 0.6%, respectively. 12
Running speed was assessed over 10m, 20m, 30m and 60m using timing gates 13
(Brower Timing Systems, IR Emit, USA). Times were recorded to the nearest 0.01s, with the 14
shortest time recorded during 3 trials used for the sprint measurement. Intraclass correlation 15
coefficients and typical error measurements of the 10m, 20m, 30m and 60m sprints were 16
r=0.788 (p<0.001), r=0.852 (p<0.001), r=0.899 (p<0.001)and r=0.924 (p<0.001), and 8.4%, 17
4.5%, 3.3% and 2.3% respectively. 18
Change of direction speed was assessed using the agility 505 test 20. Participants were 19
positioned 15m from a turning point with timing gates positioned 10m from the start point. 20
Players accelerated from the starting point, through the timing gates, turned on the 15m line 21
and ran as quickly as possible back through the gates 10. Three attempts were performed on 22
each foot with times recorded to the nearest 0.01s. Intraclass correlation coefficients and 23
typical error measurements for the agility 505 left and right were r=0.823 and r=0.844 24
Maximal oxygen uptake (VO2max) was estimated using the multistage fitness test 21. 1
Keeping in time with a series of beeps, on a pre-recorded multistage fitness test compact disc, 2
players were required to shuttle run 20m. Player’s running speed (i.e. frequency of the beeps) 3
increased progressively until they reached volitional exhaustion. Regression equations were 4
used to estimate maximal oxygen uptake from the level reached during the multistage fitness 5
test 21. Intraclass correlation coefficients and typical error measurements for the multistage 6
fitness test were 0.90 and 3.1%11. 7
Data Analysis:Mean and standard deviation (SD) scores were calculated for all 8
dependant variables with selection level acting as the independent variable. A multivariate 9
analysis of covariance (MANCOVA) test was applied with selection level (regional vs 10
national) as the fixed factor. Chronological age and maturity (Years from PHV) were entered 11
as covariates to adjust for variations in age and maturation status. Partial eta squared effect 12
sizes (η²) were also calculated. For identifying discriminating variables between regional and 13
national players, a stepwise discriminant analysis was applied with selection level used as the 14
discrete outcome variable. SPSS version 15.0 was used for all analysis with significance set as 15
p<0.05. 16
17
Results 18
Regional & National Characteristics:Table 1 presents the mean and SD of the 19
anthropometric and performance measures across selection levels (i.e. regional and national). 20
Results identified that chronological age had a confounding effect on all measures whilst 21
maturation had a significant effect on all variables except vertical jump and 60m sprint. 22
MANCOVA analyses between selection levels for all players revealed that national players 23
significantly outperformed regional players for sum of skinfolds, vertical jump, medicine ball 24
Insert Table 1 near here 1
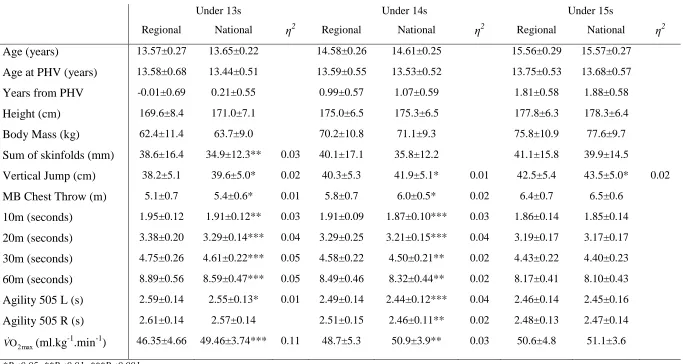
Annual-age categories: Table 2 presents the means and standard deviations of 2
characteristics across selection level by annual-age category (i.e. under 13s, 14s, 15s). 3
MANCOVA analyses identified national player’s outperformed Regional players at under 13 4
for sum of four skinfolds and all performance characteristics except agility 505 right. At the 5
under 14 age category national players outperformed regional players on all performance 6
characteristics, however at the under 15s age category a significant difference was only 7
identified for the vertical jump performance. Therefore regional and national under 15 players 8
were similar for anthropometric and all but one physical characteristic. 9
Insert Table 2 near here 10
Predictors of National Selection: The stepwise discriminant analysis predicted that a 11
combination of seven variables would successfully discriminate between regional and 12
national players. The variables (in order) were estimated VO2max(0.980), chronological age 13
(0.966), body mass (0.953), 20m sprint (0.939), height (0.934), sum of 4 skinfolds (0.923) and 14
sitting height (0.917). The average squared canonical correlation was 0.287, showing that 15
these seven variables, accounted for 28.7% of the overall variance in the data set. Cross-16
validation results were calculated to identify correct classification of Regional and National 17
players based on the discriminant analysis. The discriminant analysis corresponded to an 18
overall predictive accuracy of 63.3% for all players with an accuracy of 62.6% and 65.1% for 19
Regional and National players respectively. 20
21
Discussion 22
The aims of the present study were to firstly determine if anthropometric and physical 23
performance differences existed (whilst controlling for chronological age and maturational 24
purpose was to identify potential variables which discriminated between the selection levels, 1
and were able to predict the likelihood of being a national compared to regional representative 2
junior player. To meet these purposes, a large relatively homogenous sample of high 3
performance junior players was utilised. The study differs from previous research in Rugby 4
League 8,10,11 and other sports contexts 14 where skill level comparisons have only been made 5
between more heterogeneous groups of elite and non-elite players. Likewise, the study adds to 6
present understanding by examining data obtained over four years of implementing a national 7
governing body’s talent identification and development pathway (i.e. RFL player performance 8
pathway). Present findings demonstrated a significant main effect for chronological age, 9
maturational status and selection level with both anthropometric and physical performance 10
differences found between selection levels. 11
Findings suggest that biological growth and physical performance qualities contribute 12
toward national selection level in UK junior Rugby League, even though the testing battery 13
was not used as a basis for selection. Chronological age and maturational status (years from 14
PHV), entered in the analyses as covariates to adjust for age and maturational variation, were 15
consistent and strong influences upon dependent variables. Effect sizes identified strong 16
relationships between chronological age and maturation with anthropometric characteristics 17
(e.g. sitting height, body mass). These outcomes were expected as they are used in the 18
prediction of age at PHV 17. Effect sizes between covariates and physical performance 19
measures were relatively smaller, with results consistent with the view that maturation is more 20
strongly related to anthropometric than performance measures 14, 22 during periods of growth 21
and development (i.e., puberty). 22
For anthropometric variables, the sum of four skinfolds produced a significant 23
difference between selection levels, which differs from comparisons of body fat, when 24
No differences were found for body mass in the current sample, which is consistent with 1
Gabbett et al. 11, however, contrasts with Gabbett and Herzig’s 10 whom identified significant 2
differences in body mass. Research in field hockey 12 and volleyball 13 found no significant 3
differences in anthropometric characteristics, with both studies examining a homogenous 4
(junior elite v sub-elite) sample. In contrast, Mohamed and colleagues 14 did find significant 5
differences in body mass, arm length, arm span and arm circumference in their elite and non-6
elite under 16 handball players, potentially highlighting the impact of sport demand, position 7
and contextual variables upon the dependent variables in such studies. 8
For physical performance variables, national players outperformed regional players on 9
all measures when controlling for chronological and maturational age. One possible 10
explanation for the greater physical qualities amongst national players could be the significant 11
difference in sum of four skinfolds. Previous research [23] has identified a negative 12
relationship between body fat and performance (e.g. vertical jump) with possible reasons due 13
to a reduction in power to body mass ratio 4 and an increase in thermoregulation demands 2. 14
Assuming all other things are equal, the increased body fat of regional players could have led 15
to a decrease in vertical jump, speed, change of direction speed and estimatedVO2max; thereby 16
impacting the level of discrimination between regional and national levels. 17
Current findings for performance measures are consistent with previous findings 10,11 18
with advanced physical performance characteristics contributing toward the likelihood of 19
national selection. However, although differences were evident, the magnitude of differences 20
between regional and national level in the current sample were small, when assessed against 21
differences between the Australian junior players (e.g., effect sizes for VO2maxwas η 2
=0.04 in 22
the present analysis). A more descriptive example of this is the 0.02s difference in 10m sprint 23
time between regional and national players in the current sample compared to 0.13s 11 and 24
comparisons between groups that are substantially different in performance and/or skill level 1
can be problematic, as they overstate the importance of physical qualities toward playing 2
success 24. The current sample of junior Rugby League players, who were all selected based 3
on a broader basis of overall Rugby League performance, provides a more refined evaluation 4
and discrimination between high performance playing levels than has been presented 5
previously. The findings from this study identify that although physical qualities underpin 6
playing success in Rugby League, the small differences in performance characteristics 7
between regional and national players reported here, suggest that physical attributes combined 8
with technical skills and tactical knowledge are all important for player selection at national 9
junior level. 10
In similar research studies 12,13, where talented youngsters have been examined, 11
technical characteristics (e.g. passing technique and accuracy in volleyball; 13) have been 12
shown to discriminate between selection levels. The lack of such assessments on technical 13
and tactical skills amongst the current sample is a limitation of the present study. Although 14
the current study only provides anthropometric and physical performance characteristics, 15
coaches in the RFL pathway did provide an overall player evaluation, including attributes 16
related to technical, tactical and attitude, which were measured subjectively. These may be 17
useful indices in future studies. 18
The stepwise discriminant analysis determined that seven variables distinguished 19
between regional and national players. These included (in order): estimated VO2max, 20
chronological age, body mass, 20m sprint, height, sum of 4 skinfolds and sitting height, 21
accounting for 28.7% of the overall variance. This means that seven anthropometric and 22
physical performance measures accounted for 28.7% of those selected, with the remaining 23
71.3% likely to be made up from other variables associated with Rugby League performance 24
age and anthropometric characteristics, demonstrating that in high performance junior groups, 1
selection is affected and biased by particular factors and processes previously identified (e.g., 2
relative age effects, 7,23). 3
Conclusion 4
In summary, the present study examined differences in anthropometric and 5
performance measures within a relatively homogenous high performing group of junior 6
Rugby League players. Findings identified that national players outperformed their regionally 7
selected counterparts on performance measures. However, due to the small magnitude in these 8
differences, physical attributes may only partially contribute toward national selection in 9
junior Rugby League. Instead, it seems more appropriate to consider a combination of 10
physical, technical, tactical and psychological variables as more able to identify high 11
performing players for a given context and stage of development. Thus, in talent identification 12
research, it is important that future studies consider carefully, the sport context, age and skill 13
level of participants, as well as the nature of referent groups used for comparison. 14
15
Practical Implications 16
Junior Rugby League coaches should consider chronological age and maturational 17
status in player assessments. 18
Junior coaches should highlight the importance of low body fat to physical 19
performance. 20
Player selection should consider physical, technical, tactical and psychological 21
variables. 22
The sport context, participant characteristics (e.g. age, skill level) and levels of 23
comparison should be considered when examining selection within junior sport. 24
Acknowledgements 1
This research was supported by the Rugby Football League (RFL) and the authors would like 2
to thank the RFL for providing data. 3
References 1
1. Brewer J, Davis J. Applied physiology of rugby league. Sports Med; 1995: 20: 129–135. 2
2. Meir R, Newton R, Curtis E, et al. Physical fitness qualities of professional football 3
players: Determination of positional difference. J Strength Cond Res; 2001: 15: 450–458. 4
3. Gabbett TJ. A comparison of physiological and anthropometric characteristics among 5
playing positions in junior rugby league players. Br J Sports Med; 2005: 39: 675-680. 6
4. Gabbett TJ. Applied Physiology of Rugby League. Sports Med; 2008: 38: 119-138. 7
5. Baker D. Comparison of upper-body strength and power between professional and 8
college-aged rugby league players. J Strength Cond Res; 2001: 15: 30–35. 9
6. Baker DG, Newton RU. Comparison of lower body strength, power, acceleration, speed, 10
agility, and sprint momentum to describe and compare playing rank among professional 11
rugby league players. J Strength Cond Res; 2008: 22: 153-158. 12
7. Till K, Cobley S, Wattie N, et al. The prevalence, influential factors and mechanisms of 13
relative age effects in UK rugby league. Scand J Sci Med Sports; 2010: 20: 320-329. 14
8. Gabbett TJ. Physiological characteristics of junior and senior rugby league players. Br J 15
Sports Med; 2002: 36: 334–339. 16
9. Gabbett TJ. Performance changes following a field conditioning program in junior and 17
senior rugby league players. J Strength Cond Res; 2006: 20: 215-221. 18
10.Gabbett TJ, Herzig PJ. Physiological characteristics of junior elite and sub-elite rugby 19
league players. Strength Cond Coach; 2004: 12: 19–24. 20
11.Gabbett TJ, Kelly J, Ralph S, et al. Physiological and anthropometric characteristics of 21
junior elite and sub-elite rugby league players, with special reference to starters and non 22
12.Elferink-Gemser MT, Visscher C, Lemmink KAPM, et al. Relation between 1
multidimensional performance characteristics and level of performance in talented youth 2
hockey players. J Sports Sci; 2004: 22: 1053-1063. 3
13.Gabbett TJ, Georgieff B, Domrow N. The use of physiological, anthropometric and skill 4
data to predict selection in a talent-identified junior volleyball squad. J Sports Sci; 2007: 25: 5
1337-1344. 6
14.Mohamed H, Vaeyens R, Matthys S, et al. Anthropometric and performance measures for 7
the development of a talent detection and identification model in youth handball. J Sports Sci; 8
2009: 27: 257-266. 9
15.Hawes MR, Martin AD. Human Body Composition. In: Eston, R. ed. and Reilly, T. ed. 10
(2001). Kinanthropometry and exercise physiology laboratory manual: Tests, procedures and 11
data second edition. Volume 1: Anthropometry. 2001: London, Routledge. 7–43. 12
16.Hopkins WG. Measures of reliability in sports medicine and science. Sports Med; 2000: 13
30, 1-15. 14
17.Mirwald RL, Baxter-Jones ADG, Bailey DA, et al. An assessment of maturity from 15
anthropometric measurements. Med Sci Sports Exerc; 2002: 34: 689-694. 16
18.Pyne DB, Gardner AS, Sheehan K, et al. Fitness Testing and career progression in AFL 17
Football. J Sci Med Sport; 2005: 8: 321-332. 18
19.Stockbrugger BA, Haennel RG. Contributing factors to performance of a medicine ball 19
explosive power test: a comparison between jump and non jump athletes. J Strength Cond 20
Res; 2003: 17: 768-774. 21
20.Ellis L, Gastin P, Lawrence S, et al. Protocols for the physiological assessment of team 22
sport players. In: Core, C.J., ed. Physiological tests for elite athletes; 2000: Champaign, 23
21.Ramsbottom R, Brewer J, Williams C. A progressive shuttle run test to estimate maximal 1
oxygen uptake. Br J Sports Med; 1988: 22: 141–144. 2
22.Beunen G, Ostyn M, Simons J, et al. A correlational analysis of skeletal maturity, 3
anthropometric measures and motor fitness in boys 12 through 16. In F. Landry & W. A. R. 4
Orban (Eds), Biomechanics of sport and kinanthropometry: International Congress of 5
Physical Activity Sciences (pp. 343-350). 1978: Miami, FL: Symposia Specialists. 6
23.Till K, Cobley S, O’Hara J, et al. Anthropometric, physiological and selection 7
characteristics in high performance UK junior Rugby League players. Talent Development & 8
Excellence. In press. 9
24.Young WB, Newton RU, Doyle TL, et al. Physiological and anthropometric 10
characteristics of starters and non starters and playing positions in elite Australian Rules 11
Table 1. Selection Level (regional v national) characteristics of UK junior Rugby League players.
Covariates
Regional National Age Years PHV MANCOVA η2
Age (years) 14.62 ± 0.84 14.47 ± 0.84
Age at PHV (years) 13.64 ± 0.58 13.54 ± 0.54
Years from PHV 0.98 ± 0.95 0.93 ± 0.90
Height (cm) 174.4 ± 7.8 174.4 ± 7.4 *** **
Body Mass (kg) 69.7 ± 12.3 69.8 ± 10.9 *** **
Sum of skinfolds (mm) 40.0 ± 16.3 36.6 ± 13.1 *** ** *** 0.01
Vertical Jump (cm) 40.4 ± 5.5 41.3 ± 5.3 *** *** 0.01
MB Chest Throw (m) 5.8 ± 0.8 5.9 ± 0.8 * * * 0.01
10m (seconds) 1.90 ± 0.12 1.88 ± 0.12 *** ** *** 0.02
20m (seconds) 3.27 ± 0.19 3.23 ± 0.16 *** ** *** 0.03
30m (seconds) 4.57 ± 0.26 4.52 ± 0.24 *** * *** 0.03
60m (seconds) 8.49 ± 0.55 8.37 ± 0.49 *** *** 0.03
Agility 505 L (s) 2.51 ± 0.15 2.49 ± 0.14 *** *** *** 0.01
Agility 505 R (s) 2.53 ± 0.15 2.51± 0.14 *** ** ** 0.01
2max O
V (ml.kg-1.min-1) 48.7 ± 5.2 50.3 ± 3.8 *** *** *** 0.04
Table 2. Selection level and age category characteristics of UK junior Rugby League players.
Under 13s Under 14s Under 15s
Regional National η2 Regional National η2 Regional National η2
Age (years) 13.57±0.27 13.65±0.22 14.58±0.26 14.61±0.25 15.56±0.29 15.57±0.27
Age at PHV (years) 13.58±0.68 13.44±0.51 13.59±0.55 13.53±0.52 13.75±0.53 13.68±0.57
Years from PHV -0.01±0.69 0.21±0.55 0.99±0.57 1.07±0.59 1.81±0.58 1.88±0.58
Height (cm) 169.6±8.4 171.0±7.1 175.0±6.5 175.3±6.5 177.8±6.3 178.3±6.4
Body Mass (kg) 62.4±11.4 63.7±9.0 70.2±10.8 71.1±9.3 75.8±10.9 77.6±9.7
Sum of skinfolds (mm) 38.6±16.4 34.9±12.3** 0.03 40.1±17.1 35.8±12.2 41.1±15.8 39.9±14.5
Vertical Jump (cm) 38.2±5.1 39.6±5.0* 0.02 40.3±5.3 41.9±5.1* 0.01 42.5±5.4 43.5±5.0* 0.02
MB Chest Throw (m) 5.1±0.7 5.4±0.6* 0.01 5.8±0.7 6.0±0.5* 0.02 6.4±0.7 6.5±0.6
10m (seconds) 1.95±0.12 1.91±0.12** 0.03 1.91±0.09 1.87±0.10*** 0.03 1.86±0.14 1.85±0.14
20m (seconds) 3.38±0.20 3.29±0.14*** 0.04 3.29±0.25 3.21±0.15*** 0.04 3.19±0.17 3.17±0.17
30m (seconds) 4.75±0.26 4.61±0.22*** 0.05 4.58±0.22 4.50±0.21** 0.02 4.43±0.22 4.40±0.23
60m (seconds) 8.89±0.56 8.59±0.47*** 0.05 8.49±0.46 8.32±0.44** 0.02 8.17±0.41 8.10±0.43
Agility 505 L (s) 2.59±0.14 2.55±0.13* 0.01 2.49±0.14 2.44±0.12*** 0.04 2.46±0.14 2.45±0.16
Agility 505 R (s) 2.61±0.14 2.57±0.14 2.51±0.15 2.46±0.11** 0.02 2.48±0.13 2.47±0.14
2max O
V (ml.kg-1.min-1) 46.35±4.66 49.46±3.74*** 0.11 48.7±5.3 50.9±3.9** 0.03 50.6±4.8 51.1±3.6